EU investment in R&D increased to €328 billion in 2021

In 2021, the EU spent €328 billion on research & development (R&D), up 6% compared with the previous year (€310 billion). Compared with 2011, there was a 43.9% increase. These rates of change are in current prices, meaning they reflect both price changes and real changes in the level of expenditure.
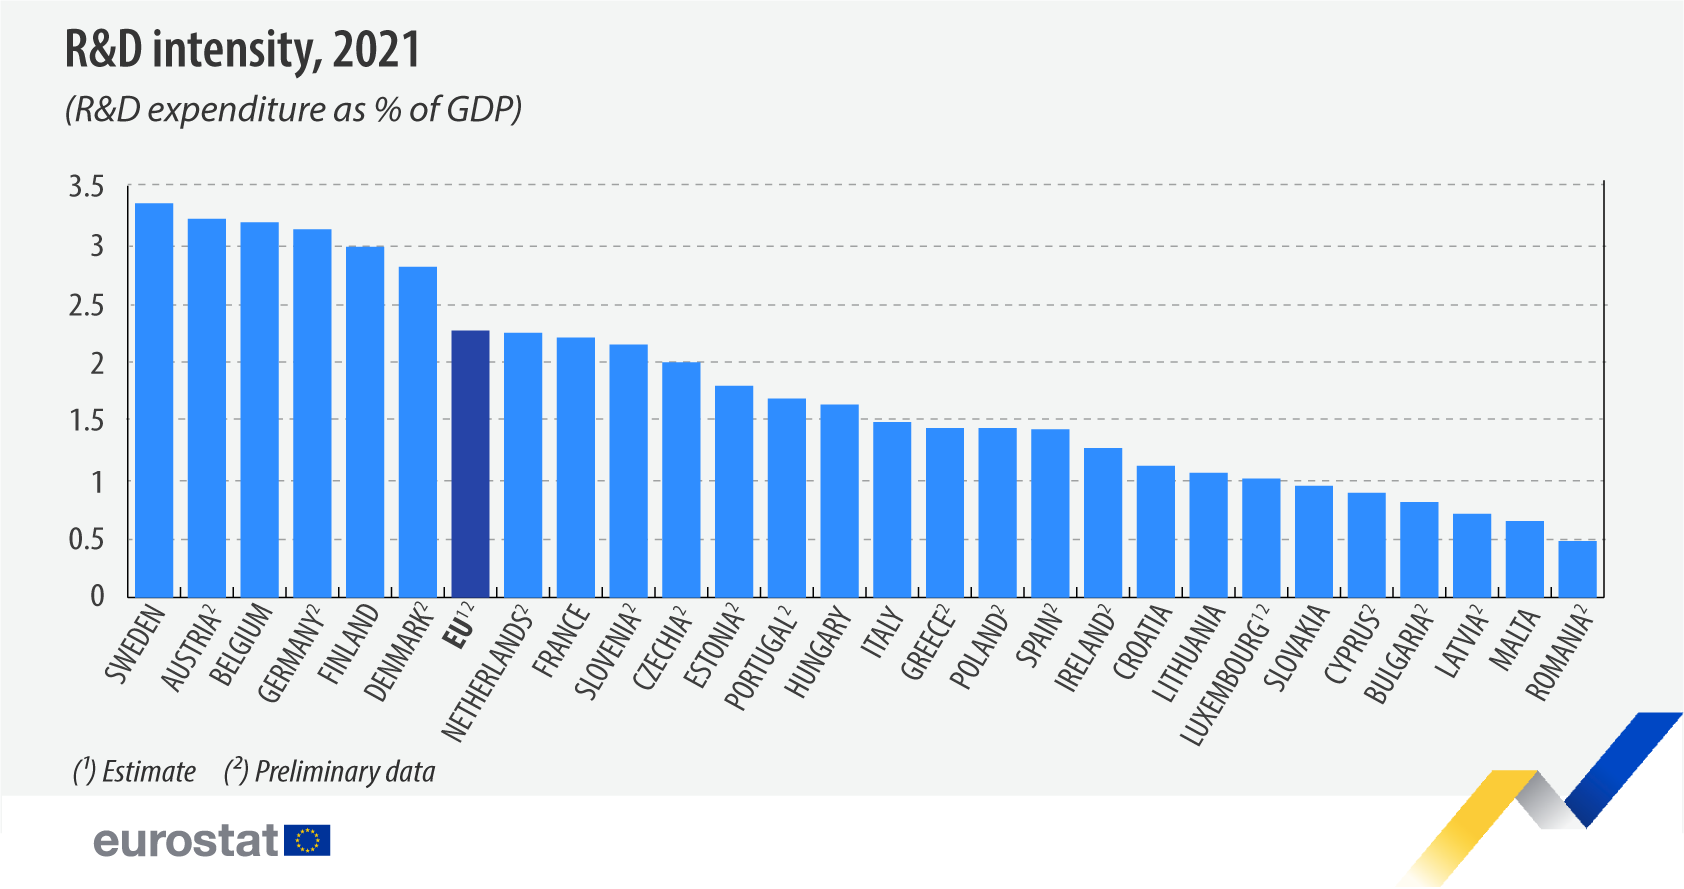
When looking at R&D intensity, i.e. R&D expenditure as a percentage of GDP, data show a decrease from 2.31% in 2020 to 2.27% in 2021. This fall could be explained by GDP rebound in 2021 after the significant drop in 2020 as a result of the COVID-19 pandemic. Still, compared with 2019 (2.23%), before the pandemic, R&D intensity increased by 0.04 percentage points (pp) in 2021, while compared with the previous 10 years, it increased by 0.25 pp.
R&D is a major driver of innovation, and R&D expenditure and intensity are two of the key indicators used to monitor resources devoted to science and technology worldwide.
This information comes from data on R&D expenditure published by Eurostat today. The article presents a handful of findings from the more detailed Statistics Explained article.
Source dataset: rd_e_gerdtot
Among the EU Member States, the highest R&D intensity in 2021 was recorded in Sweden (3.35%), followed by Austria (3.22%) and Belgium (3.19%). Six Member States reported R&D expenditure below 1% of their GDP in 2021: Romania (0.48%), Malta (0.65%), Latvia (0.71%), Bulgaria (0.81%), Cyprus (0.89%) and Slovakia (0.95%).
Two-thirds of EU Member States reported a higher R&D intensity in 2021 than in 2011. However, the most significant decreases in R&D intensity took place in Finland (-0.64 pp), Estonia (-0.51 pp), Ireland (-0.49 pp) and Luxembourg (-0.41 pp).
At the other end of the range, the biggest increases in R&D intensity between 2011 and 2021 were recorded in Belgium (+1.02 pp), Greece (+0.76 pp), Poland (+0.69 pp), Austria (+0.55 pp) and Croatia (+0.53 pp).
When we look at R&D expenditure by sector in the EU, the business enterprise sector continued to account for the largest share of the R&D (66.08% of total R&D disbursed in 2021), followed by the higher education sector (21.58%), the government sector (11.89%) and the private non-profit sector (0.44%).
For more information
- Statistics Explained article on R&D expenditure
- Thematic section on science, technology and innovation
- Database on science, technology and innovation
Methodological notes:
- 2021 data on R&D expenditure presented in this article are preliminary and might therefore be revised. Following the calendar for the transmission of data, updated figures will be published in March and September 2023.
If you have any queries, please visit our contact us page.

