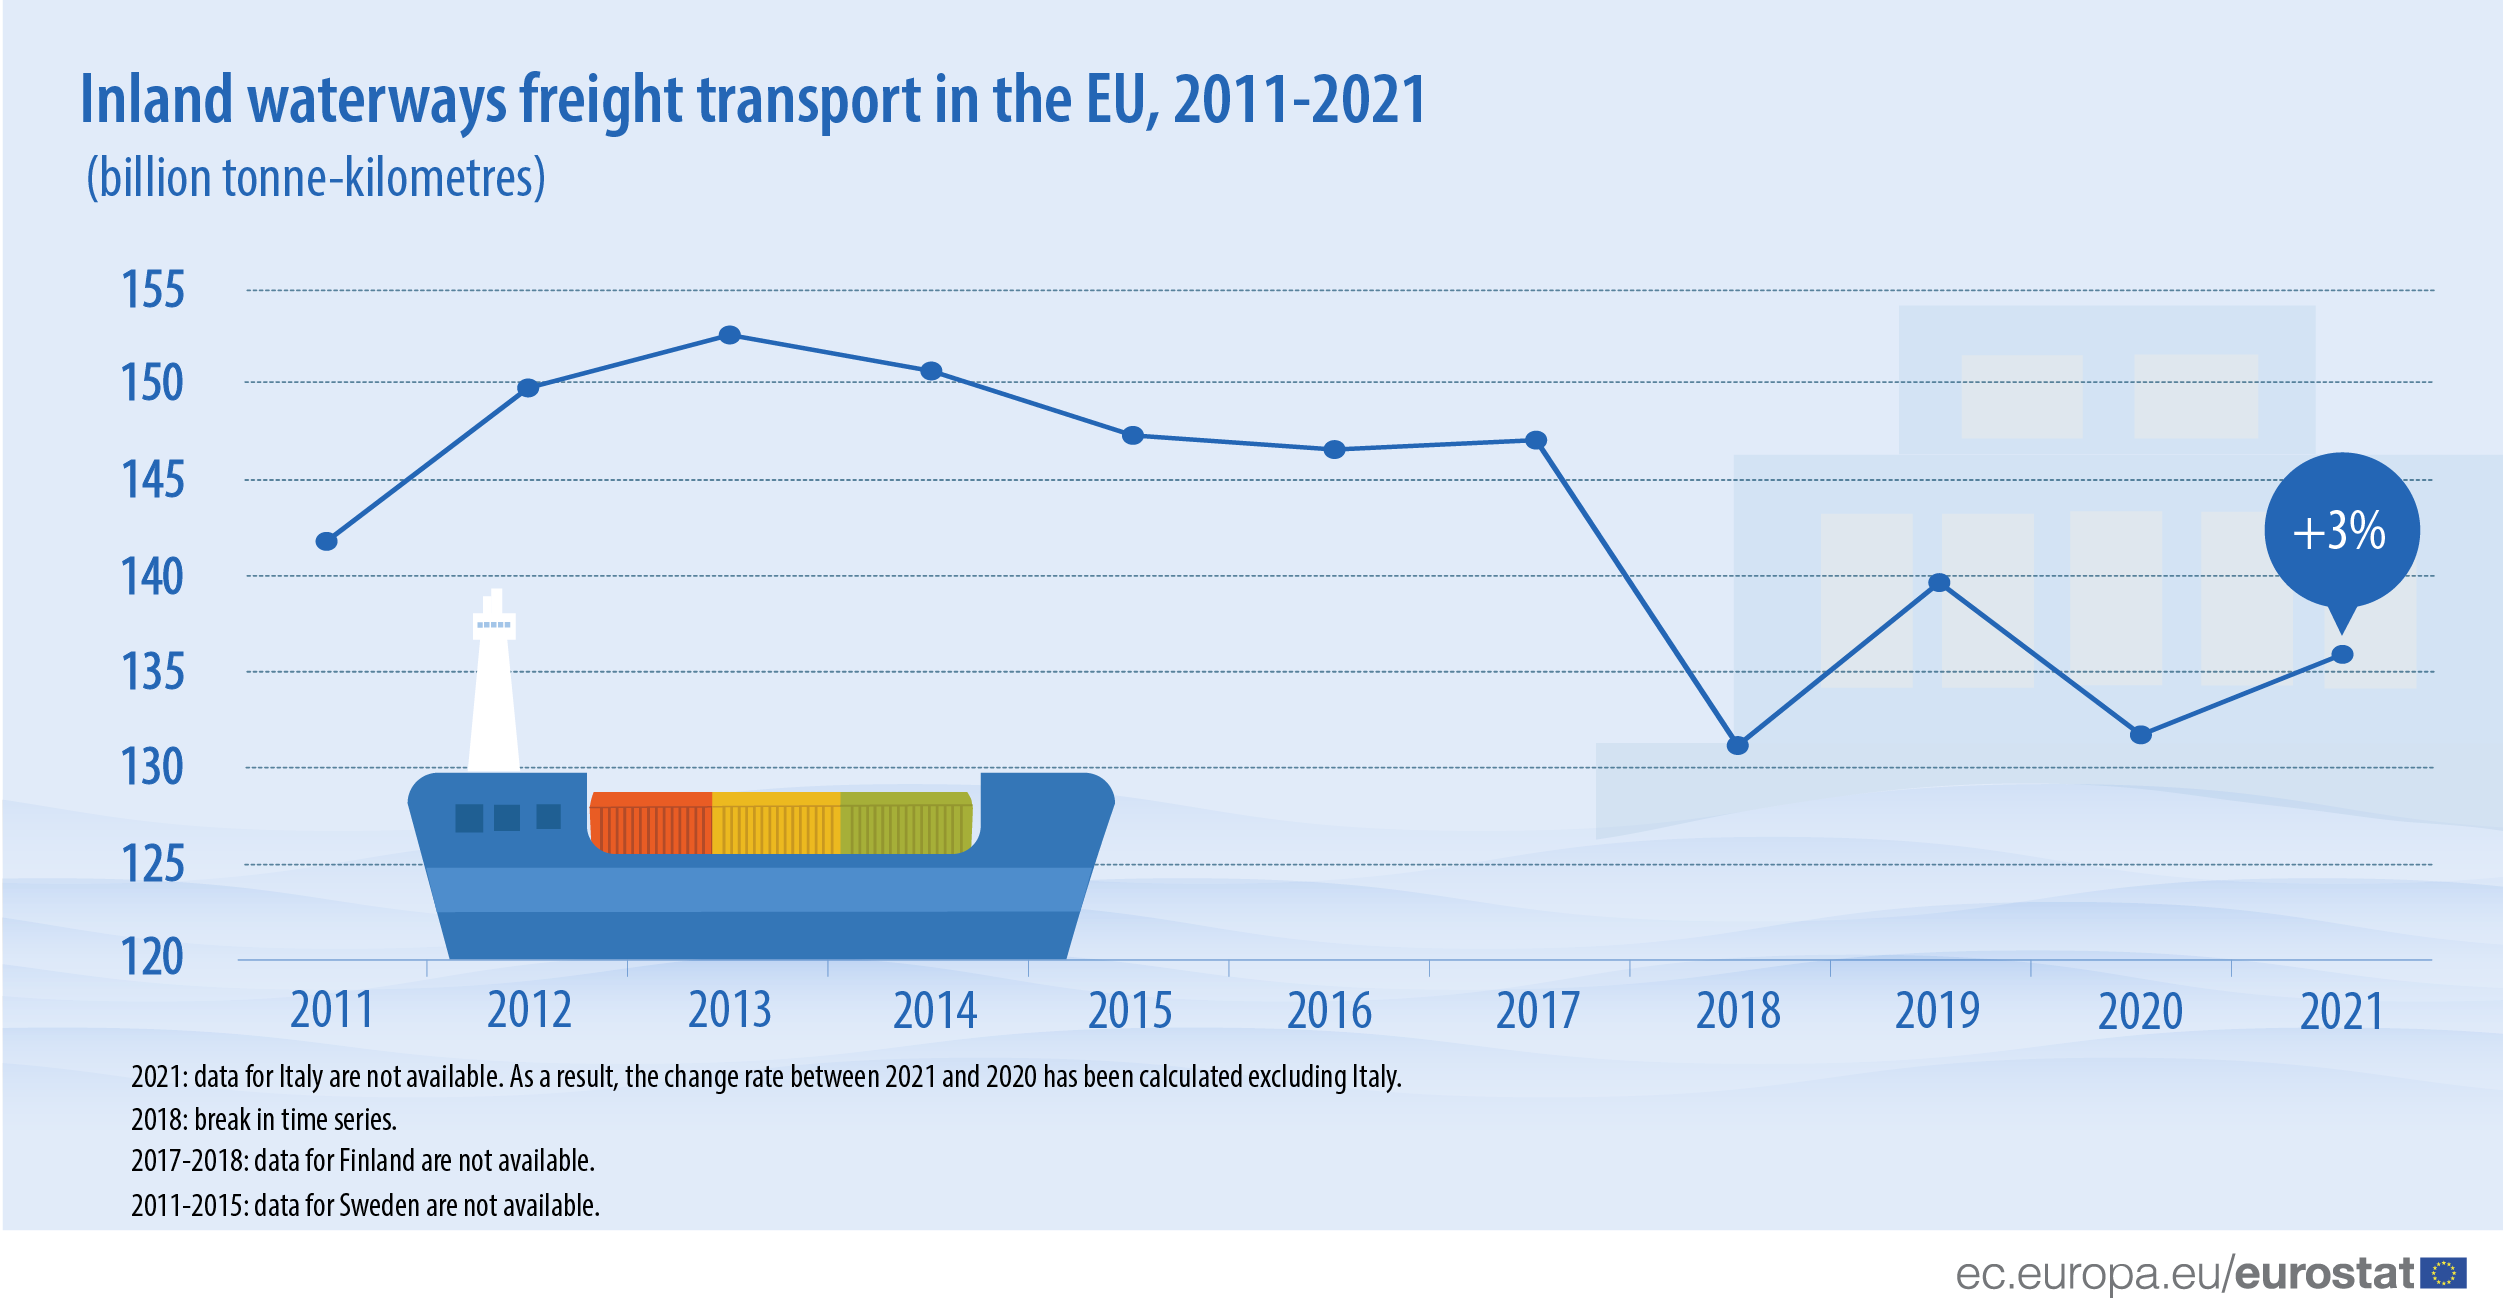
Between 2011 and 2021, transport activity on the EU’s inland waterways was volatile. Since 2017, the data have shown alternating rises and falls in activity, with the data for 2021 showing an increase of more than 3% (4 billion tonne-kilometres) compared with 2020. A similar trend can be observed for the same period in terms of tonnes, with a rise of 4% (19 million tonnes).
This information comes from data on inland waterways freight transport published today by Eurostat. The article presents a handful of findings from the more detailed Statistics Explained article.
Source dataset: iww_go_atygo
Germany and the Netherlands were the main contributors to EU inland waterways transport (in tonne-kilometres), accounting for 70% of the total in 2021. In the same year, the volume of transport (in tonne-kilometres) increased in 10 countries compared with 2020. In absolute values, Germany registered the highest increase with 2.2 billion tonne-kilometres. Meanwhile, the largest relative increases in 2021 compared with 2020 were recorded in Lithuania (+315%), Sweden (+80%) and Czechia (+23%). At the other end of the scale, the most significant relative decreases were observed in Poland (-30%), Bulgaria and Croatia (both -7%).
Source dataset: iww_go_anave
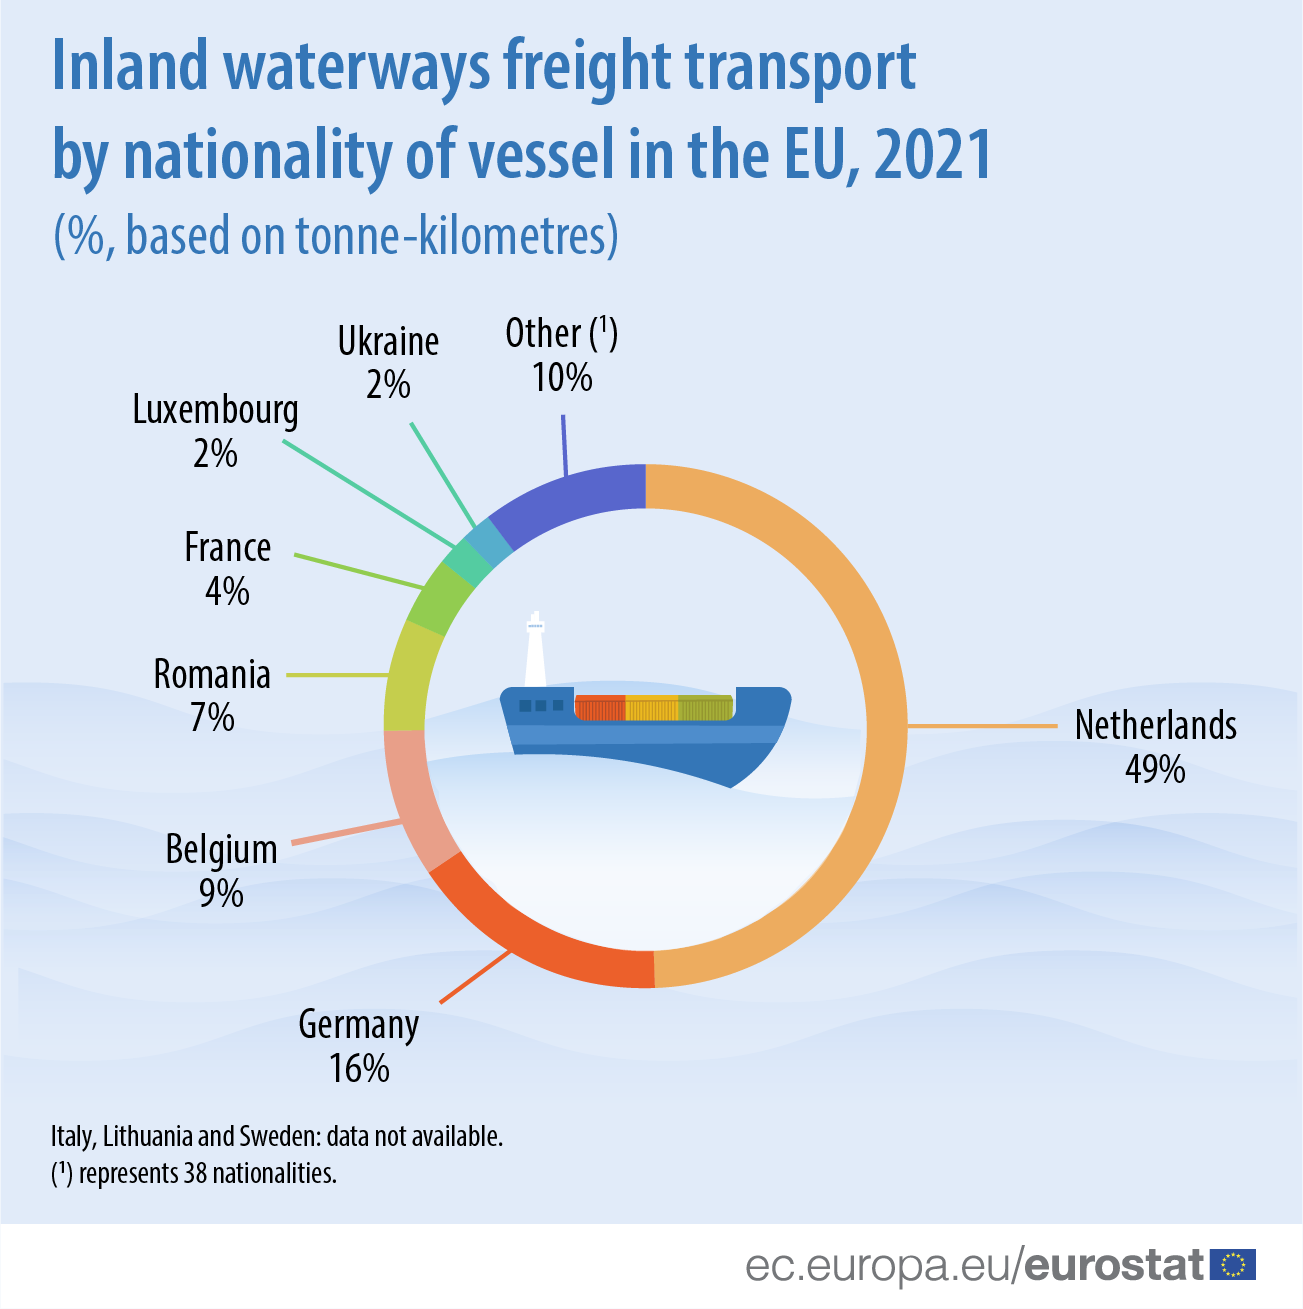
In 2021, almost half of the freight transport vessels on EU inland waterways were registered in the Netherlands (49%). The other half comprised of 44 different vessel nationalities, of which Germany (16%) and Belgium (9%) had the highest shares.
In 2021, Dutch vessels were in the top three nationalities for 5 countries out of 14 and were in first place in Belgium, Germany, Luxembourg and the Netherlands. Romania was also well represented in the top three vessel nationalities: first in three countries and second in another.
For more information:
- Statistics Explained article on inland waterways freight transport
- Dedicated section on transport
- Database on transport (Inland waterways transport > Inland waterways transport measurement – goods)
Methodological notes:
- For inland waterways freight transport in the EU:
- 2021: data for Italy are not available. As a result, the change rate between 2021 and 2020 has been calculated excluding Italy.
- 2018: break in time series.
- 2017-2018: data for Finland are not available.
- 2011-2015: data for Sweden are not available.
- For inland waterways freight transport by nationality of vessel:
- Italy, Lithuania and Sweden: data not available.
- Other: represents 38 nationalities.
To contact us, please visit our User Support page.
For press queries, please contact our Media Support.


