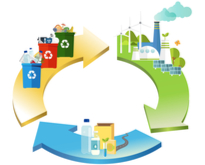
In 2016, the circularity rate of the European Union (EU) was 11.7%. This means that 11.7% of material resources used in the EU came from recycled products and recovered materials, thus saving primary raw materials from being extracted.
Compared with 2004, this share increased by 3.4 percentage points from 8.3%. This is primarily because the EU consumes less raw materials — such as construction materials and fossil fuels, while the amount of recycling only increases slightly.
The circularity rate is much lower than other indicators of circularity, such as recycling rates, which are around 55% in the EU. This is because the circularity rate has a much wider material scope: it includes all the materials that are fed into our economy, whereas the recycling rates only take account of waste.
Highest circularity rate in the Netherlands, lowest in Greece
Large differences in the circularity rates exist across countries. In 2016, the rates varied from 1.3% in Greece, 1.5% in Romania and 1.7% in Ireland to 18.9% in Belgium, 19.5% in France, and 29.0% in the Netherlands.
Differences are due not only to the amount of recycling in each country, but also to structural factors in national economies. For instance, the higher imports of materials (including fossil fuels) and the higher domestic extractions of materials (in turn related to mining, construction, etc), the lower the circularity rates.
For more information:
- Eurostat Statistics Explained article on Material flows in the circular economy
- Eurostat, Circular material use rate — Calculation method
- The source data can be found in Eurostat dataset env_ac_cur.
To contact us, please visit our User Support page.
For press queries, please contact our Media Support.

