
Almost one in five persons in the European Union (EU) is aged 65 or over (19.4%). This represents a population of nearly 100 million people.
The old-age dependency ratio is traditionally seen as an indication of the level of support available to older persons (those aged 65 or over) by the working age population, (those aged between 15 and 64). It also illustrates our ageing populations.
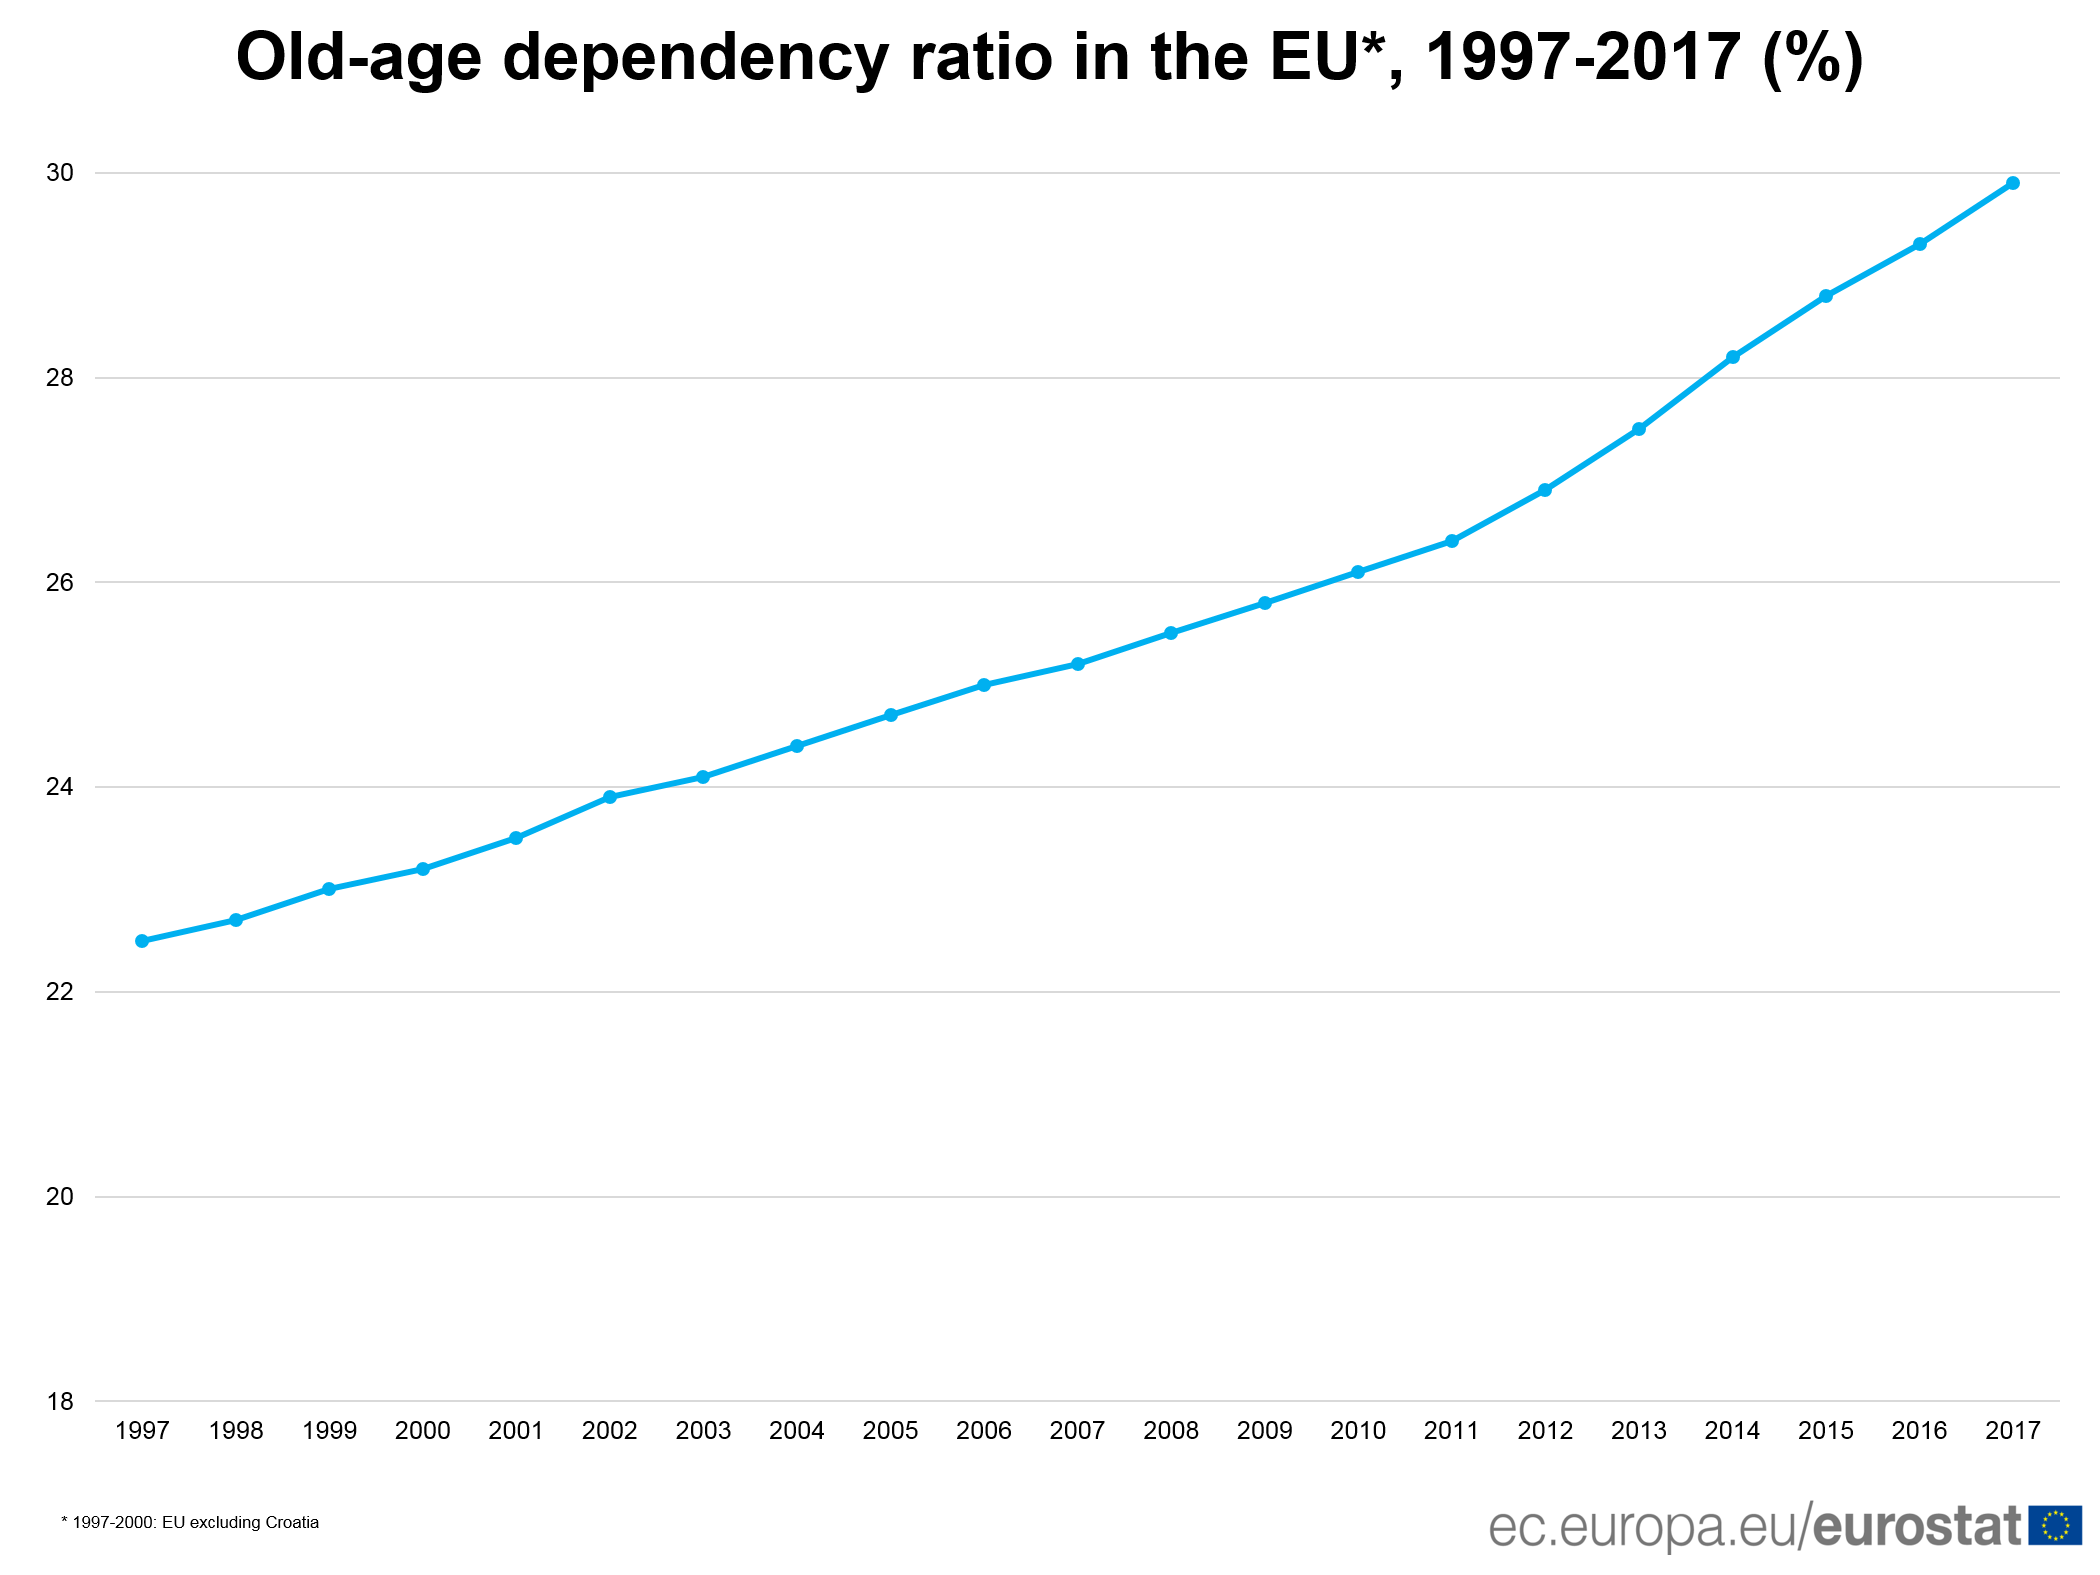
In the EU, the old-age dependency ratio was 29.9% in 2017. In other words, there were slightly more than three persons of working age for every person aged 65 or over. The EU’s old-age dependency ratio has been increasing for a long time. Twenty years ago, there were about five persons of working age for every person aged 65 or over. Ten years later, the ratio was 4:1 and today it is close to 3:1.
The source dataset can be found here.
Highest in Italy, Greece and Finland ; lowest in Luxembourg and Ireland
In 2017, across the EU Member States, the old-age dependency ratio was highest in Italy (34.8%), Greece (33.6%) and Finland (33.2%), followed by Portugal (32.5%) and Germany (32.4%).
At the opposite end of the scale, the lowest ratios were recorded in Luxembourg (20.5%) and Ireland (20.7%), ahead of Slovakia (21.5%) and Cyprus (22.8%). In these Member States, there were about five persons of working age for every older person.

The source dataset can be found here.
On the rise in all EU Member States, except Luxembourg
Over the last two decades, the old-age dependency ratio has increased in all Member States, except in Luxembourg where it fell from 21.2% in 1997 to 20.5% in 2017 (-0.7 percentage points – pp).
The largest increases between 1997 and 2017 were recorded in Finland (from 21.7% to 33.2%, or + 11.5 pp), Malta (+10.7 pp), Slovenia (+10.1 pp), Lithuania and Portugal (both +9.8 pp), Greece (+9.7 pp), Italy (+9.6 pp), Germany and Latvia (both +9.4 pp).
In contrast, increases were more moderate in Ireland (from 17.4% in 1997 to 20.7% in 2017, or +3.3 pp), the United Kingdom (+3.7 pp), Belgium (+3.9 pp) and Sweden (+4.2 pp).
For more information please contact us: estat-user-support@ec.europa.eu.