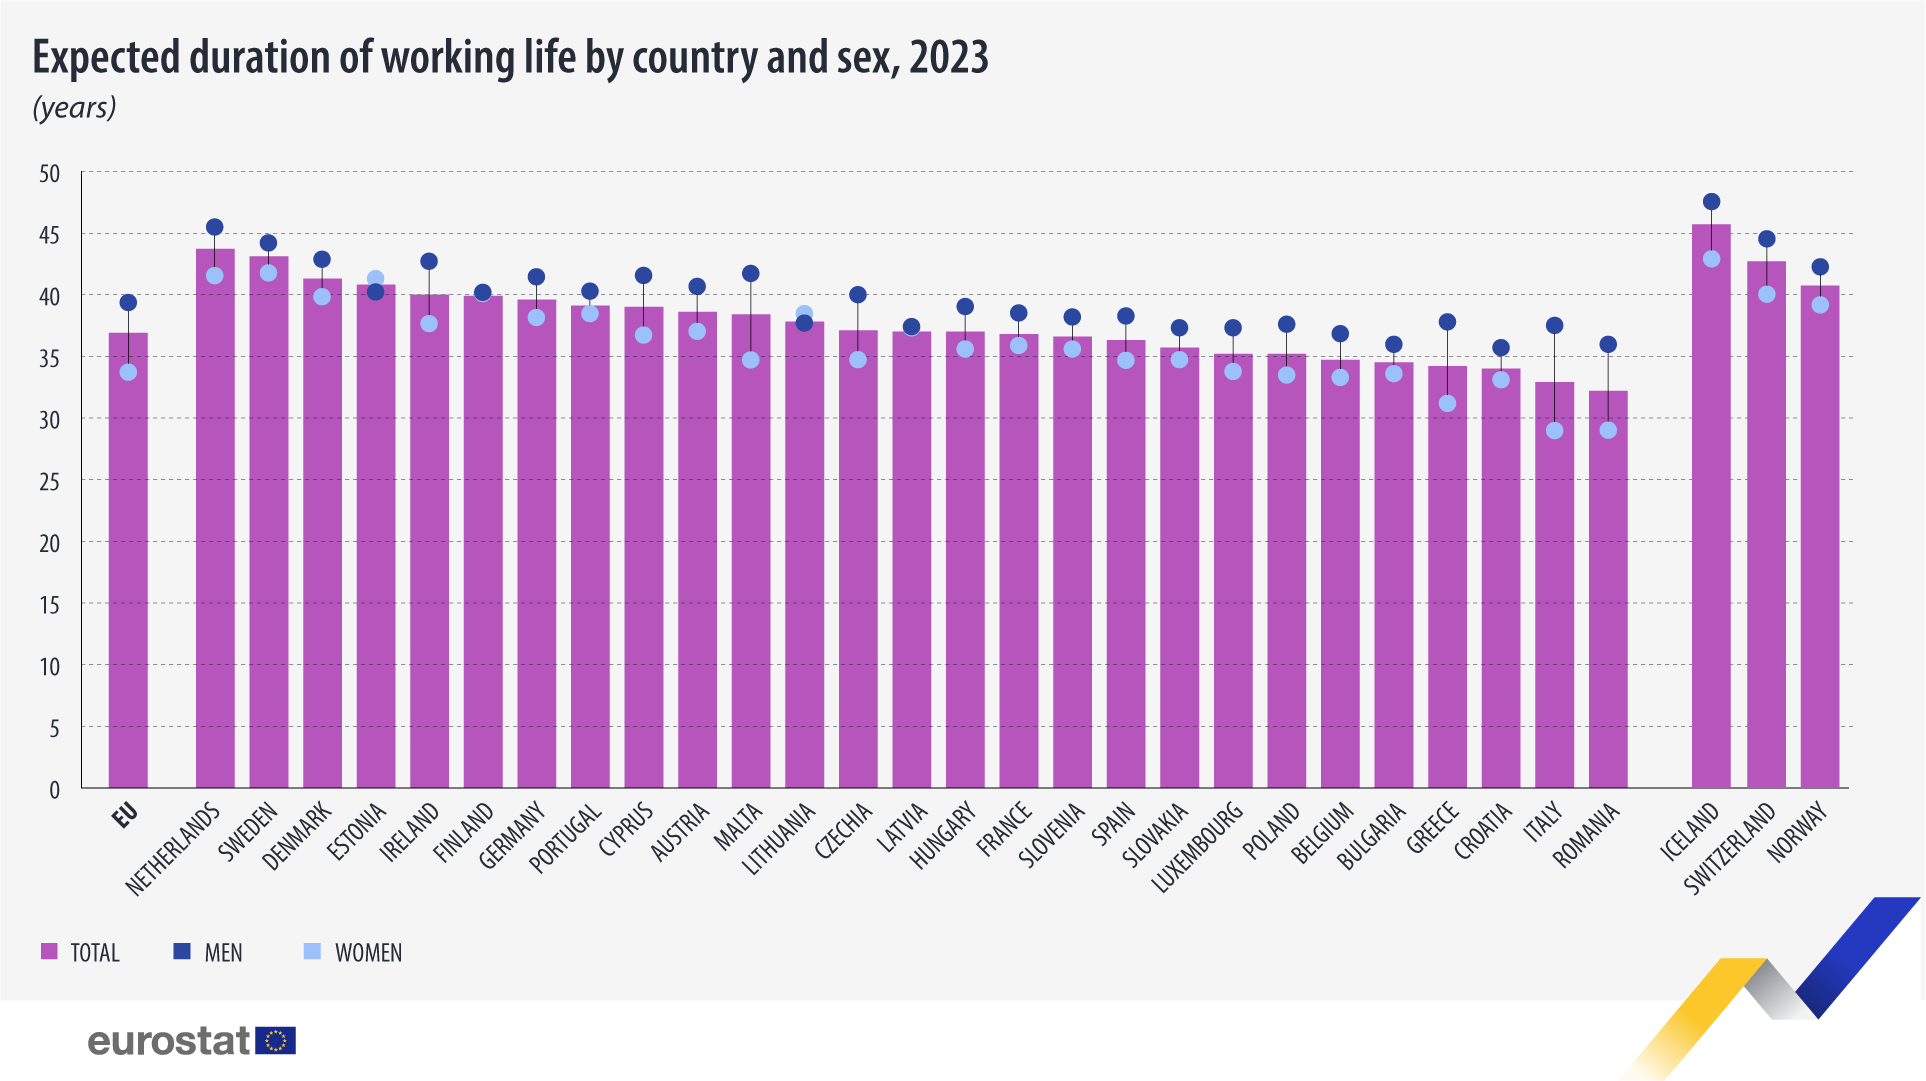
Duration of working life averaged 36.9 years in 2023

In 2023, the expected average duration of working life for 15-year-olds in the EU was 36.9 years. However, the expected average duration of working life varied broadly among EU countries.
In 2023, some of the durations in the EU exceeded 40 years. The highest were recorded in the Netherlands (43.7 years), Sweden (43.1 years) and Denmark (41.3 years). By contrast, the lowest working life durations were recorded in Romania (32.2 years), Italy (32.9 years) and Croatia (34.0 years).
This information comes from data on employment and unemployment published by Eurostat. This article presents some of the findings from the more detailed account in the related Statistics Explained article.
Source dataset: lfsi_dwl_a
Longer working lives for men than women on average
For men, the expected duration of working life was on average 39.0 years in the EU, with the longest durations recorded in the Netherlands (45.7 years), Sweden (44.1 years), Denmark and Ireland (both 42.8 years), and the shortest in Croatia (35.4), Bulgaria and Romania (both 35.6 years).
For women, the average duration of working life in the EU was 34.7 years, with the longest durations recorded in Sweden (41.9 years), followed by the Netherlands and Estonia (both 41.5 years), with the shortest in Italy (28.3 years), Romania (28.5 years) and Greece (30.6 years).

Source dataset: lfsi_dwl_a
Since 2013, the expected average duration of working life steadily increased in the EU. Then it declined for the first time in 2020 linked to the COVID-19 health crisis (from 34.7 years in 2013 to 35.9 years in 2019, then down to 35.6 years in 2020). In 2021, it came back to its pre-pandemic level.
For more information
- Statistics Explained article on Duration of working life - statistics
- Thematic section on the labour market
- Thematic section on equality and non-discrimination
- Database on labour force statistics
- Webinar on labour market statistics
- Statistics4beginners on the labour market
Methodological notes
The indicator ‘expected average duration of working life’ measures the expected number of years that a person, at the current age of 15 years, is expected to remain in the labour force throughout their life. It is estimated using the life expectancy and the share of employed and unemployed people in the population for each age.
If you have any queries, please visit our contact us page.
