EU trade of goods with Russia remains low

EU trade with Russia has been strongly affected by import and export restrictions imposed by the EU following Russia's invasion of Ukraine.
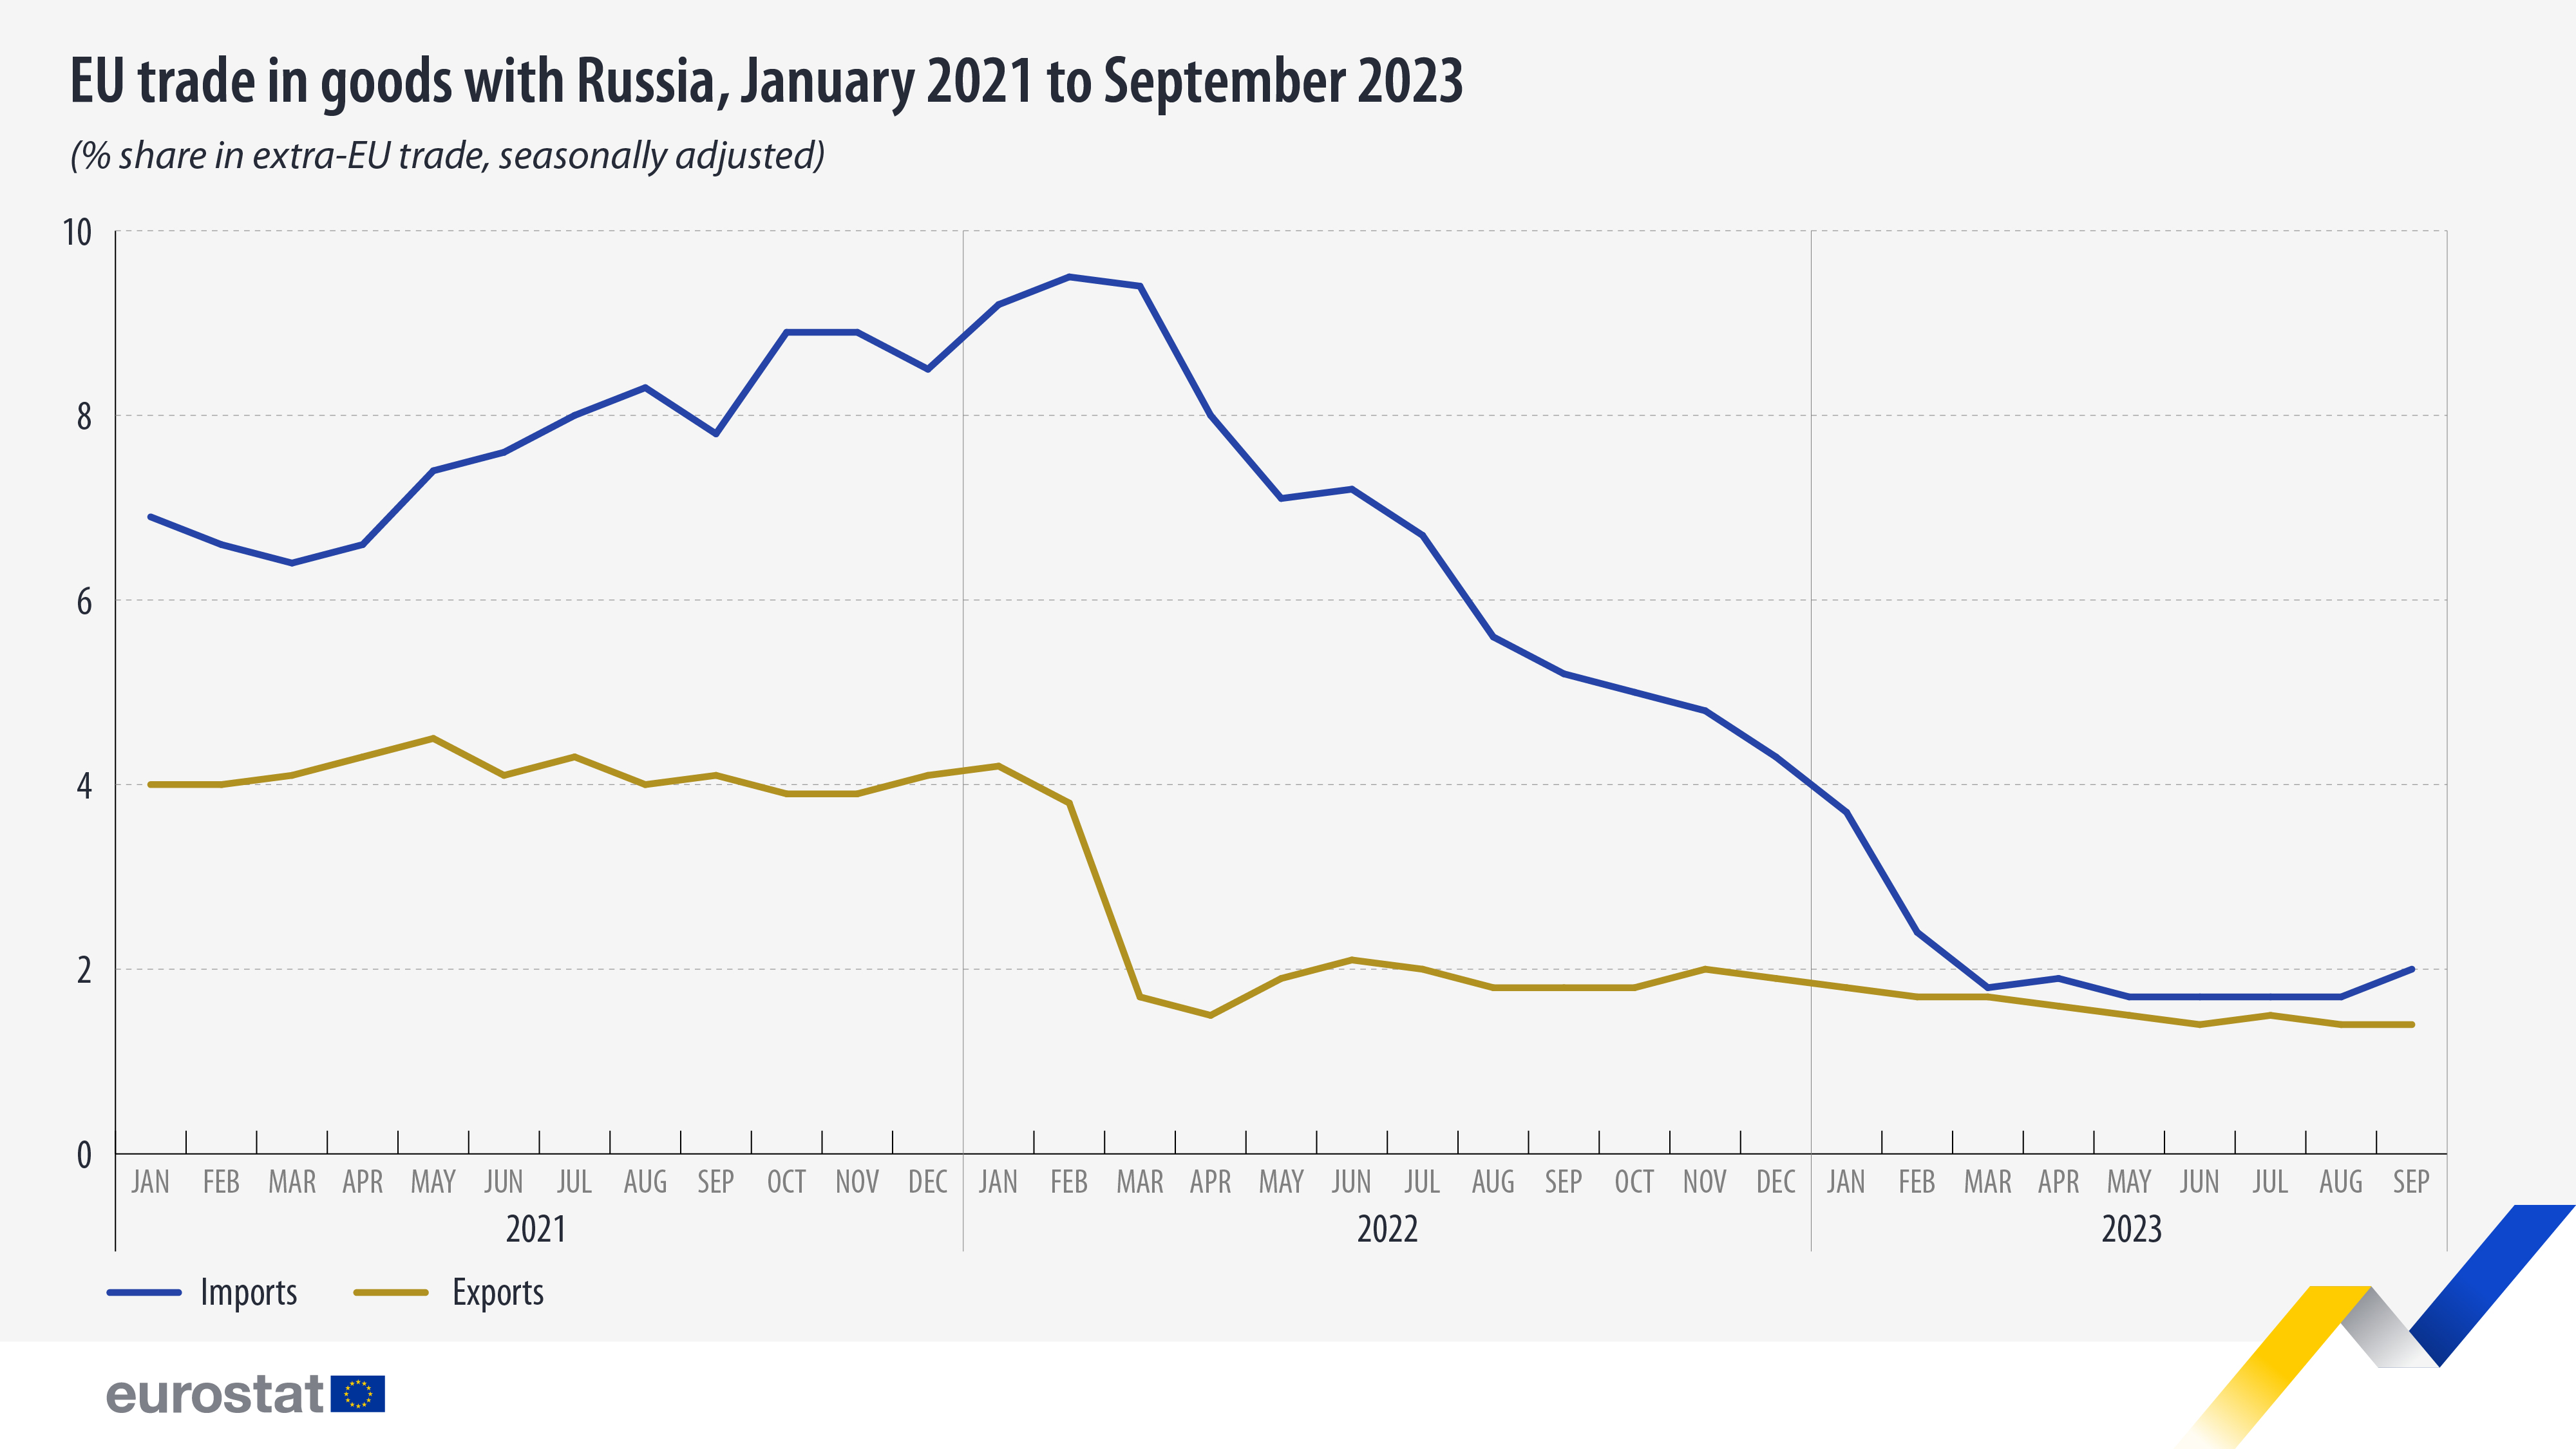
Both exports and imports have dropped considerably below the level prior to the invasion. Seasonally adjusted values show that Russia’s share in extra-EU imports fell from 9.5% in February 2022 to 2.0% in September 2023, while the share of extra-EU exports fell from 3.8 % to 1.4% in the same period.
Source dataset: ext_st_eu27_2020sitc
In March 2022, a peak trade deficit with Russia amounted to €18.6 billion due to high prices of energy products. This deficit was brought down to €0.1 billion in March 2023 and did not change much until September 2023 when it amounted to €1 billion. This change was heavily influenced by the drop in the monthly value of imports from Russia.
Russia’s share in extra-EU imports has decreased for the majority of key products
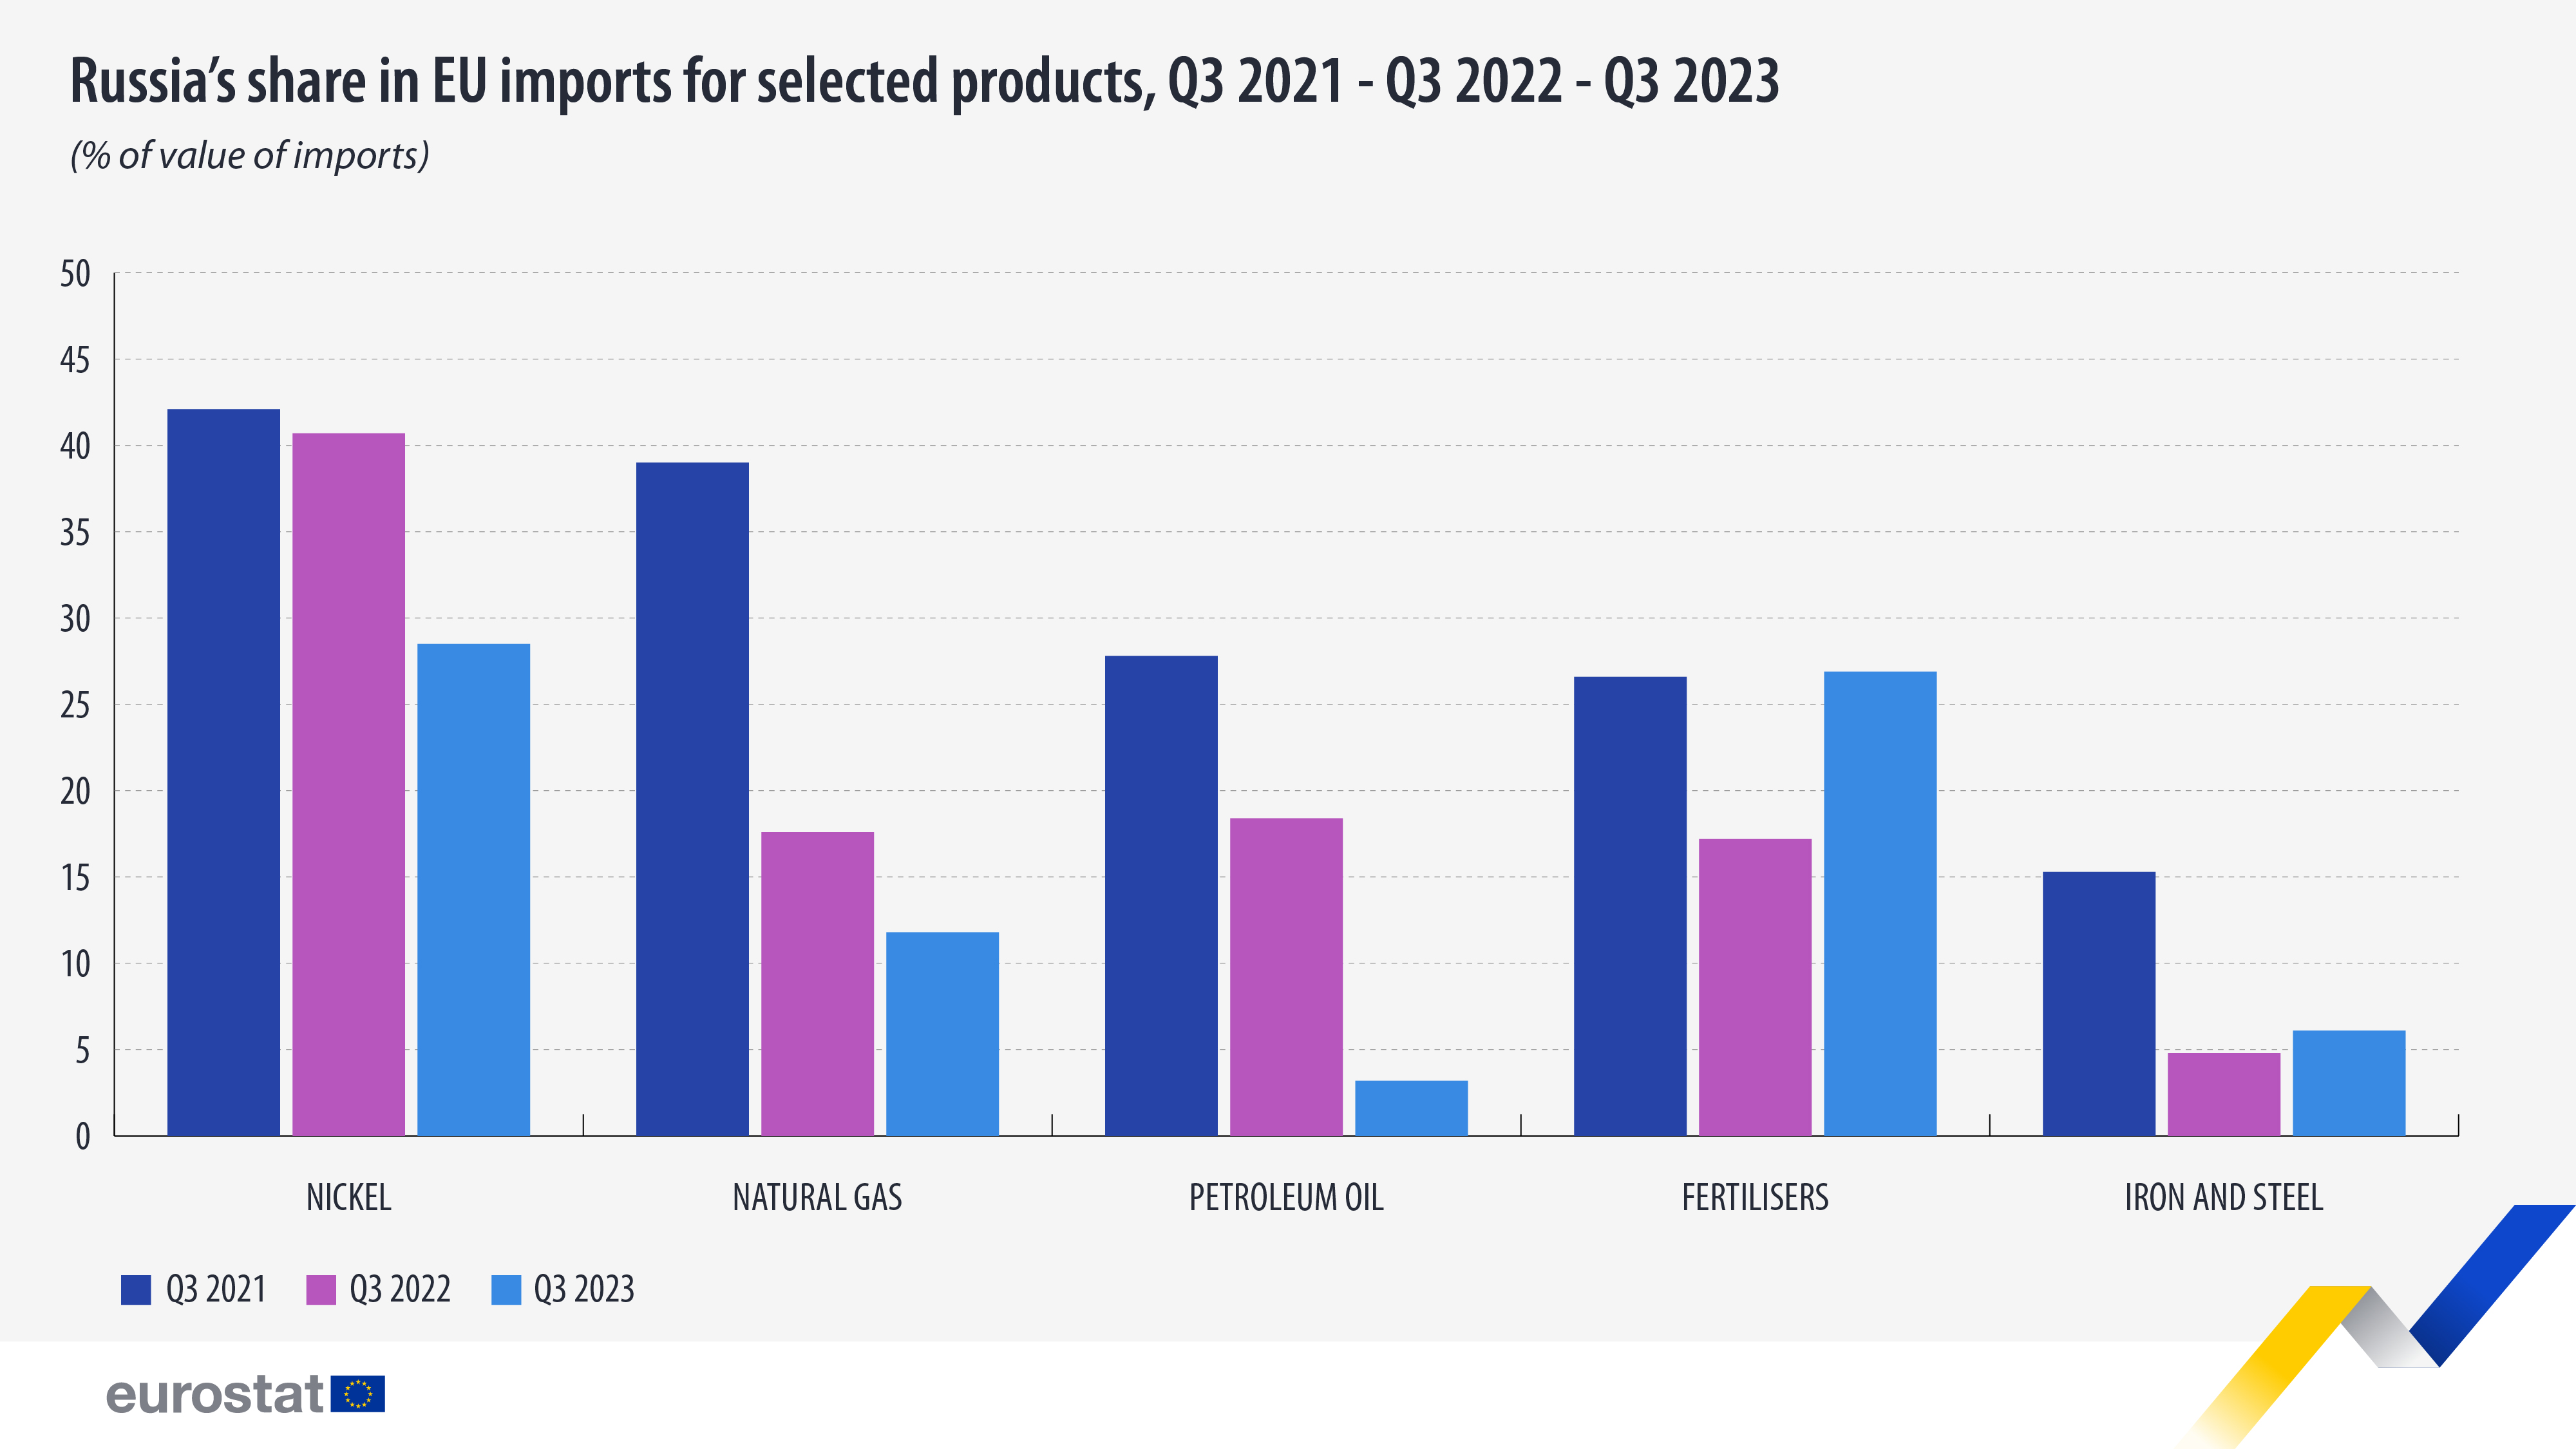
Altogether, natural gas, petroleum oils, nickel, iron and steel and fertilisers account for around two-thirds of total extra-EU imports from Russia.
Between the third quarter of 2021 and the third quarter of 2023, Russia’s share in extra-EU imports of natural gas decreased significantly (-27 percentage points, pp) while the opposite was observed for imports from the United States (+14 pp), Norway (+7.6 pp) and Algeria (+5.5 pp).
A similar phenomenon was observed for extra-EU imports of petroleum oils, with a decrease of Russia's share (-25 pp), while the respective shares of the United States (+7 pp), Norway (+4 pp), and Saudi Arabia (+2 pp) increased.
In the case of nickel imports, the United States expanded their share (+5 pp) while Russia's share declined (-14 pp).
China emerged as the primary supplier for iron and steel (share increasing by 5 pp) following a drop in imports from Russia (share decreasing by 9 pp).
However, trade in fertilisers shows a different pattern. Russia's share in extra-EU imports decreased from 27% in the third quarter of 2021 to 17% in the third quarter of 2022, but bounced back to 27% in the third quarter of 2023.
Source dataset: ds-059322
For more information
- Statistics Explained article on EU trade with Russia - latest developments
- Thematic section on international trade in goods
- Database on international trade in goods
Methodological notes
The following Harmonised System (HS) codes were used for selected products:
- HS 75: nickel and articles thereof.
- HS 271111 + 271121: petroleum gases and other gaseous hydrocarbons; liquefied, natural gas and petroleum gases and other gaseous hydrocarbons; in gaseous state, natural gas.
- HS 2709 + 2710: petroleum oils and oils obtained from bituminous minerals; crude and petroleum oils and oils from bituminous minerals, not crude; preparations n.e.c, containing by weight 70% or more of petroleum oils or oils from bituminous minerals; these being the basic constituents of the preparations; waste oils.
- HS 31: fertilizers.
If you have any queries, please visit our contact us page.


