Natural gas demand down 13% in 2022 in cutback efforts

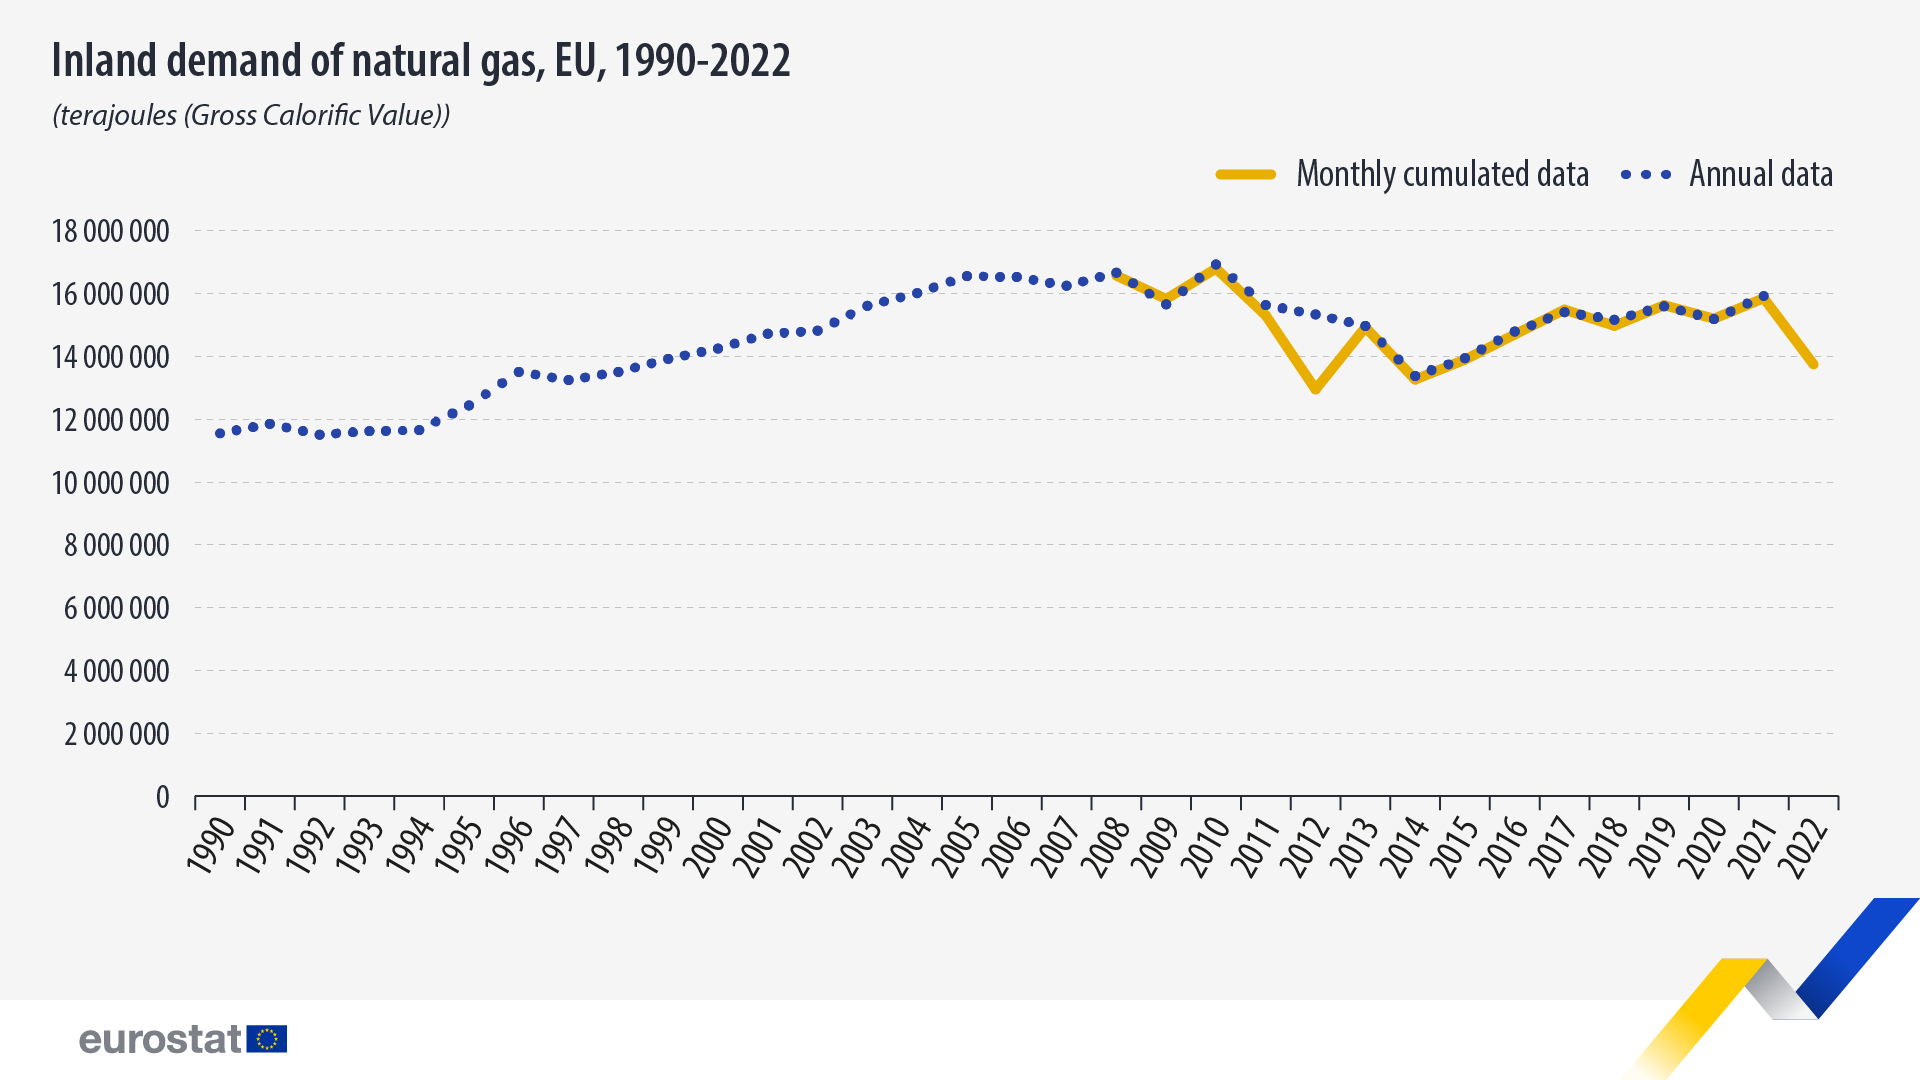
Following a 4.3% increase in 2021, inland demand for natural gas in the EU decreased by 13.2% in 2022 to 13.72 million terajoules. This is the third lowest total registered since 2008, when monthly cumulated data started being collected, after 2012 (12.93 million terajoules) and 2014 (13.2 million terajoules). It’s important to note that the Council Regulation (EU) 2022/1369 on coordinated demand-reduction measures for gas, part of the REPowerEU plan to end EU dependence on Russian fossil fuels, set a reduction target of 15% for the period August 2022-March 2023 as compared to the average of the same period of the five previous consecutive years, and this has triggered the reduction in demand that is visible in the present data. Between August 2022 and March 2023, EU consumption of natural gas dropped by 17.7%, compared with the average gas consumption for the same months (August-March) between 2017 and 2022.
In 2022, the largest natural gas consumers all reduced their demand substantially: Germany, Italy and France had the highest inland demand with 3.07 million terajoules (-15.4% vs. 2021), 2.61 million terajoules (-9.9%) and 1.54 million terajoules (-9.6%), respectively. Looking at all EU countries, demand decreased in most of them, except for Ireland and Malta where it was up slightly by 2.1% and 1.4%, respectively.
Source datasets: nrg_cb_gasm and nrg_cb_gas
In terms of supply, total EU imports of natural gas also decreased by 6.6% from 24.67 million terajoules in 2021 to 23.05 million terajoules in 2022.
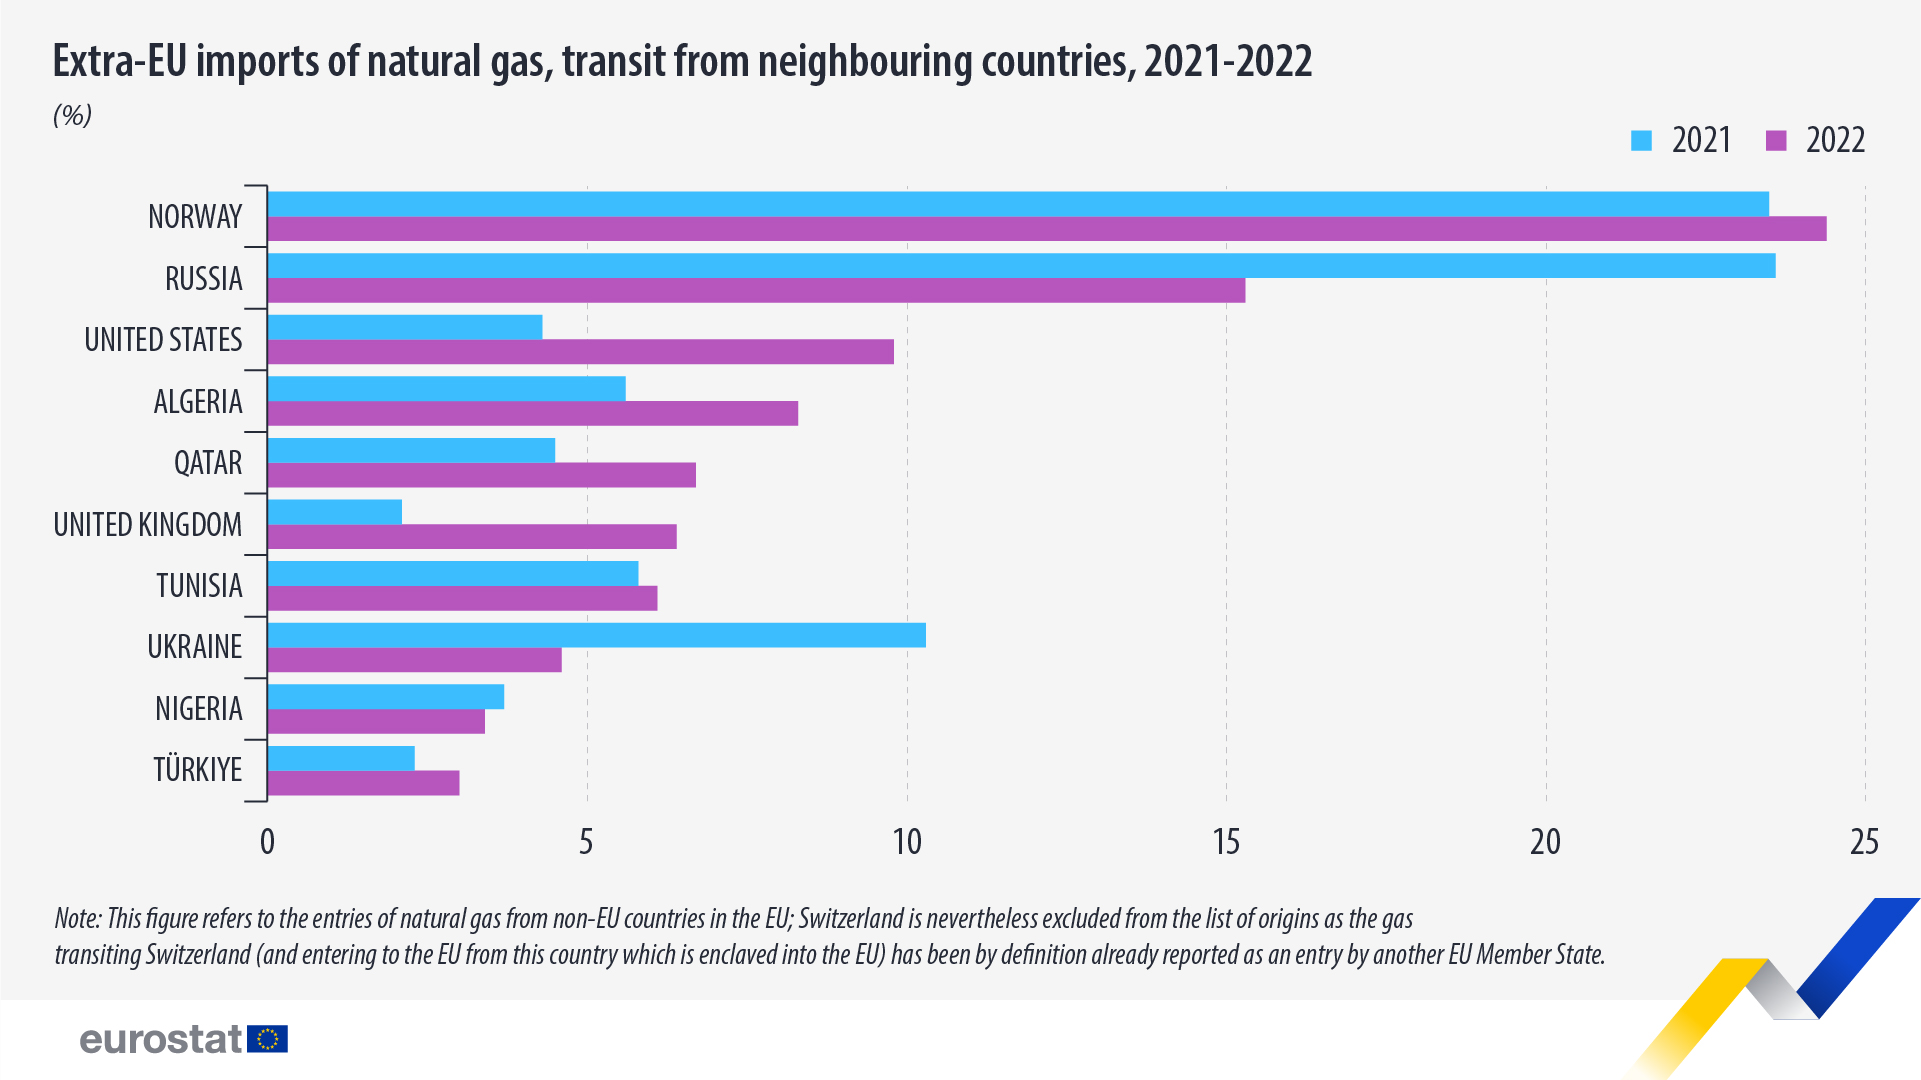
If in 2021, Norway and Russia were the main sources of natural gas entering the EU (intra-EU trade and entries from Switzerland both excluded) with similar percentages close to 24%, in 2022 the situation was quite different. Norway was the source of 24.4% of the natural gas entering the EU, with Russia coming second with 15.3% (-8.3 percentage points (pp) than in 2021), followed by the United States (9.8%, +5.5pp), Algeria (8.3%, +2.7 pp) and Qatar (6.7%, +2.2 pp).
Compared with 2021, imports from Ukraine (-5.7 pp) and Nigeria (-0.3 pp) also declined, while imports from the rest of the top 10 partners increased.
Source dataset: nrg_ti_gasm
For more information
- Statistics Explained article on natural gas supply statistics
- Database on energy
- Thematic section on energy
If you have any queries, please visit our contact us page.


