Milk production growth comes to a standstill in 2022

EU farms produced an estimated 160.0 million tonnes of raw milk in 2022, indicating a year-on-year decrease of 0.3 million tonnes. This relative stability contrasted with the steady growth in production since 2010.
The vast majority of raw milk (149.9 million tonnes) was delivered to dairies, the rest being used directly on farms. It was used to produce a range of fresh and manufactured dairy products.
This information comes from data on milk and milk products just published by Eurostat. The article presents a handful of findings from the more detailed Statistics Explained article on milk and milk products.
Among other products, dairies produced 22.5 million tonnes of drinking milk in 2022; 7.7 million tonnes of acidified milk products from 6.0 million tonnes of whole milk and 1.7 million tonnes of skimmed milk; 2.3 million tonnes of butter from 46.4 million tonnes of whole milk: and 10.4 million tonnes of cheese from 59.2 million tonnes of whole milk and 16.9 million tonnes of skimmed milk. Together, the production of cheese and butter used 70% of all the whole milk available to dairies in the EU.
Source dataset: apro_mk_pobta (EU aggregates estimated for this release)
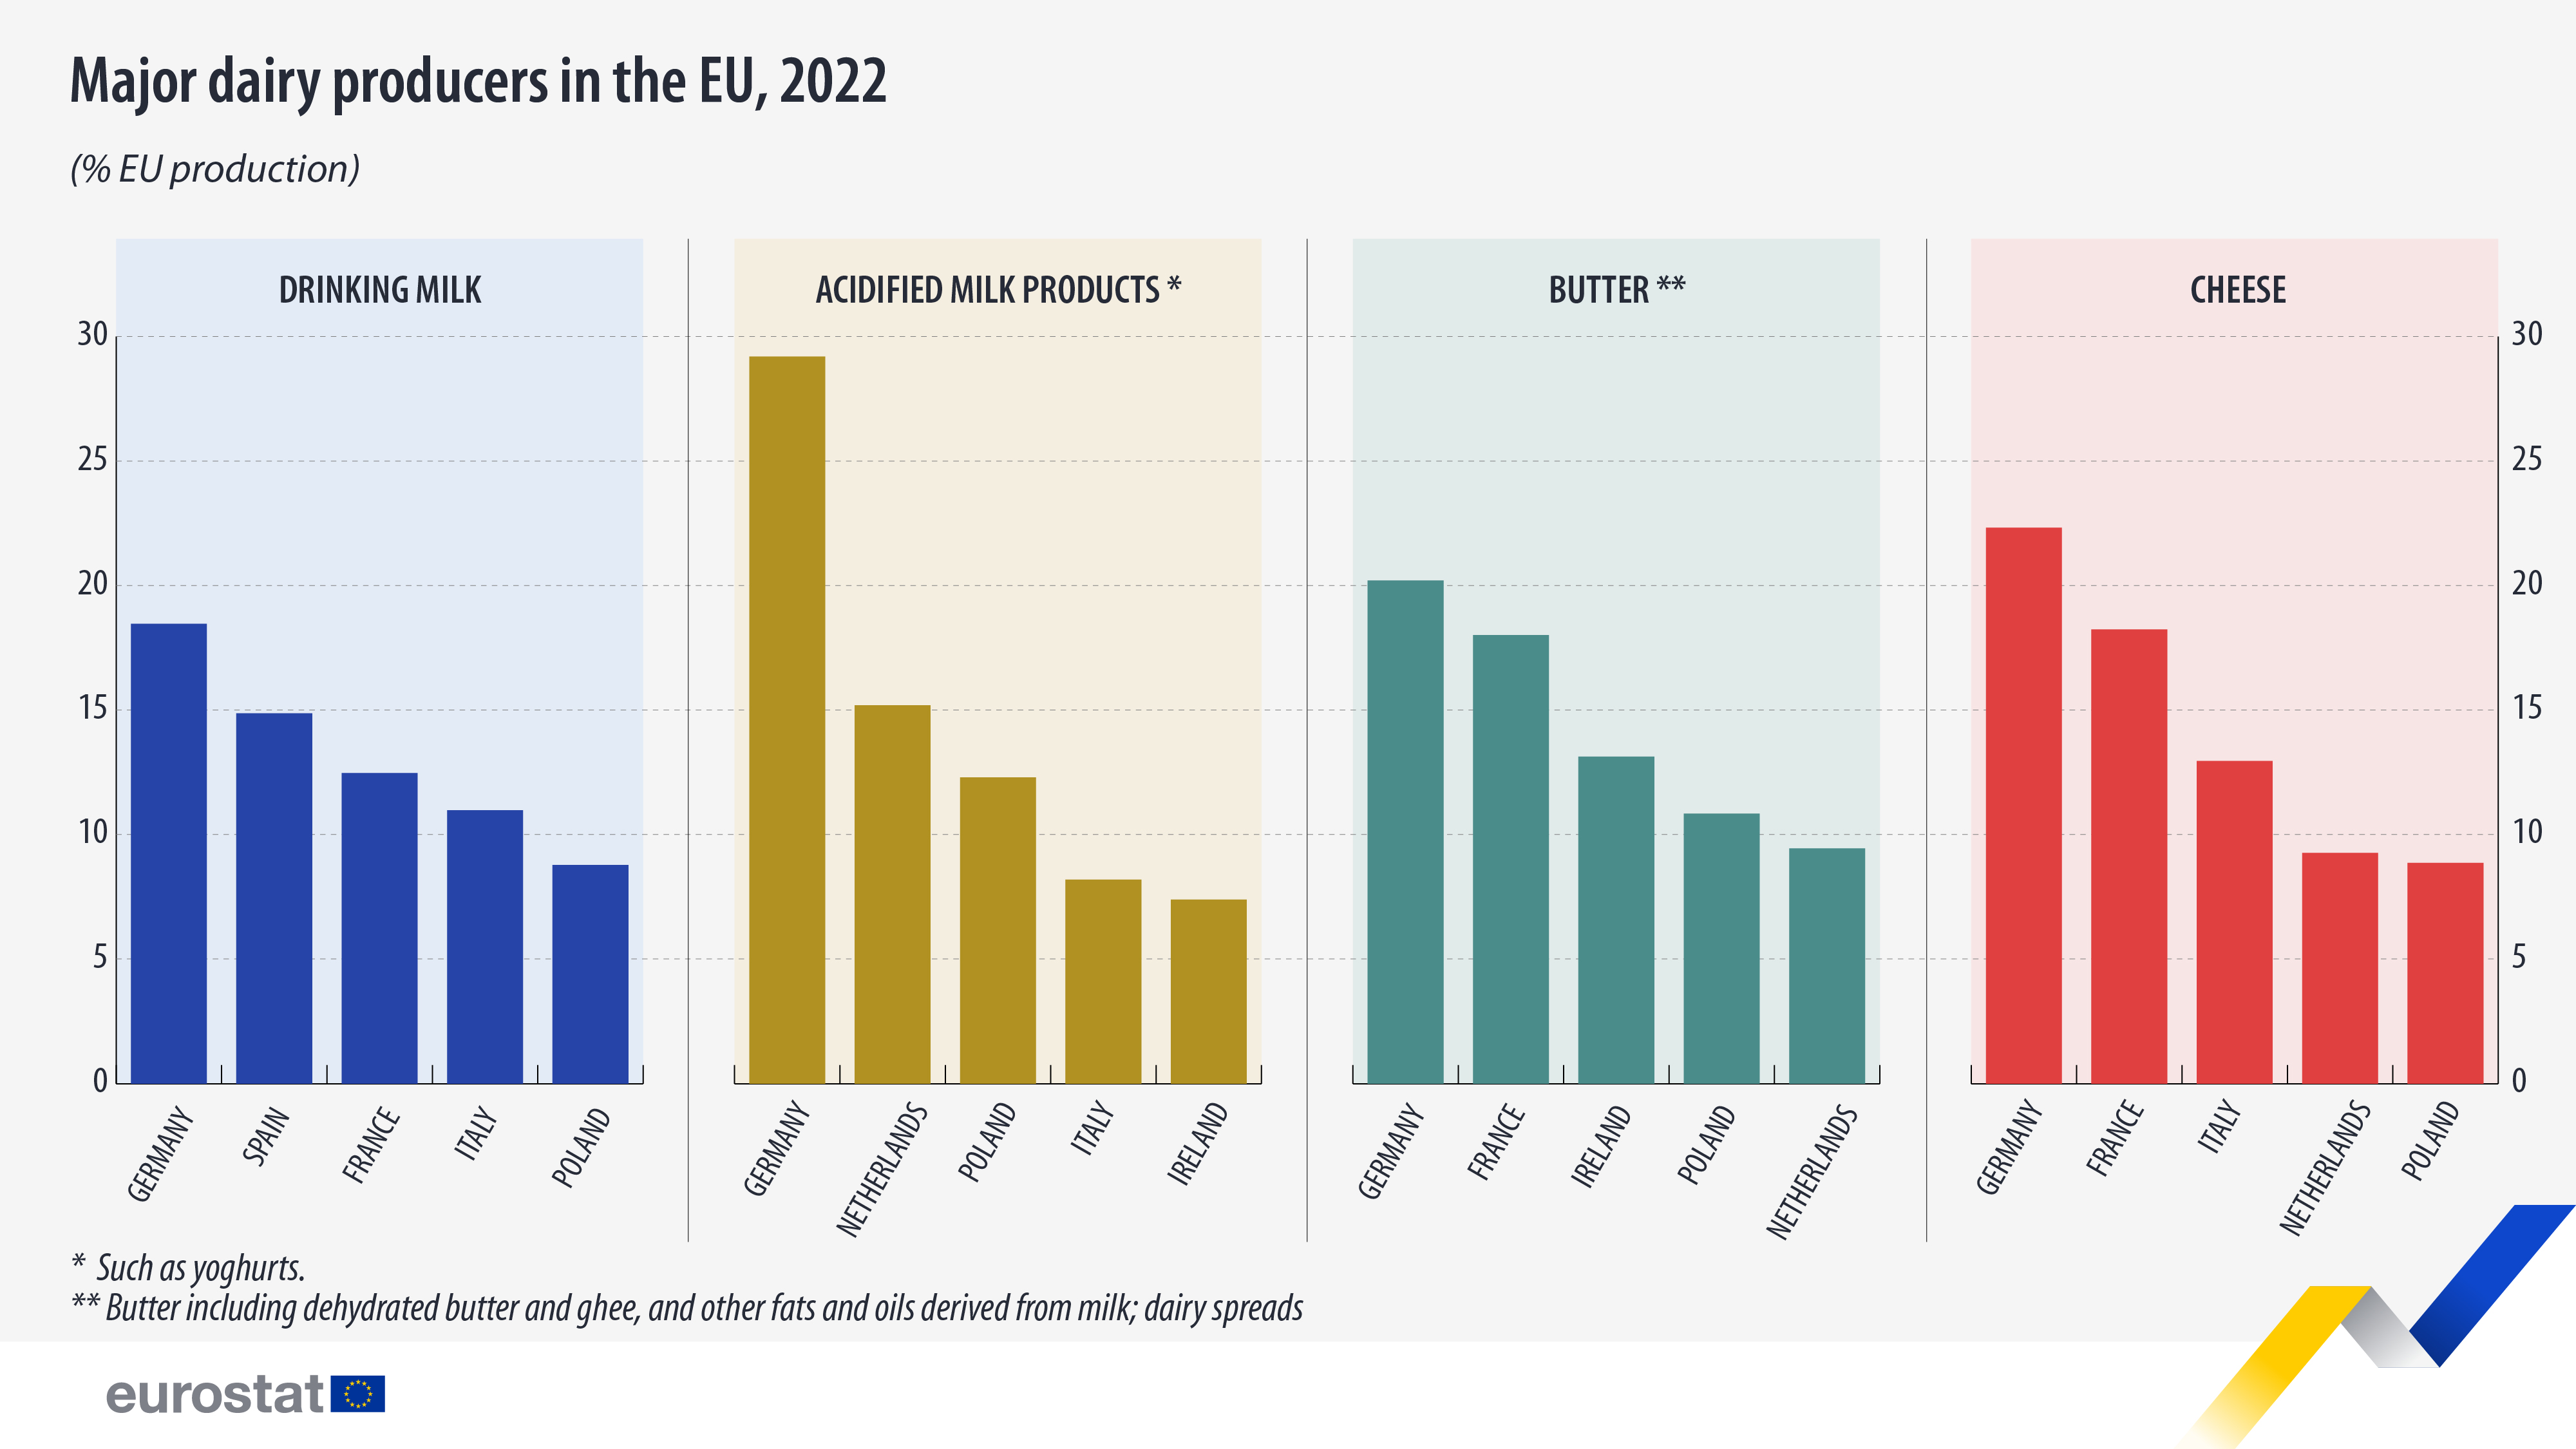
Among EU countries, Germany was the biggest producer of drinking milk (19% of the EU total), butter (20%), acidified milk products like yoghurts (29%) and cheese (22%). France was the second largest producer of both butter and cheese (18% of the total in each product).
Germany, together with Spain (15% of the EU total), France (13%), Italy (11%) and Poland (9%) accounted for two thirds of the drinking milk produced in the EU in 2022.
Other EU countries were key producers of other fresh and manufactured dairy products: the Netherlands was the second largest producer of acidified milk products in the EU (15% of the total), the fourth largest of cheese (9%), and the fifth of butter (10%), while Ireland was the third largest producer of butter (13% of the EU total) and fifth largest of acidified milk products (7%).
For more information
- Statistics Explained article on milk and milk products
- Thematic section on agriculture statistics
- Database on agriculture statistics
Methodological notes:
Dairy products are recorded in terms of their weight. It is thus difficult to compare the quantities of various products (for example, tonnes of fresh milk and of milk powder). The volume of whole or skimmed milk used in dairy processes provides more comparable figures. Two dimensions (quantities of whole and skimmed milk used) reflect the material balance of the valuable milk components, especially fat (in whole milk only) and protein (in total milk used).
If you have any queries, please visit our contact us page.

