
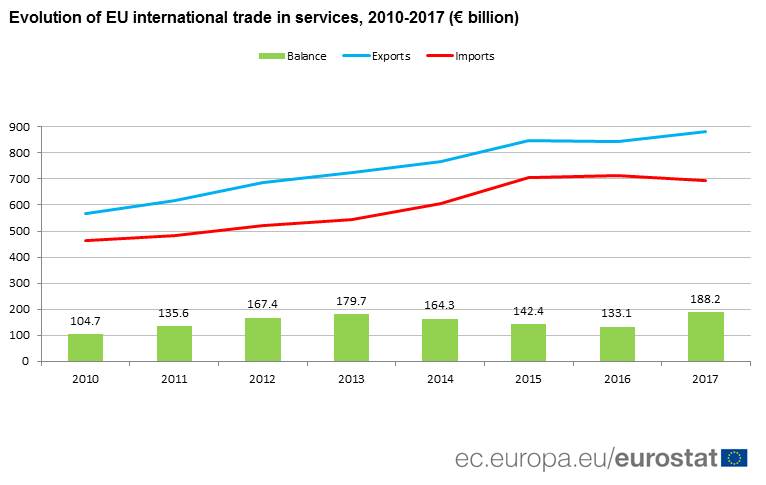
According to preliminary data for 2017, the EU’s exports of services to the rest of the world increased by 4.6% between 2016 and 2017, from €844.9 billion to €883.6 bn, while imports decreased by 2.3%, from €711.8 bn to €695.5 bn. As a consequence, the EU trade surplus in services, which had steadily decreased since 2013, increased to €188.2 bn in 2017 reaching its highest value since 2010.
The source dataset can be found here.
ICT boosts EU surplus in trade in services
EU exports were dominated by "other business services" (R&D, business, professional and technical services), which accounted for over a quarter of total extra-EU exports (26%), followed by transport (18%) and travel services (15%). “Other business services” were also the largest category of services imported by the EU (30% of EU imports), ahead of transport services (17%) and charges for the use of intellectual property (16%).
The EU surplus in 2017 was mainly due to surpluses in telecommunications, computer and information services (+€73.0 bn), transport and travel (+€33.9 bn and +€32.5 bn respectively) and financial services (+€38.5 bn). A deficit was recorded in charges for the use of intellectual property (-€39.8 bn).
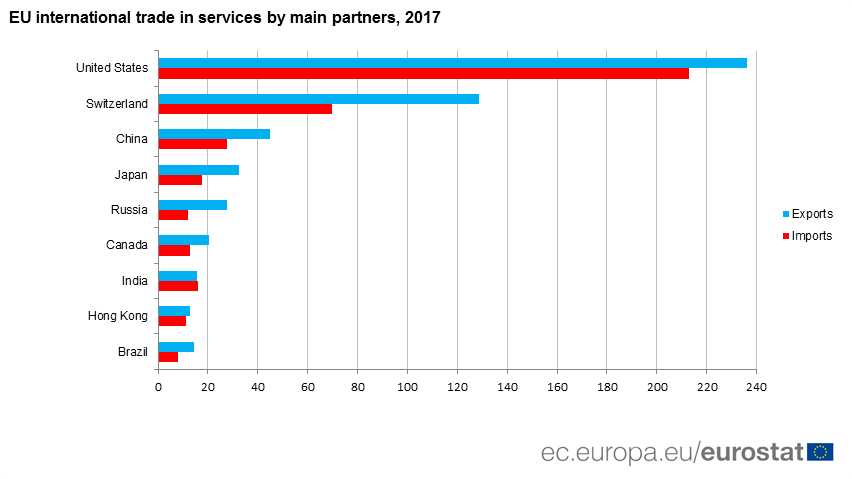
The United States, top partner for both exports and imports
In 2017, the main partners for EU exports of services remained the United States (€236.0 billion, or 27% of extra-EU exports) and Switzerland (€128.5 bn, 15%), well ahead of China (€44.7 bn, 5%), Japan (€32.3 bn, 4%) and Russia (€27.6 bn, 3%). The main partner for EU imports of services also continued to be the United States (€212.9 bn, 31% of extra-EU imports), followed by Switzerland (€69.7 bn, 10%), China (€27.8 bn, 4%) and Japan (€17.6 bn, 3%).
In 2017, the EU recorded surpluses for trade in services with all its main partners, except India (-€0.4 bn). By far the largest surplus was observed with Switzerland (+€58.8 billion), ahead of the United States (€23.1 bn), China (€16.9 bn), Russia (€15.7 bn) and Japan (€14.8 bn).
The source dataset can be found here.
For more information please contact us: estat-user-support@ec.europa.eu.