
Between 2010 and 2020, transport activity on the EU’s inland waterways was volatile. After a series of declines and rebounds, the sector registered a substantial decrease of almost 6% (8 billion tonne-kilometres) between 2019 and 2020. A similar trend can be observed for the same period in terms of tonnes with a drop of slightly more than 3% (17 million tonnes).
This information comes from data on inland waterway freight transport published by Eurostat. The article presents a handful of findings from the more detailed Statistics Explained article.
Germany and the Netherlands were the main contributors to the EU inland waterway transport, accounting for 70% of the total in 2020. Data show that, in absolute values, Germany registered the highest decrease in 2020 compared with 2019 (-4.6 billion tonne-kilometres).
The largest percentage decline was observed in Lithuania (-98%), but it reflects a low initial value, with absolute values decreasing from 448 thousand tonne-kilometres to 8.5 thousand. Czechia (-44%), France (-13%) and Poland (-12%) also registered significant decreases in 2020, while Sweden (+59%), Croatia (+8%), Bulgaria (+7%) and Finland (+4%) were the only countries that recorded a rise in the volume of transport (in tonne-kilometres).
The Netherlands led on two fronts. The country recorded the highest volume of freight transported per inhabitant with 20 tonnes and almost half (49%) of the registered freight transport vessels on EU inland waterways.
In terms of volume of freight transported per inhabitant, the Netherlands was followed by Belgium (13.5 tonnes per inhabitant) and Luxembourg (9.1 tonnes per inhabitant). In six EU countries, less than 100 kilograms per inhabitant were transported. At EU level, 1.1 tonnes of freight per inhabitant were transported on inland waterways in 2020.
As for registered freight transport vessels, Germany (16%) and Belgium (9%) had the next highest shares after the Netherlands when it came to the nationality of the vessels.
Source dataset: iww_go_atygo
Top goods transported
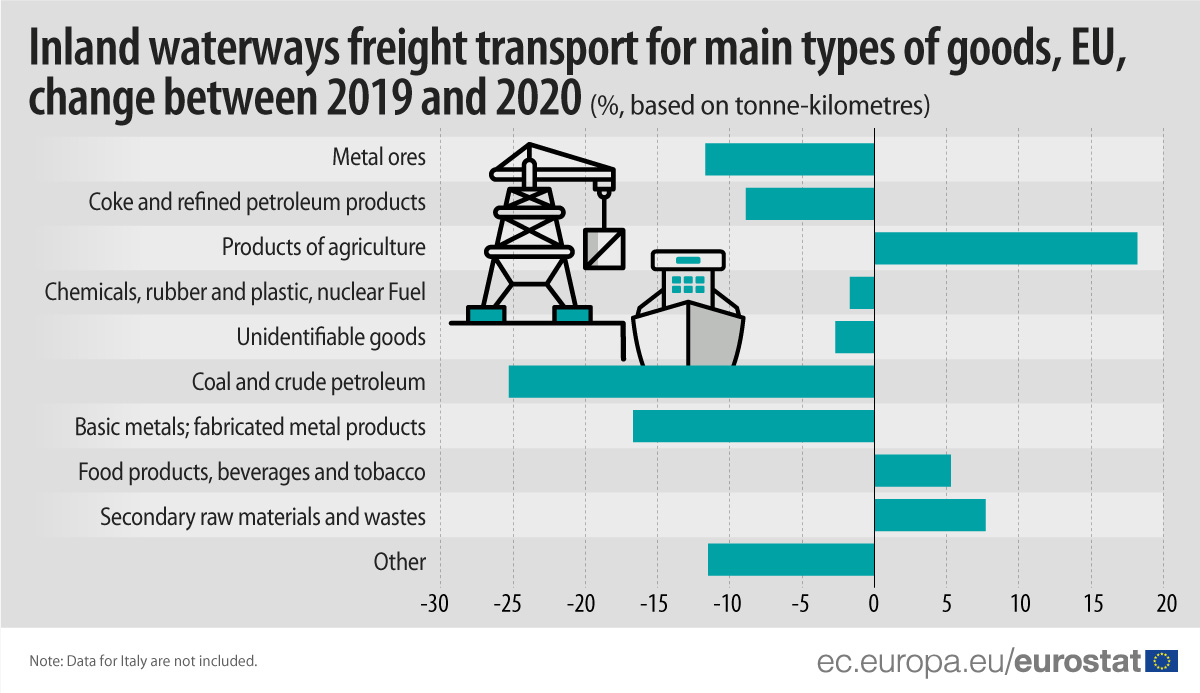
At EU level, ‘metal ores’, ‘coke and refined petroleum products’ and ‘products of agriculture’ were the main types of goods transported in 2020, accounting for more than half of all goods transport on EU inland waterways.
Among all goods, the largest growth from 2019 to 2020 was observed for ‘products of agriculture’ (+18%), followed by ‘secondary raw materials and wastes’ (+8%) and ‘food products, beverages and tobacco’ (+5%).
In contrast, the largest decrease was observed for ’coal and crude petroleum’ (-25%), followed by ’basic metals; fabricated metal products, except machinery and equipment’ (-17%), ’metal ores’ (-12%) and ’coke and refined petroleum products’ (-9%).
For more information:
• Eurostat Statistics Explained article on Inland waterways freight transport - quarterly and annual data
• Eurostat database section dedicated to transport including inland waterway transport
• Eurostat website section dedicated to transport
To contact us, please visit our User Support page.
For press queries, please contact our Media Support.