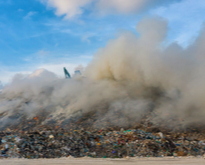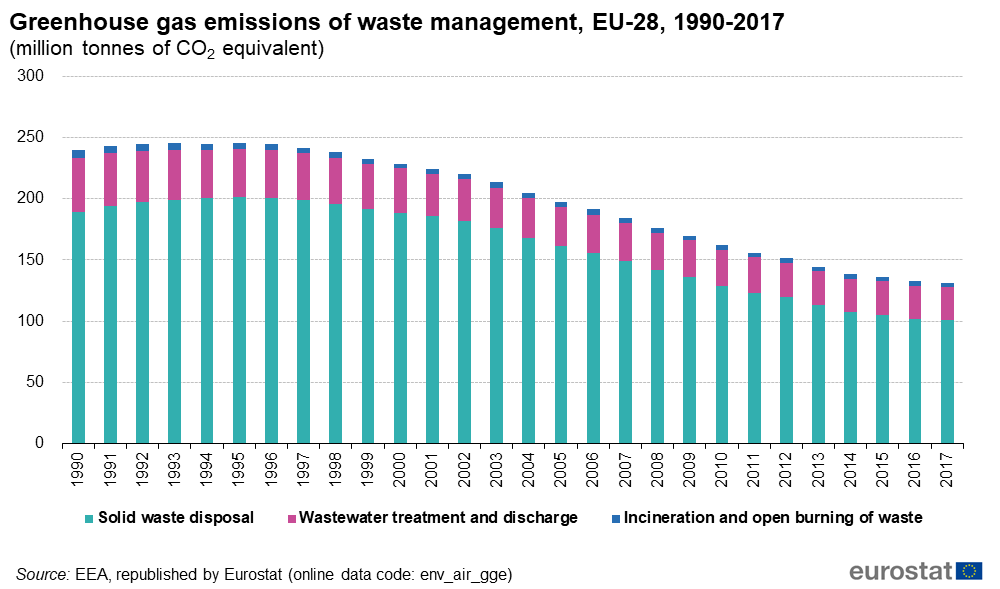
Between 1995 and 2017, greenhouse gas emissions from waste in the EU have fallen by 42%, according to estimates by the European Environmental Agency. The amount of emissions from waste depends on how the waste is treated. For example, when waste is landfilled, the organic material in the waste decomposes and produces gas.
The reduction in emissions from solid waste disposal follows from an increase in the recovery of landfill gas and a reduction in the amount of landfilling. With more waste being recycled, less of it needs to be landfilled or incinerated, which contributes to protecting the climate.
The source dataset can be found here.
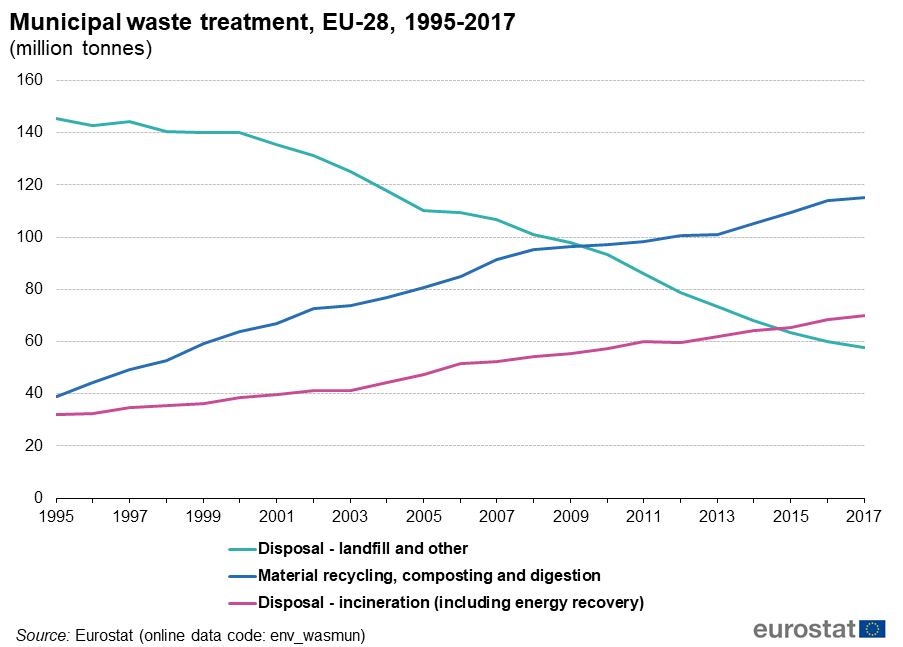
Eurostat statistics on how municipal waste was treated, and how that changed, help us to understand why these emissions fell. Municipal waste is a small share of total waste, but the statistics still give a good picture of the overall trend of waste treatment relevant for emissions reporting in the European Union, because industrial waste contains relatively little organic and fossil carbon material.
While the total amount of municipal waste treated increased by 13% between 1995 and 2017, the amount of waste that was landfilled fell by 60% over the same period. The reduction in landfill was possible, because the amount of waste that is recycled or composted has tripled and the amount of waste that is burned has doubled.
EU legislation has brought about the change in the waste treatment we see in waste statistics, by focusing on recycling and reducing the disposal of waste as landfill. The emissions from solid waste disposal are reduced further by the mandatory installation of landfill gas recovery at new sites. Changing the treatment of waste is just one example of how creating a more circular economy helps to reduce emissions and fight climate change.
The source dataset can be found here.
Waste is the fourth largest source sector of emissions, accounting for 3% of total greenhouse gas emissions in 2017. Most emissions come from combusting fuels (77%), followed by agriculture (10%) and industrial processes (8%).
More on the drivers behind emissions from these other sources can be found in the Statistics Explained article Climate change – driving forces.
To contact us, please visit our User Support page.
For press queries, please contact our Media Support.


