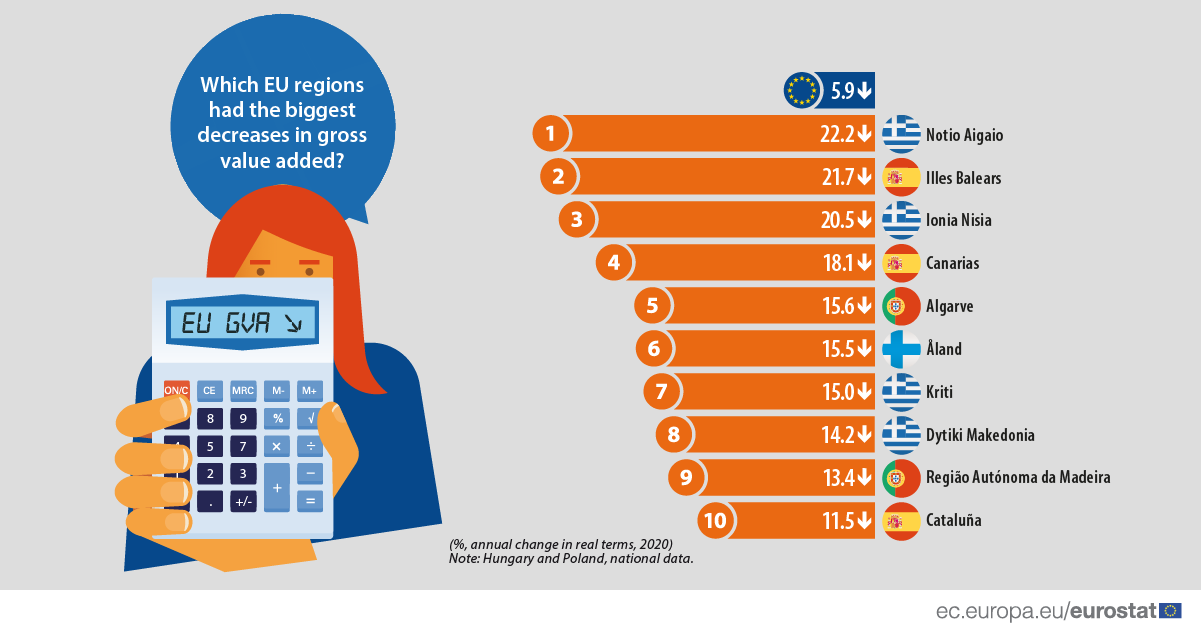
In 2020, the COVID-19 crisis was felt across the EU. In terms of economic impact, the annual real rate of change in gross value added (GVA) was negative in 215 out of 219 regions for which data are available.
After growth rates of more than 2.0% in 2017 and 2018, the EU’s annual rate of change of gross value added slowed down to 1.8% in 2019. The direct and indirect effects of the COVID-19 crisis resulted in a 5.9% contraction in 2020 in the EU. It was the first time that gross value added had fallen (in real terms) since a modest decline of 0.6% in 2012, and the economic downturn, as a result of the COVID-19 crisis, was greater than the losses (-4.3%) experienced at the height of the global financial and economic crisis in 2009.
Source dataset: nama_10r_2gvagr and nama_10_gdp
17 regions recorded a decrease of more than 10%
There were 17 NUTS level 2 regions where gross value added fell by more than 10.0% in 2020: they included many of the EU’s most popular tourist destinations, for example: Notio Aigaio and Ionia Nisia in Greece; Illes Balears and Canarias in Spain; Jadranska Hrvatska in Croatia; Tirol in Austria; Algarve and Região Autónoma da Madeira in Portugal. At the onset of the pandemic, restrictions prevented most tourists from travelling and many hospitality businesses from opening.
The largest annual contractions in gross value added in 2020 were recorded in Notio Aigaio (-22.2%), Illes Balears (-21.7%) and Ionia Nisia (-20.5%); these were the only regions in the EU where value added fell by at least a fifth in 2020. Further high declines were recorded in Canarias (-18.1%), Algarve (-15.6%) and Åland in Finland (-15.5%).
Source dataset: nama_10r_2gvagr and nama_10_gdp
On the other hand, the economic impact of the COVID-19 crisis was relatively muted – with value added falling by no more than 4.0% in 2020 – in every region of Denmark, Lithuania, Romania, Slovenia and Finland (except for Åland); this pattern was also observed in Estonia, Latvia, Luxembourg and Poland, where only data for the total economy are available.
There were only four regions (out of 219) across the EU where gross value added increased in 2020. The highest annual growth rate (+10.7%) was recorded in the Irish Southern region (which was also the ‘richest’ region in the EU, as measured by GDP per inhabitant). Gross value added also increased in the two other Irish regions, up to 3.6% in Northern and Western and 1.8% in the capital region of Eastern and Midland. Mayotte in France was the only other region in the EU that recorded an increase in its gross value added in 2020 (+ 0.7%). Some of the rapid growth in Ireland during 2020 can be linked to a buoyant pharmaceutical sector (one of the few sectors in the EU economy that continued to grow during the COVID-19 crisis).
Would you like to know more about economy and finance statistics in the EU?
You can read more in the dedicated section of the Regions in Europe - 2022 interactive edition and in the Eurostat regional yearbook - 2022 edition, also available as a set of Statistics Explained articles. The corresponding maps in the Statistical Atlas provide a full-screen interactive map experience.
For more information:
- Dedicated section on regions and cities
- Database on regional data
- Statistics Explained article on GDP at regional level
- Dedicated section on national accounts
- Database on national accounts
Methodological notes:
- When calculated from the output side, the main component of GDP is “gross value added”. This is defined as output (at basic prices) minus intermediate consumption (at purchaser prices) and is the balancing item of the national accounts’ production account. Gross value added can be analysed according to activity (for example, manufacturing or transport services) and by institutional sector (for example, government, households, financial corporations and non-financial corporations). The difference between gross value added and GDP is taxes (mainly value added tax (VAT)) less subsidies on products.
- The information presented is a real rate of change, in other words the effects of inflation have been removed.
- Estonia, Latvia, Luxembourg, Hungary and Poland: data at total economy level.
To contact us, please visit our User Support page.
For press queries, please contact our Media Support.


