Tutorials
Log in
Statistics Explained
menu
search
search
Navigation
Main page
Statistical themes
Glossary
Categories
Statistics 4 beginners
Tutorials
Help
Eurostat home
Education corner
Online publications
Regional yearbook
Sustainable development
Full list
Tools
User contributions
Logs
View user groups
Special pages
search
Navigation
Main page
Statistical themes
Glossary
Categories
Statistics 4 beginners
Tutorials
Help
Eurostat home
Education corner
Online publications
Regional yearbook
Sustainable development
Full list
Tools
User contributions
Logs
View user groups
Special pages
Navigation
Main page
Statistical themes
Glossary
Categories
Statistics 4 beginners
Tutorials
Help
Eurostat home
Education corner
Online publications
Regional yearbook
Sustainable development
Full list
Tools
User contributions
Logs
View user groups
Special pages
Uploads by WikiSysop
This special page shows all uploaded files.
File list
Items per page:
20
50
100
250
500
Search for media name:
Username:
Include old versions of files
Go
First page
Previous page
Next page
Last page
Date
Name
Thumbnail
Size
Description
Versions
17:53, 21 January 2020
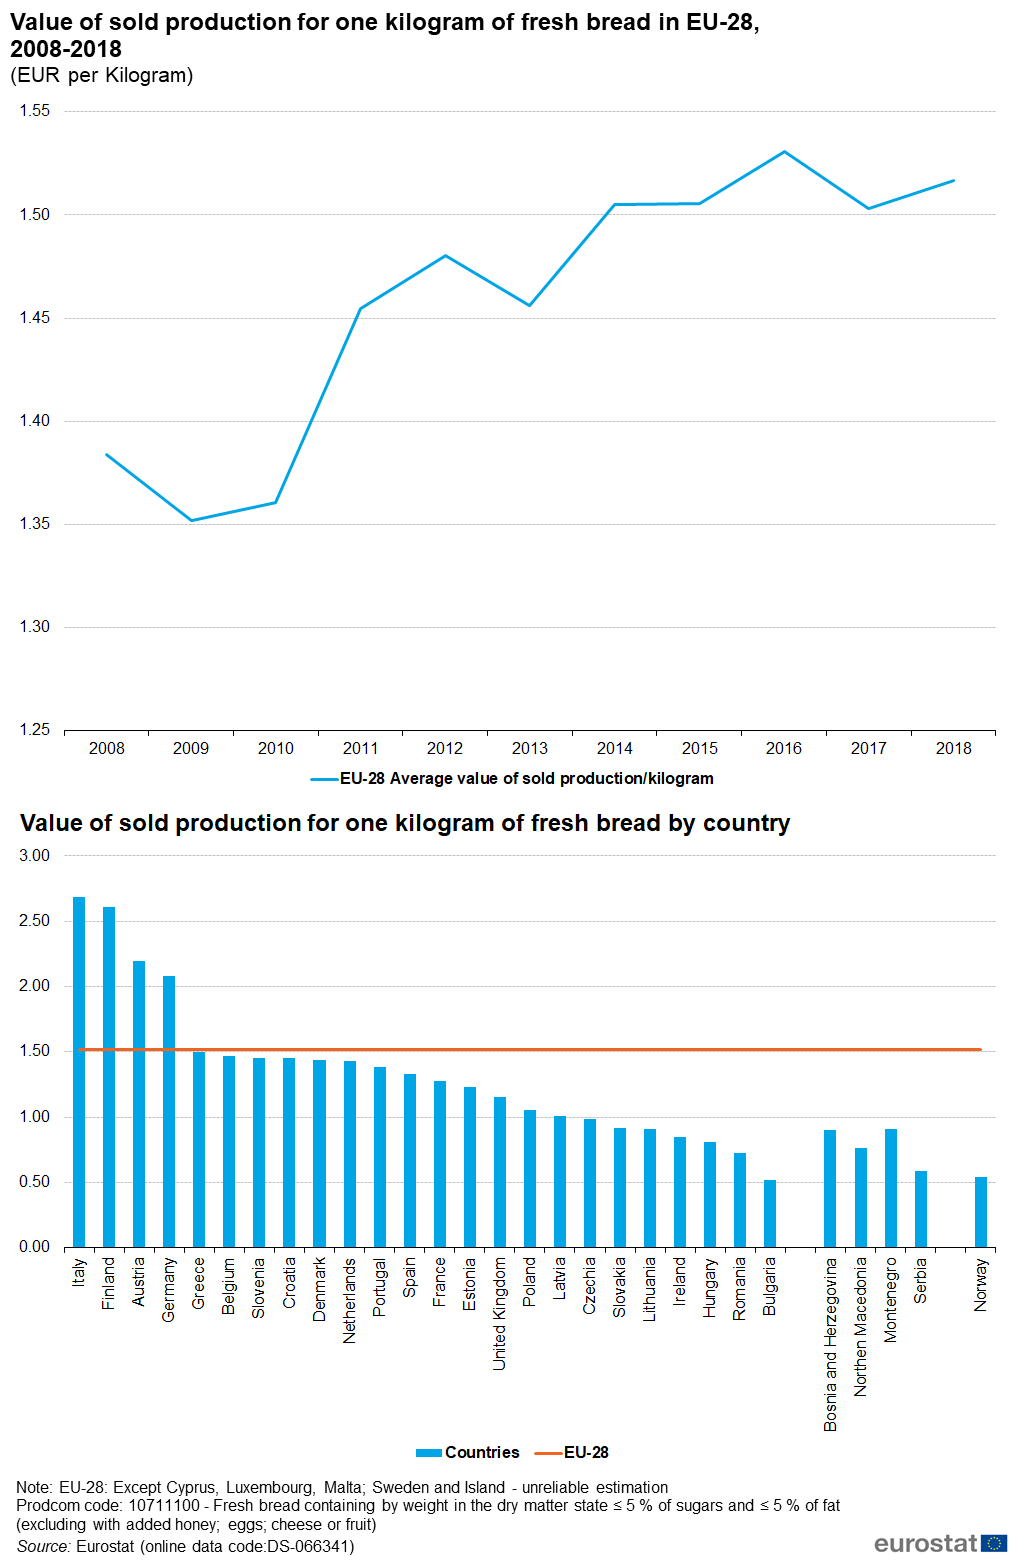
Figure 6 Value of sold production for one kilogram of fresh bread in EU-28 2008-2018.png
(
file
)
107 KB
1
17:45, 21 January 2020
Figure 6 Value of sold production for one kilogram of fresh bread in EU-28, 2008-2018.png
(
file
)
110 KB
12
17:11, 21 January 2020
Figure 6 Value of sold production for one kilogram of fresh bread in EU-28, 2008-201828.png
(
file
)
110 KB
1
14:51, 20 December 2019
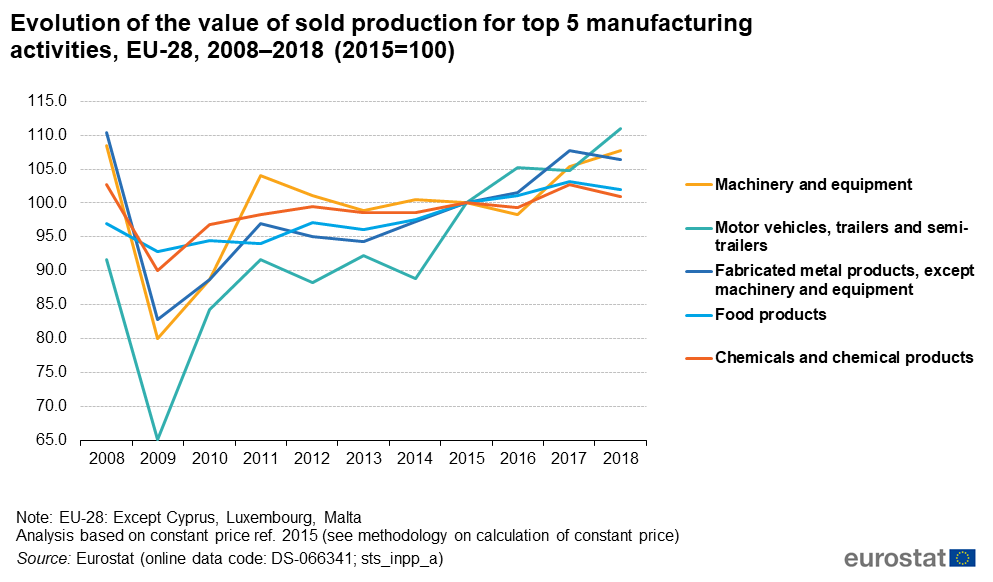
Figure 4 Evolution of the value of sold production for top 5 manufacturing activities, EU-28, 2008–2018 (2015=100).png
(
file
)
71 KB
8
17:24, 19 December 2019
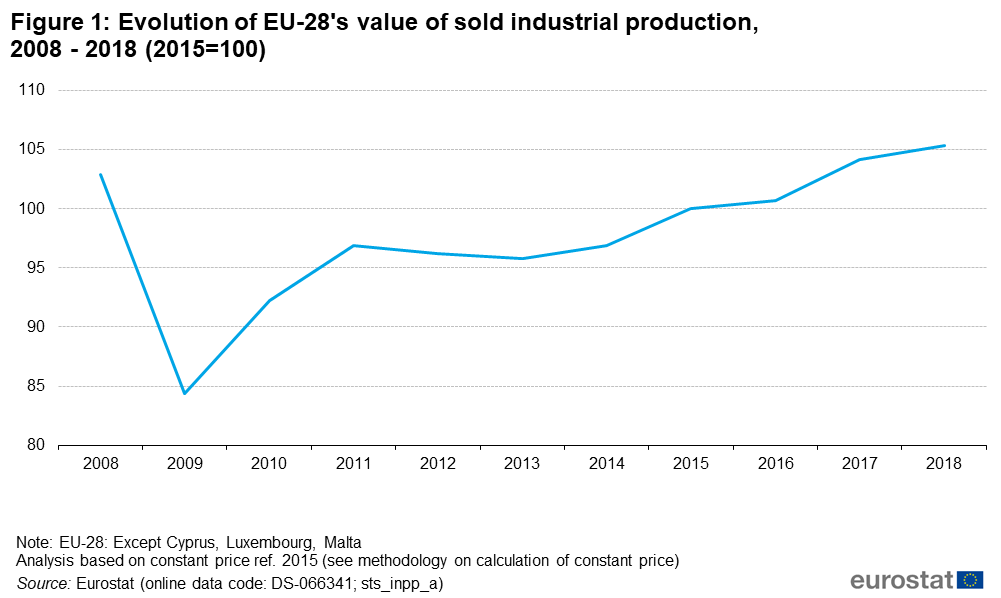
Figure 1 Evolution of EU-28's value of sold industrial production, 2008 - 2018 (2015=100) index (base=2015).png
(
file
)
41 KB
1
17:49, 12 December 2019
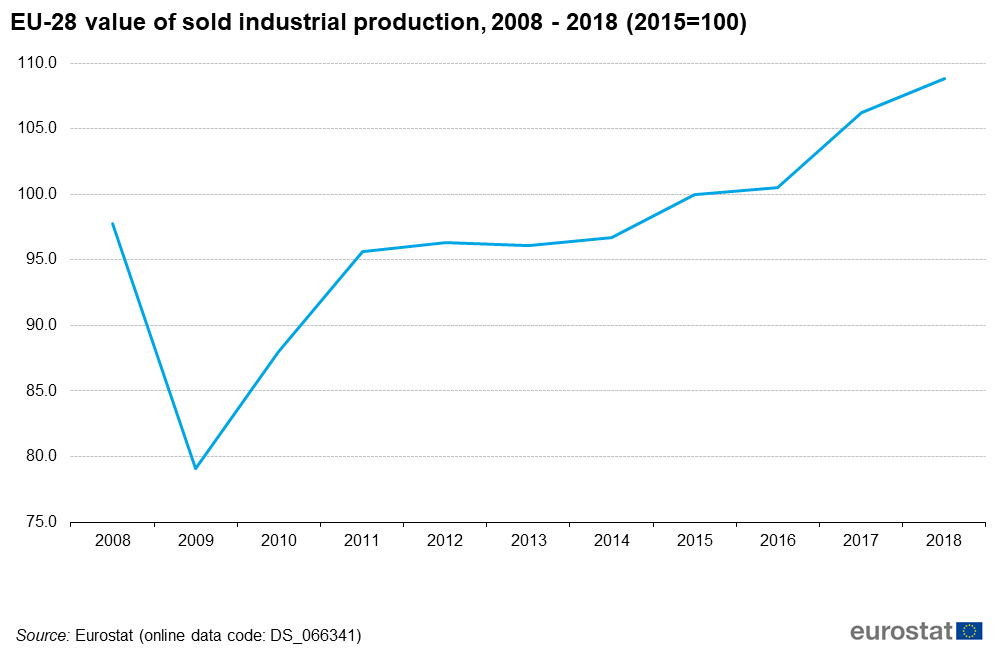
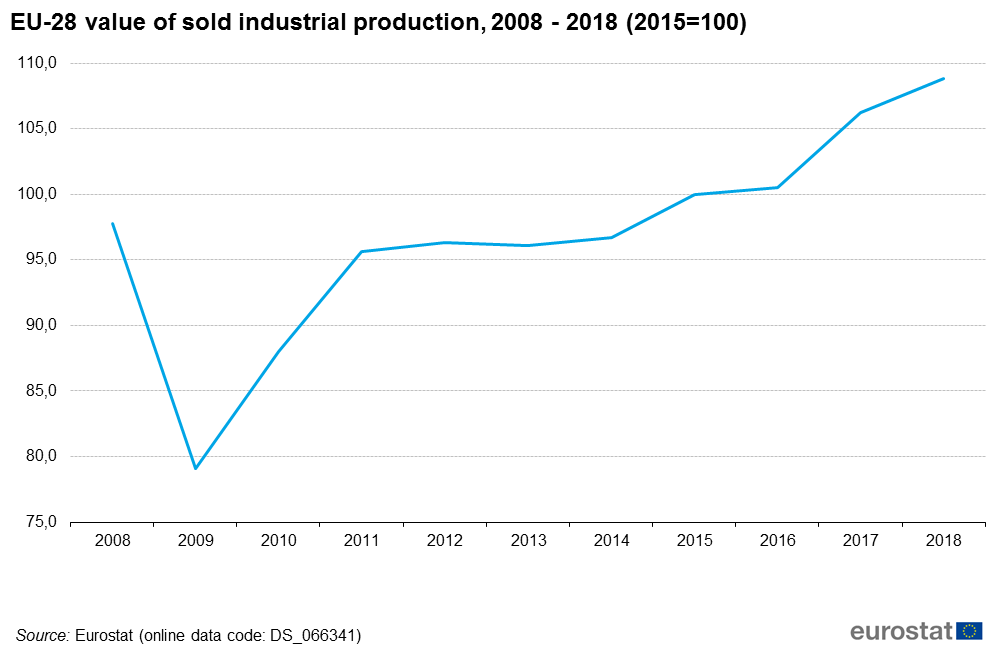
EU-28 value of sold industrial production, 2008 - 2018 (2015=100).png
(
file
)
35 KB
1
16:31, 12 December 2019
EU-28 value of sold industrial production 2008 - 2018 (2015100).png
(
file
)
24 KB
1
12:19, 10 December 2019
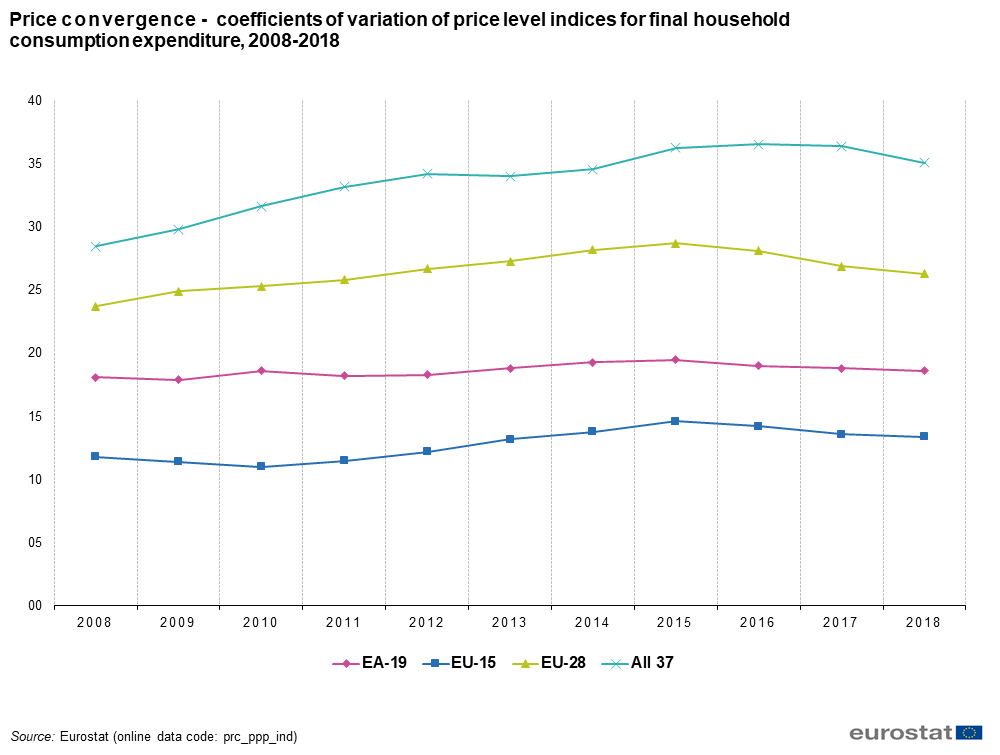
Price convergence - coefficients of variation of price level indices for final household consumption expenditure, 2008-2018 updated December.png
(
file
)
53 KB
1
12:05, 10 December 2019
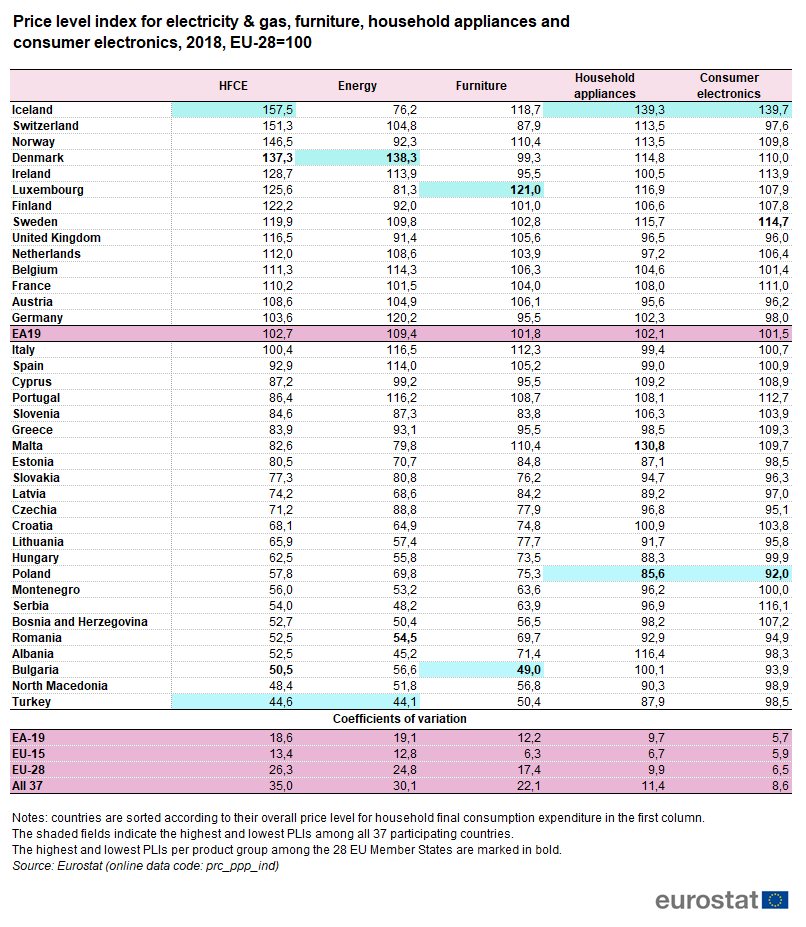
Price level index for electricity & gas, furniture, household appliances and consumer electronics, 2018, EU-28=100 updated December.png
(
file
)
86 KB
1
14:16, 3 December 2019
INCA project 2019 brochure.png
(
file
)
73 KB
1
14:14, 3 December 2019
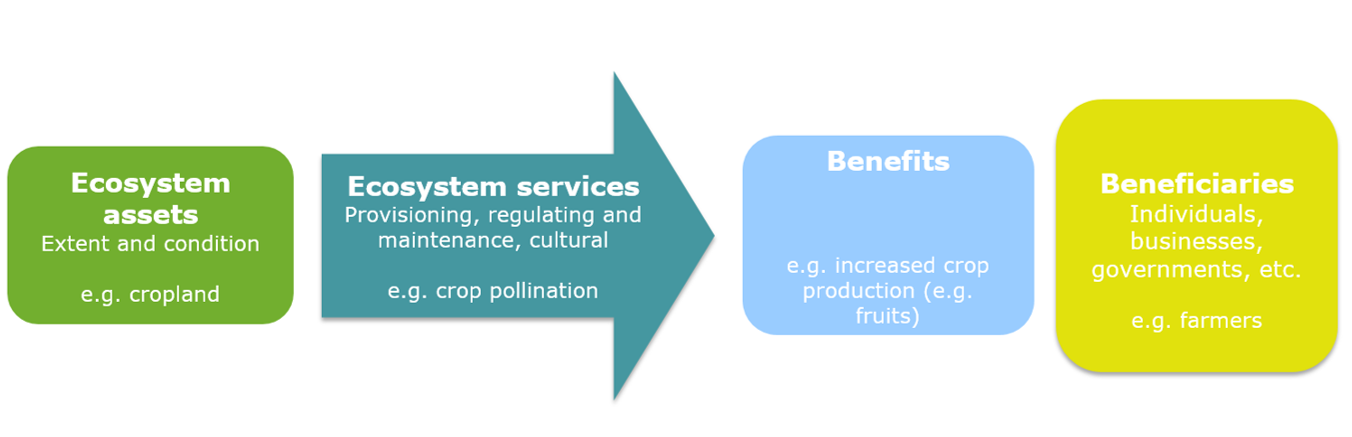
Ecosystem accounting concept introduction.png
(
file
)
140 KB
1
14:09, 3 December 2019
Ecosystem accounting concept.png
(
file
)
185 KB
1
18:26, 22 November 2019
Use table EU services accounts.png
(
file
)
31 KB
1
18:18, 22 November 2019
Supply table for EU ecosystem services.png
(
file
)
42 KB
1
15:16, 22 November 2019
Use account of EU level ecosystem services, 2012.png
(
file
)
20 KB
1
15:13, 22 November 2019
Supply account of EU-level ecosystem services, 2012.png
(
file
)
19 KB
1
15:00, 22 November 2019
The INCA project - 2019 brochure.png
(
file
)
98 KB
1
14:49, 22 November 2019
SEEA-EEA accounting system.png
(
file
)
32 KB
1
14:36, 22 November 2019
SEEA EEA.png
(
file
)
80 KB
1
12:50, 22 November 2019
Concept of ecosystem and ecosystem services accounting.png
(
file
)
131 KB
1
16:30, 19 September 2019
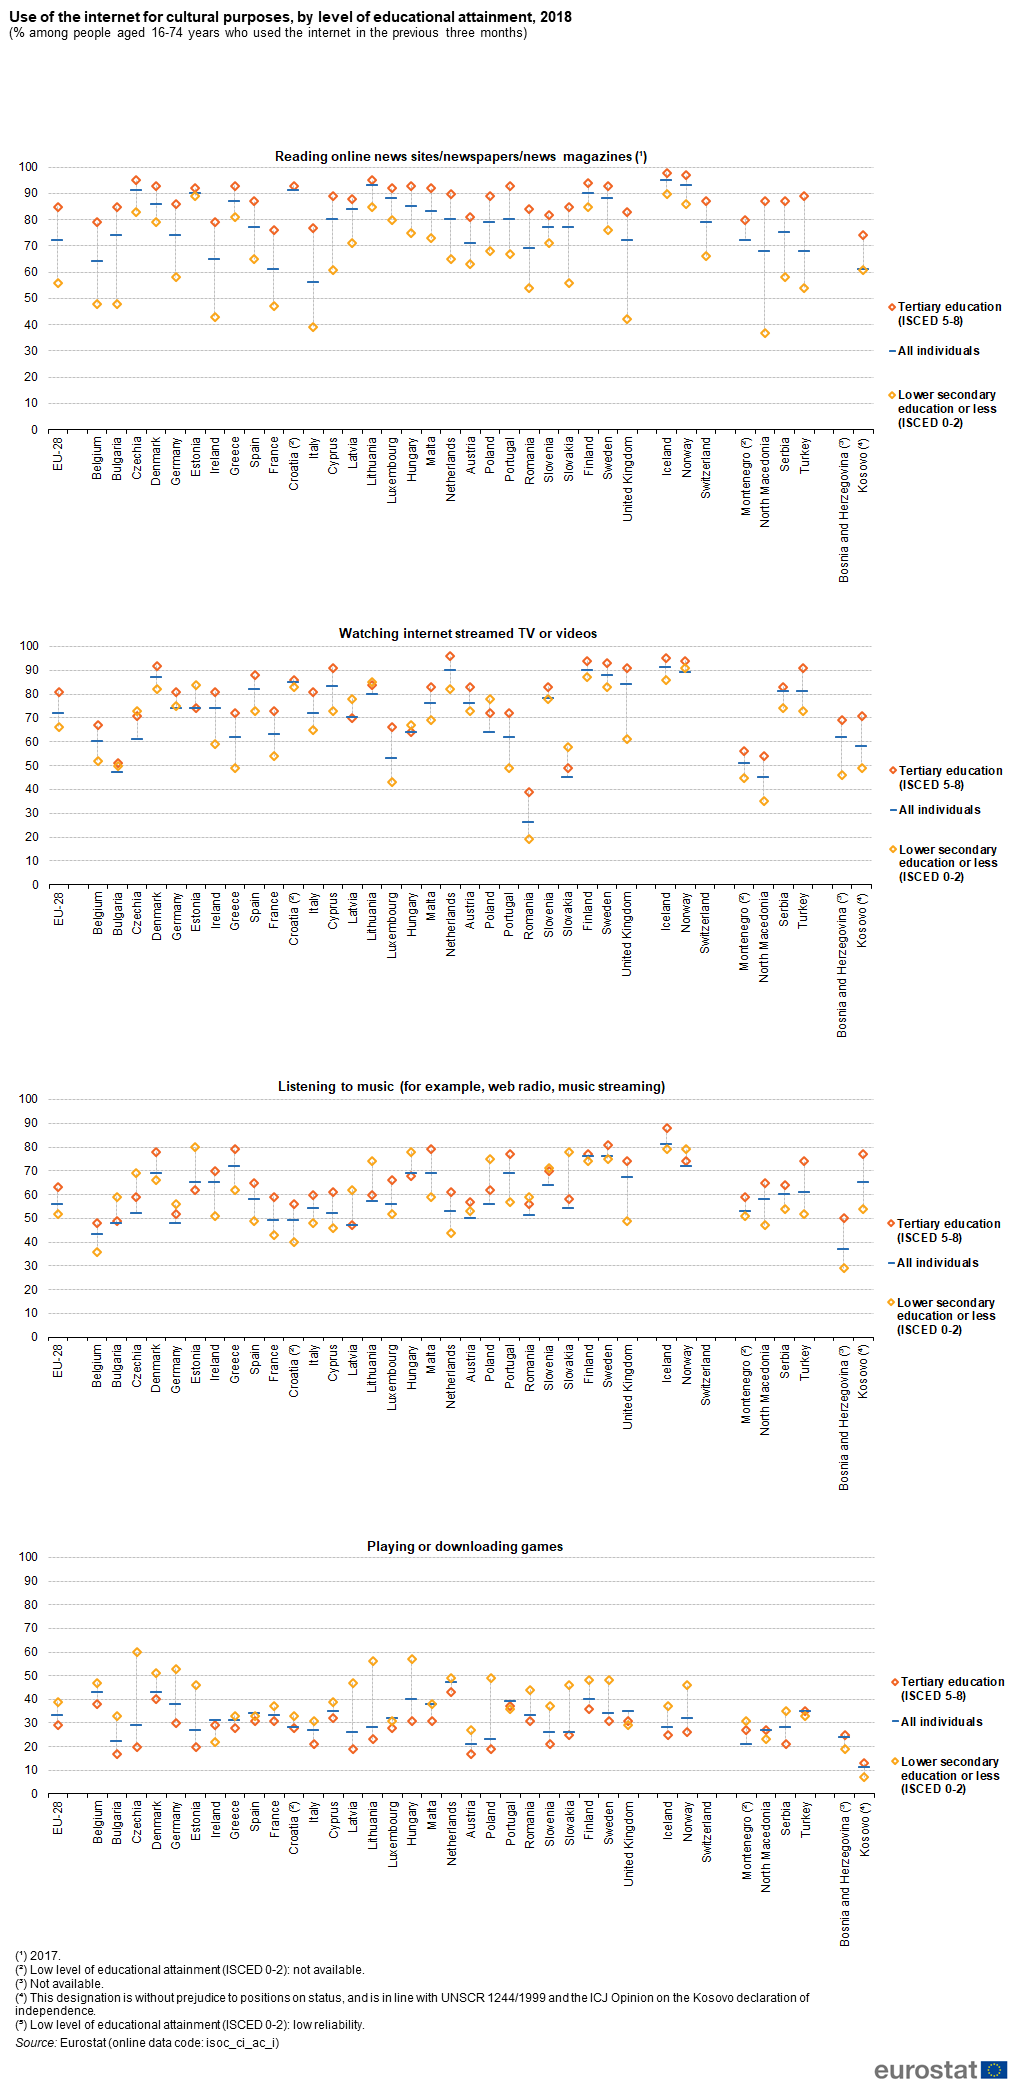
Use of the internet for cultural purposes, by level of educational attainment, 2018 (% among people aged 16-74 years who used the internet in the previous three months) CP2019.png
(
file
)
169 KB
2
16:20, 19 September 2019
Use of ICT in cultural participation CP2019.xlsx
(
file
)
113 KB
6
16:19, 19 September 2019
Use of the internet for purchasing cultural goods and services, by socioeconomic characteristic, EU-28, 2013 and 2018 (% among people who used internet within the previous year) CP2019.png
(
file
)
58 KB
3
15:07, 19 September 2019
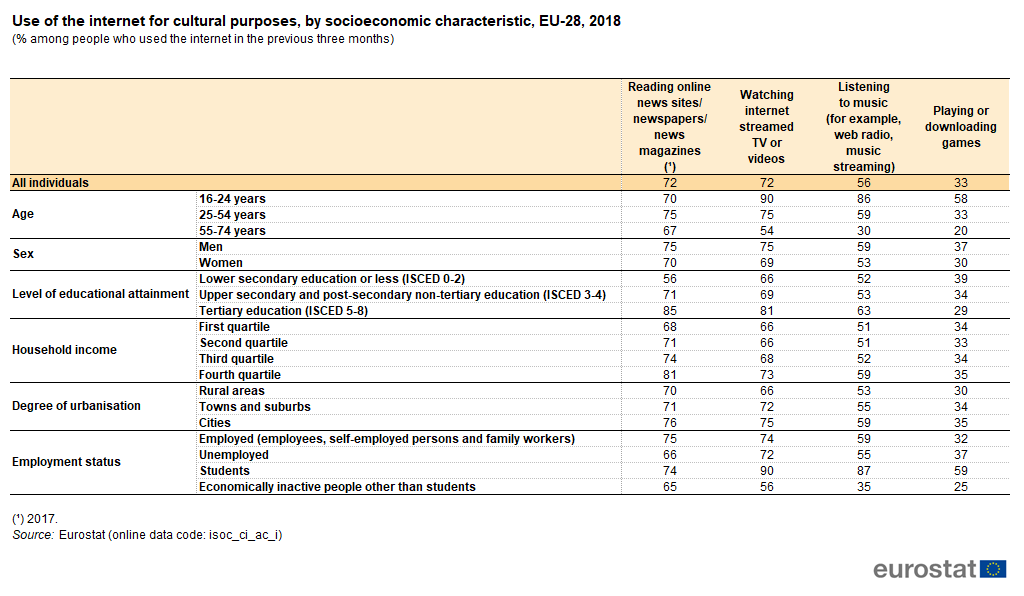
Use of the internet for cultural purposes, by socioeconomic characteristic, EU-28, 2018 (% among people who used the internet in the previous three months) CP2019.png
(
file
)
58 KB
2
15:02, 19 September 2019
Table 2 Use of internet for cultural purposes, by socio-economic characteristics, EU-28.png
(
file
)
54 KB
2
10:23, 19 September 2019
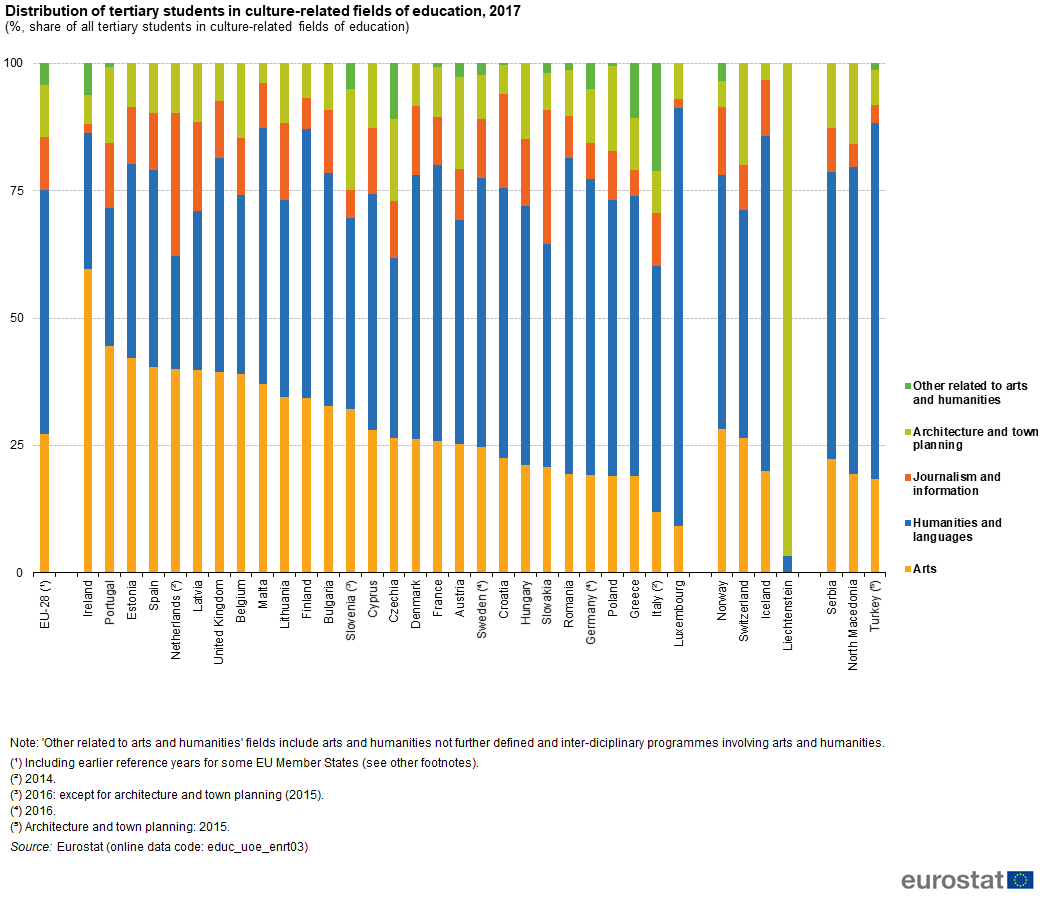
Distribution of tertiary students in culture-related fields of education, 2017 (%, share of all tertiary students in culture-related fields of education).png
(
file
)
110 KB
1
13:22, 7 June 2019
Transport equipment statistics update June2019.xlsx
(
file
)
107 KB
1
13:21, 7 June 2019
Motorisation rate of passenger cars, by country (2008-2017).png
(
file
)
71 KB
1
10:31, 17 January 2019
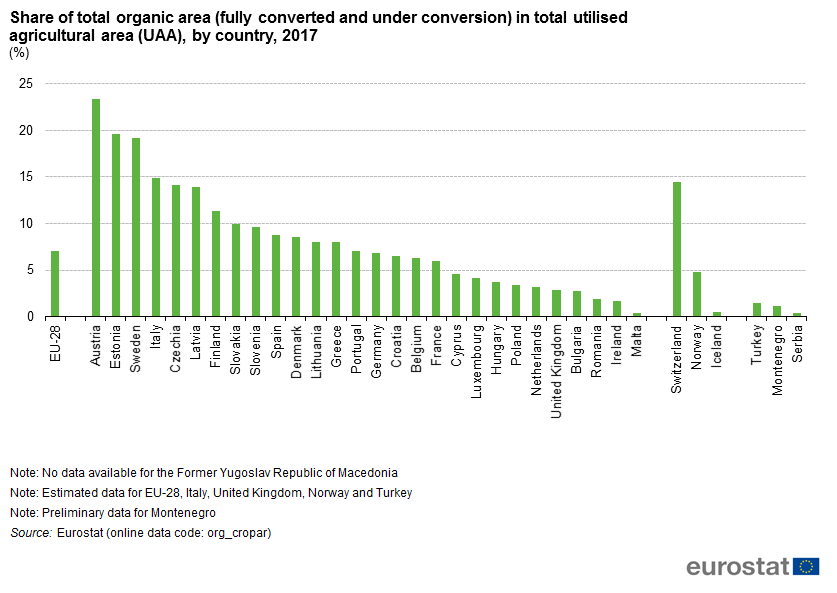
Share of total organic area (fully converted and under conversion) in total utilised agricultural area (UAA), by country, 2017 (%).png
(
file
)
46 KB
2
10:25, 17 January 2019
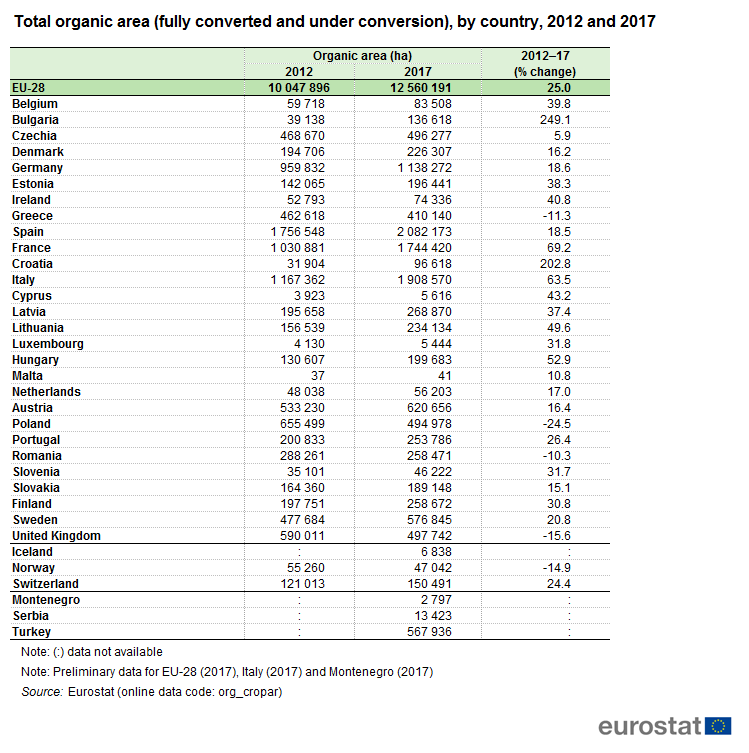
Total organic area (fully converted and under conversion), by country, 2012 and 2017.png
(
file
)
60 KB
2
10:24, 17 January 2019
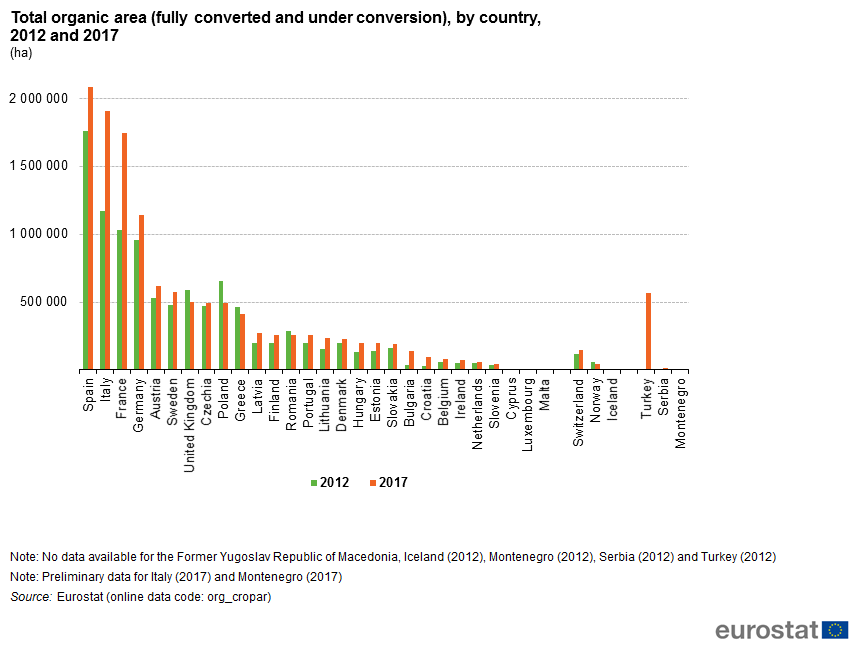
Total organic area (fully converted and under conversion), by country, 2012 and 2017 (ha).png
(
file
)
43 KB
2
10:22, 17 January 2019
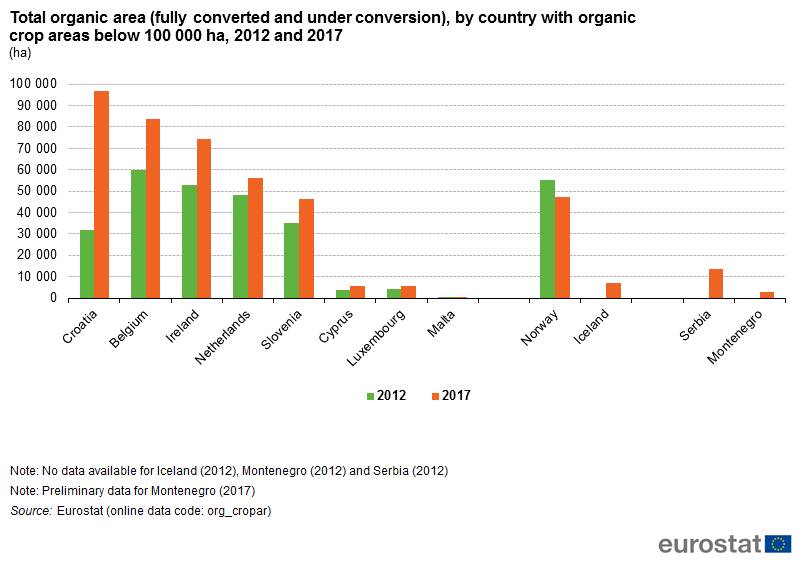
Total organic area (fully converted and under conversion), by country with organic crop areas below 100 000 ha, 2012 and 2017 (ha).png
(
file
)
41 KB
2
12:57, 16 January 2019
ORG T4 MANUFACTURERS.xlsx
(
file
)
299 KB
1
12:56, 16 January 2019
ORG T3 LIVESTOCK ANIMAL PROD.xlsx
(
file
)
304 KB
1
12:56, 16 January 2019
ORG T2 CROP.xlsx
(
file
)
314 KB
1
12:55, 16 January 2019
ORG T1 OPERATORS.xlsx
(
file
)
306 KB
1
16:38, 15 January 2019
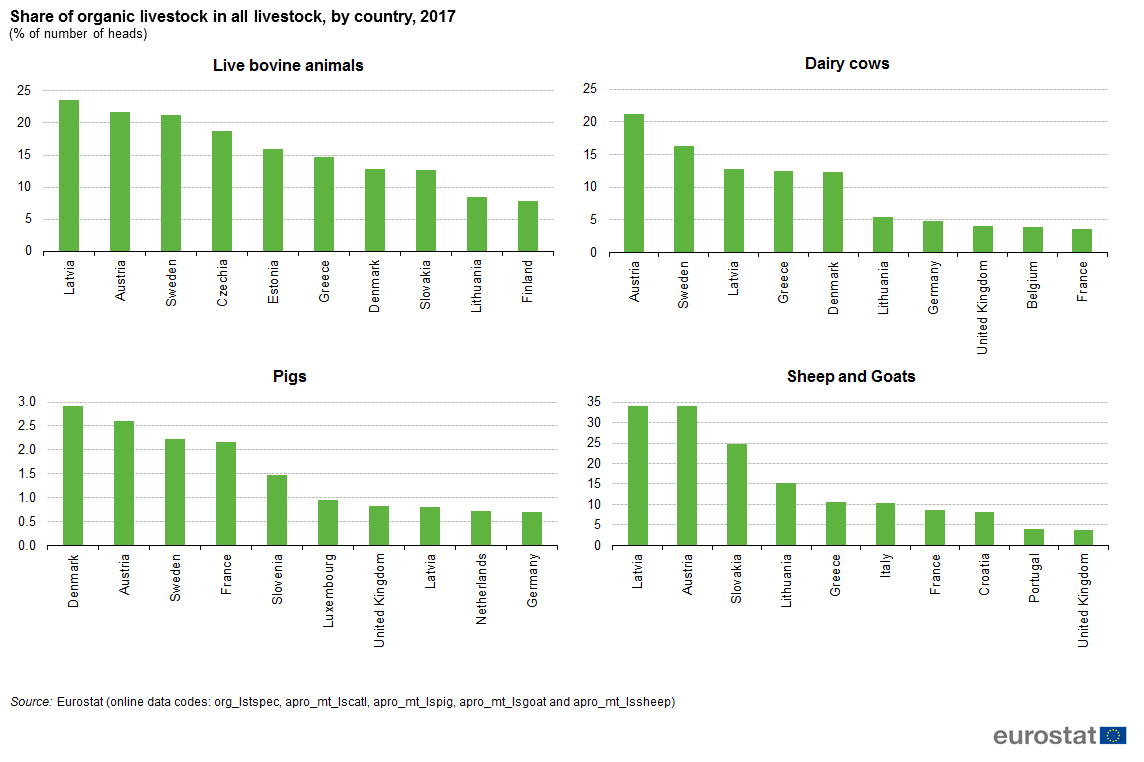
Share of organic livestock in all livestock, by country, 2017 (% of number of heads).png
(
file
)
57 KB
1
16:38, 15 January 2019
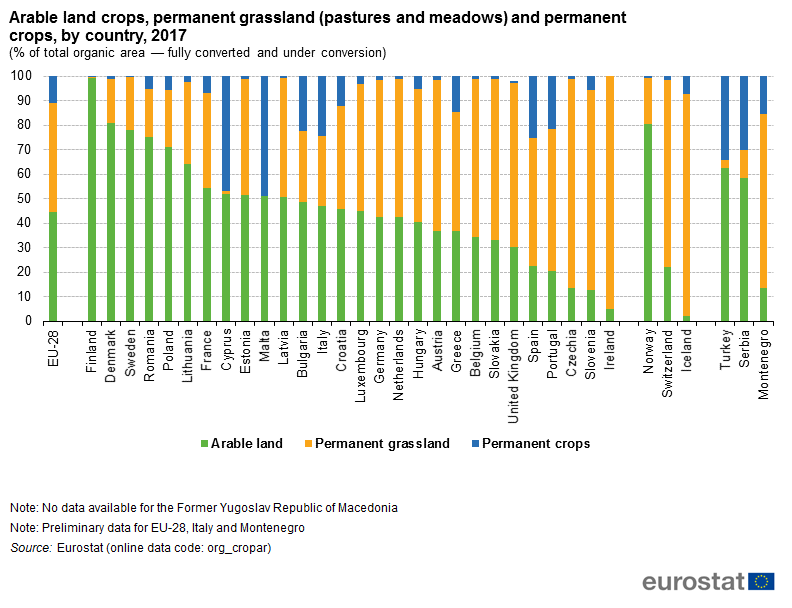
Arable land crops, permanent grassland (pastures and meadows) and permanent crops, by country, 2017 (% of total organic area — fully converted and under conversion).png
(
file
)
71 KB
1
16:38, 15 January 2019
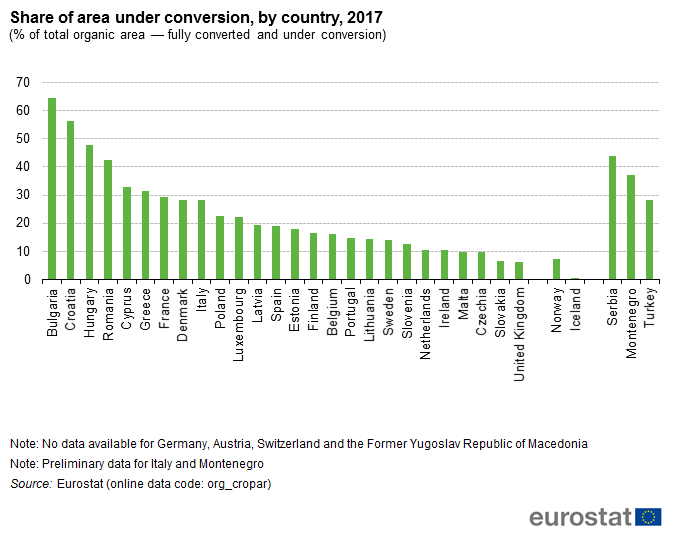
Share of area under conversion, by country, 2017 (% of total organic area — fully converted and under conversion).png
(
file
)
40 KB
1
16:37, 15 January 2019
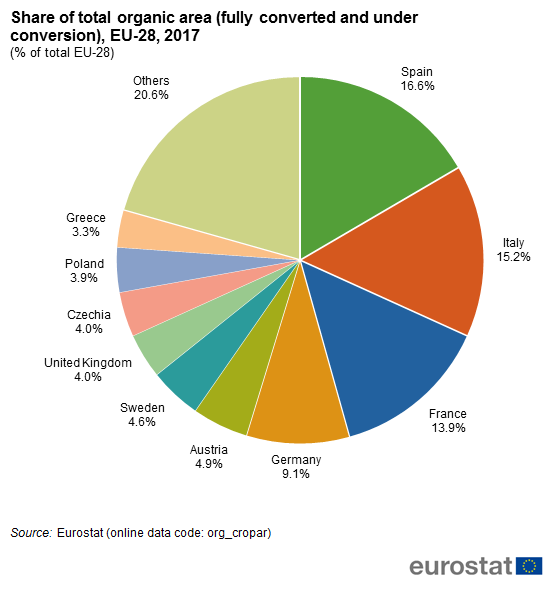
Share of total organic area (fully converted and under conversion), EU-28, 2017 (% of total EU-28).png
(
file
)
46 KB
1
16:44, 10 January 2019
SE Rail containers.xlsx
(
file
)
64 KB
1
11:07, 22 November 2018
Air safety statistics 2017 Final.xlsx
(
file
)
38 KB
1
10:54, 22 November 2018
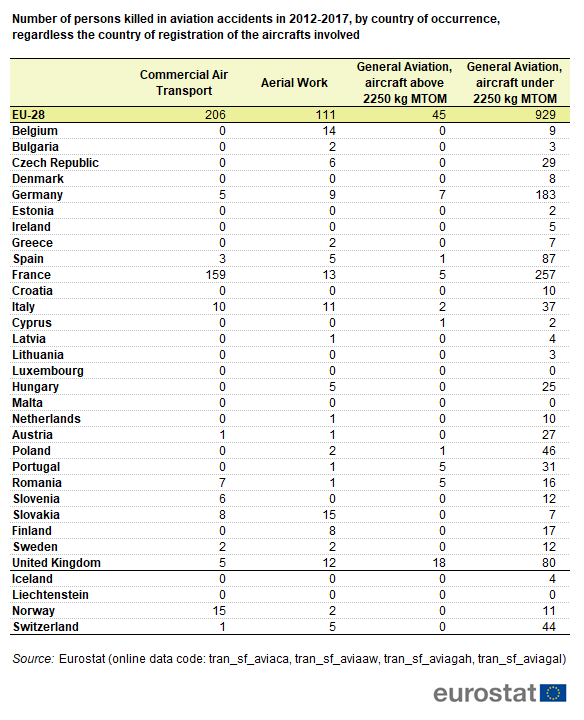
Number of persons killed in aviation accidents in 2012-2017, by country of occurrence, regardless the country of registration of the aircrafts involved.png
(
file
)
43 KB
1
10:48, 22 November 2018
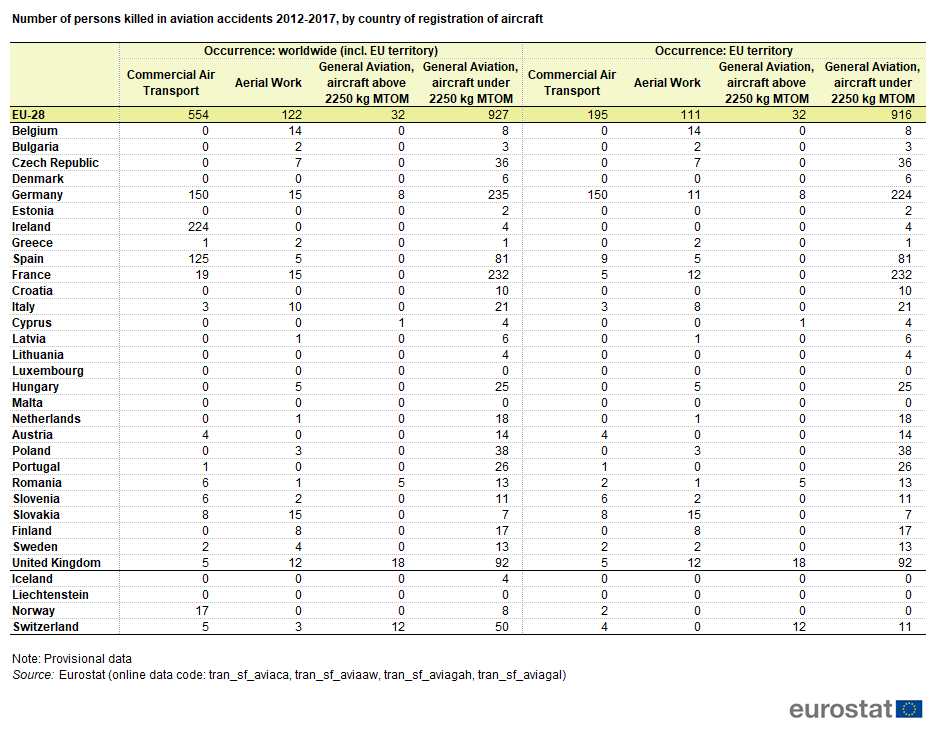
Number of persons killed in aviation accidents 2012-2017, by country of registration of aircraft.png
(
file
)
59 KB
1
10:43, 22 November 2018
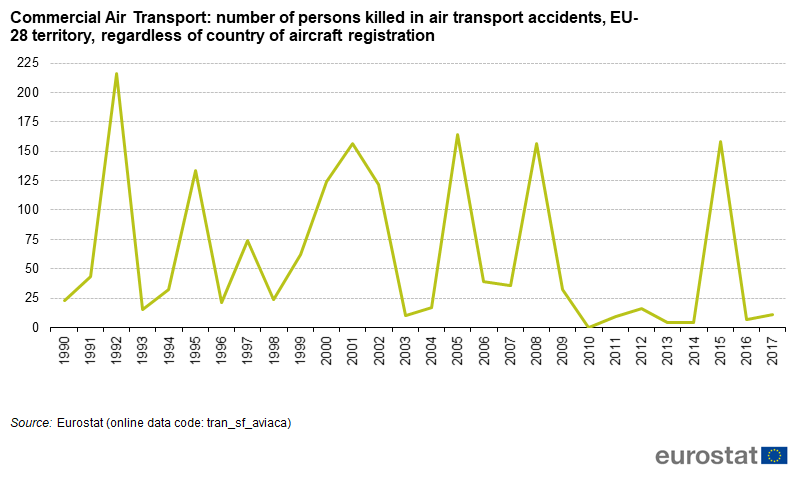
Commercial Air Transport number of persons killed in air transport accidents, EU-28 territory, regardless of country of aircraft registration.png
(
file
)
46 KB
2
10:41, 22 November 2018
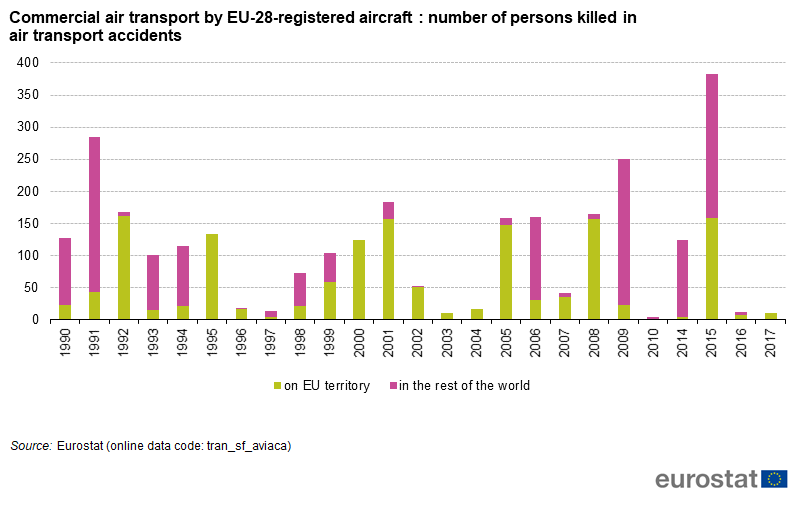
Commercial air transport by EU-28-registered aircraft number of persons killed in air transport accidents.png
(
file
)
36 KB
2
14:50, 30 August 2018
Duration of working life, 2017 figures.xlsx
(
file
)
1,011 KB
1
14:50, 20 July 2018
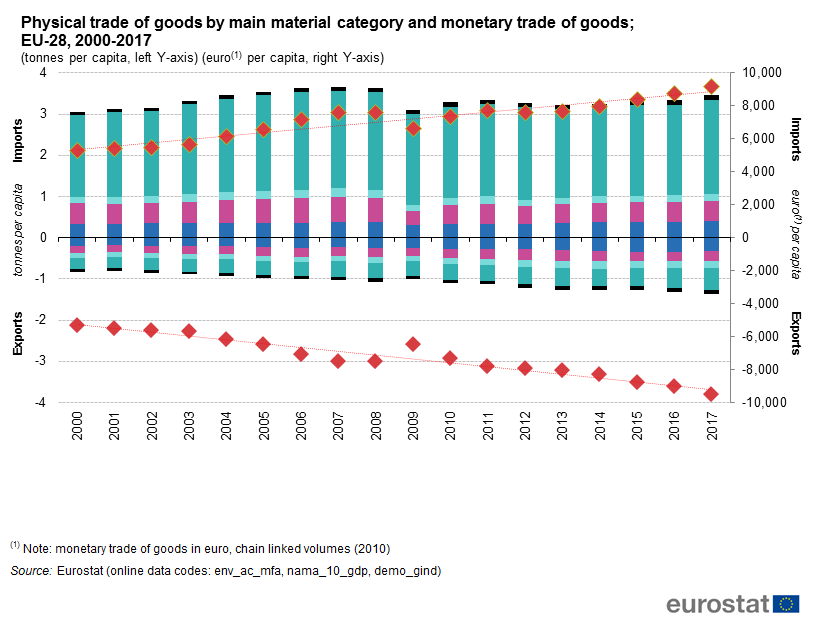
Physical trade of goods by main material category and monetary trade of goods; EU-28, 2000-2017.png
(
file
)
44 KB
1
16:45, 17 July 2018
Road safety stat national and regional level update 2018.xlsx
(
file
)
62 KB
1
16:44, 17 July 2018
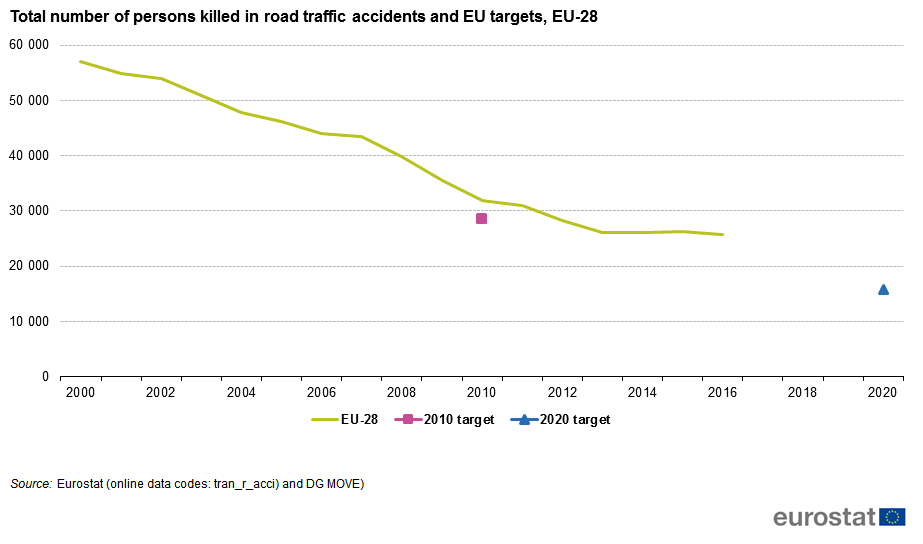
Total number of persons killed in road traffic accidents and EU targets, EU-28.png
(
file
)
25 KB
1
First page
Previous page
Next page
Last page
Special page
ISSN 2443-8219


.png)
_index_(base%3D2015).png)
.png)
.png)


_CP2019.png)
_CP2019.png)
_CP2019.png)

.png)
.png)
_in_total_utilised_agricultural_area_(UAA),_by_country,_2017_(%25).png)
,_by_country,_2012_and_2017.png)
,_by_country,_2012_and_2017_(ha).png)
,_by_country_with_organic_crop_areas_below_100_000_ha,_2012_and_2017_(ha).png)
.png)
_and_permanent_crops,_by_country,_2017_(%25_of_total_organic_area_%E2%80%94_fully_converted_and_under_conversion).png)
.png)
,_EU-28,_2017_(%25_of_total_EU-28).png)


