This Statistics Explained article has been archived in May 2019 - for recent articles on Agriculture, forestry and fisheries see Agriculture, forestry and fishery statistics.
- Data exracted in November 2015. Most recent data: Further Eurostat information, Main tables and Database. Planned article update: February 2019.
This article is part of a set of statistical articles based on the Eurostat online publication "Agriculture, forestry and fishery statistics". It presents some statistics from the most recent farm structure survey (FSS) conducted in the European Union (EU) and Norway in 2013, which followed the Agricultural census in 2010. The FSS covers the land use, livestock, labour force, production methods, and standard output of the EU-28’s agricultural holdings.
Since 2010, some methodological changes have been introduced in the FSS limiting comparability with previous survey years. The minimum size threshold for agricultural holdings was raised in some EU Member States. Moreover, under the new legislation, 98 % of the utilised agricultural area (UAA) and 98 % of the livestock of each country were covered, and common land was included in the UAA.
(% share of number of holdings in the EU-28)
Source: Eurostat (ef_kvaareg)

(number of holdings)
Source: Eurostat (ef_kvaareg)
(hectares)
Source: Eurostat (ef_kvaareg)
(number of holdings)
Source: Eurostat (ef_kvecsleg)
(million EUR)
Source: Eurostat (ef_kvecsleg)
(% of total UAA in the EU-28)
Source: Eurostat (ef_oluft)

(1 000 hectares)
Source: Eurostat (ef_oluft)
(number of holdings)
Source: Eurostat (ef_kvftreg)
(% of total livestock units in the EU-28)
Source: Eurostat (ef_kvaareg)

(% of farm labour force, by annual work units)
Source: Eurostat (ef_olfftecs)
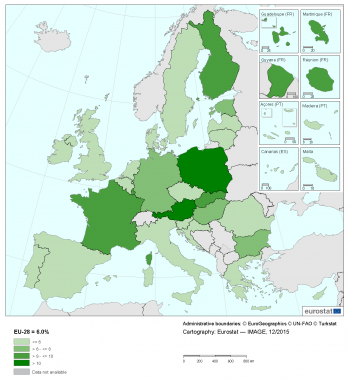
(% of total number of managers)
Source: Eurostat (ef_kvage)

(% of total number of managers)
Source: Eurostat (ef_kvage)
Main statistical findings
Agricultural holdings
Close to half of the agricultural holdings made up 2.5 % of the UAA
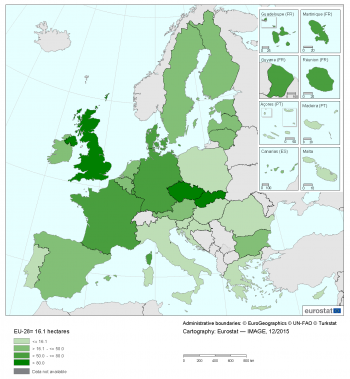
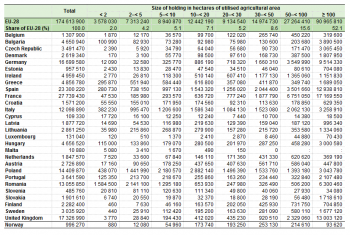
There were 10.8 million farms across the EU-28 in 2013, working 174.4 million hectares of land (the utilised agricultural area or UAA) or two fifths (40.0 %) of the total land area of the EU-28. The average size of each agricultural holding (farm) in the EU-28 was 16.1 hectares (see Map 1 and Table 1). However, there were stark contrasts in the structure of agriculture across the EU: on the one hand, there were a large number (4.9 million — close to half of all holdings) of very small farms (less than 2 hectares in size) that farmed a small proportion (2.5 %) of the total land area that was used for farming in 2013 and, on the other hand, a small number (0.3 million corresponding to 3.1 % of all holdings) of very large farms (over 100 hectares) that farmed half (50.1 %) of the utilised agricultural area in the EU-28 (see Tables 2 and 3).
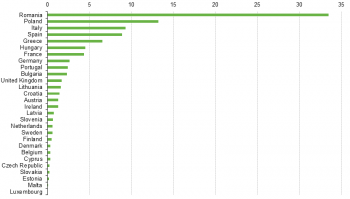
One third (33.5 % or 3.6 million) of all agricultural holdings in the EU-28 were in Romania (see Figure 1). These holdings can be characterised as being small; three quarters of them were under 2.0 hectares in size. Just over one fifth of the EU-28’s holdings were in Italy (9.3 %) and Poland (13.2 %) and these too can be characterised as being small (on average, under 12.0 hectares in size). However, there were a number of EU Member States where larger farms were more typical; a majority of farms in Belgium (54.2 %) Germany (55.0 %), Denmark (55.5 %), France (57.2 %), Ireland (57.3 %), the United Kingdom (61.3 %), Finland (62.4 %) and Luxembourg (66.3 %) were larger than 20 hectares. Indeed, the average size of an agricultural holding in the United Kingdom (93.5 hectares) was a little under six times as high as the EU-28 average in 2013, and the average size of holdings in the Czech Republic was even higher (133.0 hectares) as a result of a small number of very large farms.
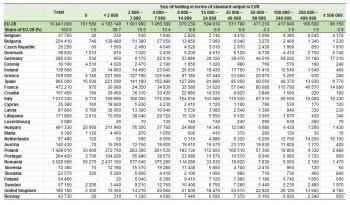
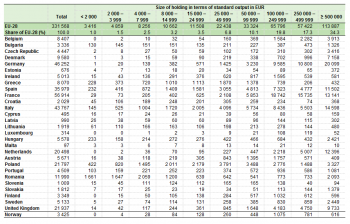
This contrast was also reflected in the economic size of holdings. Of the 10.8 million agricultural holdings in the EU-28 in 2013, 4.4 million holdings (40.2 %) had a standard output below EUR 2 000 and were responsible for only 1.0 % of total agricultural economic output in 2013. In contrast, the 2.4 % of holdings that had a standard output in excess of EUR 250 000 accounted for more than half (51.7 %) of all agricultural economic output (see Tables 4 and 5).
Agricultural land use
59.8 % of the utilised agricultural area in the EU-28 was used as arable land
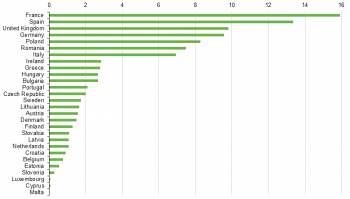
Close to half of all the land used in agriculture across the EU-28 was located in just four EU Member States: France (15.9 % of the EU-28 total), Spain (13.4 %), the United Kingdom (9.8 %) and Germany (9.6 %). Approximately one quarter (22.7 %) was cultivated in Poland, Romania and Italy together. The other 21 EU Member States farmed 28.6 % of the EU-28’s utilised agricultural area and accounted for at most 3 % each (see Figure 2).
Three fifths (59.8 %) of the utilised agricultural area in the EU-28 was used as arable land in 2013, a majority being used for cereal production. A further third (34.2 %) was permanent grassland and meadow. Permanent crops, such as vineyards, olive trees and orchards, accounted for a 5.9 % share and kitchen gardens around 0.2 % (see Table 6).
The majority of utilised agricultural area was used as arable land in 22 EU Member States, this share rising to over 90 % in Denmark and Finland. However, in Greece, Luxembourg, Slovenia, the United Kingdom and Ireland, where there is a high proportion of farms that specialise in grazing livestock, a majority of utilised agricultural area was permanent pasture and meadow. The proportion of utilised agricultural area occupied by permanent crops was relatively high in some of the Mediterranean countries, the highest shares (a little over 19 %) being in Cyprus, Greece and Portugal.
Farm typology
29.6 % of farms specialized in field crops
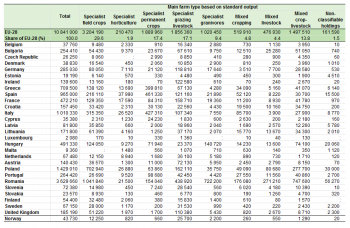
In 2013, just under a third (29.6 %) of EU-28 farms were holdings specialised in field crops (for example, cereals, oilseeds and vegetables). A further 17.4 % of farms were specialist permanent crop holdings (for example, vineyards, olive groves or orchards). Specialist grazing livestock holdings (dairy cows, cattle, sheep and other ruminants), granivore holdings (pigs or poultry), mixed livestock holdings and mixed crop-livestock holdings together accounted for over two fifths (44.7 %) of all agricultural holdings in the EU-28 (see Table 7).
Livestock units
Close to half of the EU-28 livestock units were bovine
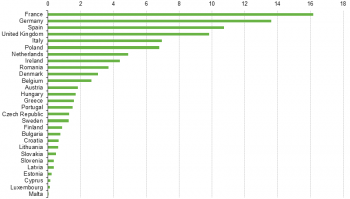
In order to compare different livestock, a notional unit called a ‘livestock unit’ (LSU) is used. To calculate LSUs, a range of agreed weights are applied to the various types of farm animal to provide figures that are the grazing equivalent of one adult dairy cow producing 3 000 kg of milk annually. On this basis, the ‘EU-28’s livestock herd’ was 130.3 million LSU in 2013; about one half (48.3 %) were cattle, 26.1 % were pigs and 15.3 % were poultry (see Table 8). Just over half (52.2 %) of the ‘EU-28’s livestock herd’ was located in just four EU Member States: France, Germany, Spain and the United Kingdom (see Figure 3).
Agricultural labour force
Agricultural holders and their family make up three quarters of the agricultural work force
According to the EU’s labour force survey (LFS), people employed in agriculture, forestry and fishing activities represented 5.2 % of all employment in 2013 [1].
The agricultural survey estimated that 22.2 million people worked regularly in agriculture, of which 20.2 million people were either holders or members of the holder's family. After taking into account the amount of time actually worked and converting this into full-time work equivalents (measured as annual work units or AWUs), the 2013 FSS estimated that the equivalent of 9.5 million people worked full-time on farms in 2013 (see Table 9). The agricultural labour force (in full-time labour equivalents) was highest in Poland (20.2 % of the EU-28 total), Romania (16.3 %), Italy and Spain (8.6 % each).
Farming was predominantly a family activity in the EU-28; about three quarters (76.5 %) of the labour input in agriculture came from the holder or members of his/her family in 2013. In Ireland, Croatia, Slovenia and Poland, family labour accounted for over 90 % of the volume of work carried out in agriculture (see Figure 4). In contrast, there was a small number of countries for whom non-family labour accounted for a majority of the labour force in 2013. These included Estonia (59.1 %), Slovakia (72.4 %) and the Czech Republic (74.2 %). Even in some countries where family labour provided a majority of labour, there were relatively large volumes of non-family labour: in particular, non-regular (seasonal) labour (often for picking perishable crops) represented between 10 % and 20 % of the total labour input within agriculture in Germany, Greece, France, the Netherlands, Italy and Spain.
Farm managers by age
More than half of farm managers were aged 55 or above in EU-28
Of the 10.8 million farm managers in the EU-28 agricultural sector in 2013, there were relatively few young farm managers. On average, for all EU Member States, managers younger than 35 accounted for only 6 % of the total number of all managers. On the other hand, more than half of the farm managers, (some 6 million farm managers, or 55.8 %) were aged 55 or above and thus close to or beyond the regular retirement age.
As shown in Map 2, of all the EU Member States, only Poland (12.1 %) and Austria (10.9 %) recorded more than 10 % of farm managers younger than 35.
By contrast, in Portugal almost three out of four (73.7 %) of all farm managers were aged 55 or above, while Romania (64.4 %), Italy (63.0 %), Croatia (62.5 %), Bulgaria (62.0 %), Hungary (59.5 %), Malta, Spain and United Kingdom (all 58.5 %), Sweden (58.0 %) the Czech Republic (57.0 %) and Greece (56.2 %) also registered a proportion of managers aged over 55 above the EU-28 average of 55.8 % (see Map 3).
Data sources and availability
The legal basis for the farm structure survey (FSS) is Regulation 1166/2008 of 19 November 2008. EU Member States collect information from individual agricultural holdings and, observing strict rules of confidentiality, data are forwarded to Eurostat. The information collected in the farm structure survey covers land use, livestock numbers, rural development, management and farm labour input (including the age, gender and relationship to the holder of the agricultural holding). The survey data can be aggregated by different geographic levels (for Member States, regions, and also districts). The data can also be arranged by size class, area status, legal status of the holding, objective zone and farm type.
The basic unit underlying the farm structure survey is the agricultural holding: a technical-economic unit, under single management, engaged in agricultural production. Although the thresholds for defining an agricultural holding can be different between countries (as high as five hectares of UAA in some cases), the survey covers 98 % of the UAA and the livestock of each country.
Context
The structure of agriculture in the Member States of the European Union (EU) varies as a function of differences in geology, topography, climate and natural resources, as well as the diversity of regional activities, infrastructure and social customs. The survey on the structure of agricultural holdings, also known as the farm structure survey, helps assess the agricultural situation across the EU, monitoring trends and transitions in the structure of agricultural holdings, while also modelling the impact of external developments or policy proposals.
See also
- Farm structure statistics
- Agriculture, forestry and fishery statistics
- Farm structure survey – survey coverage (background article)
- National Reference Metadata (2013)
Further Eurostat information
Data visualisation
Publications
Database
- Agriculture (agri), see:
- Farm structure (ef)
- Farm structure – 2008 legislation (from 2005 onwards) (ef_main)
- Key farm variables (ef_kv)
- Overview - Farm land use (ef_olu)
- Overview - Farm livestock (ef_ols)
- Overview - Farm labour force (ef_olf)
- Farm land use - Arable land (ef_ala)
- Farm land use - Permanent crops, other farmland, irrigation (ef_po)
- Farm livestock and fodder crops (ef_lsf)
- Farm labour force (ef_lf)
- Other gainful activities and support for rural development (ef_oga)
- Farm management and practises (ef_mp)
- Survey on agricultural production methods (SAPM, 2010) (ef_pm)
- Farm structure – 2008 legislation (from 2005 onwards) (ef_main)
Dedicated section
Methodology / Metadata
Several methodological changes have occurred in the 2013 edition of the FSS. One of the most significant was in Italy where the thresholds of the minimum size of the agricultural holdings were changed. This methodological change did not have impact on the coverage of the survey in terms of UAA or livestock, as only very small farm were eliminated from the survey. However it did impact the number of holdings, which decreased 0.6 million (48.6 %) from 2010 to 2013. For more detailed information please see the National Methodological Reports.
- Farm structure (ESMS metadata file — ef_esms)
- Farm structure – Methodology of Community surveys
- National Reference Metadata (2013) (ESMS metadata file — ef_esqrs)
- National methodological reports
Source data for tables, figures and maps (MS Excel)
Other information
- Regulation 1166/2008 of 19 November 2008 on farm structure surveys and the survey on agricultural production methods and repealing Council Regulation 571/88
- Regulation 1200/2009 of 30 November 2009 implementing Regulation 1166/2008 on farm structure surveys and the survey on agricultural production methods, as regards livestock unit coefficients and definitions of the characteristics
- Regulation 1242/2008 of 8 December 2008 establishing a Community typology for agricultural holdings
External links
- European Commission — Rural Development Policy
- European Commission — The Common Agricultural Policy after 2013
Notes
- Data from table ‘Employment by sex, age and economic activity (from 2008 onwards, NACE Rev. 2)’ — 1 000 ( (lfsa_egan2)). ↑
{{Unit|topic=X_Archive}

