Analysis of EU short-term progress towards the SDGs in the face of multiple crises
Data extracted in April 2023.
Planned article update: June 2024.
Highlights
This article is a part of a set of statistical articles, which are based on the Eurostat publication ’Sustainable development in the European Union — Monitoring report on progress towards the SDGs in an EU context — 2023 edition’. This report is the seventh edition of Eurostat’s series of monitoring reports on sustainable development, which provide a quantitative assessment of progress of the EU towards the SDGs in an EU context.
Full article
Sustainable development warrants a strong foundation supported by peace and security. However, 2022 was marred by multiple crises that affect the 2030 Agenda and the SDGs, threatening the achievement of the global goals. More than a year after the beginning of the Russian war of aggression against Ukraine, the consequent ripples of social and economic disruptions are still felt throughout the world. The ongoing humanitarian crisis in Ukraine has led to a mass displacement of people now seeking refuge in the EU and other neighbouring countries, thereby directly impacting several SDGs. The war is perceived as a fundamental change in the lives of people, with 61 % of Europeans being confident that their life will not continue unchanged [1]. Further, the complex economic ties with Russia and their disruption as a result of war and sanctions, have reverberations across the EU and beyond. Sharp rises in food and energy prices, combined with other impacts of the Russian invasion, hinder the implementation of the 2030 Agenda. These impacts further exacerbate the ongoing crises of climate change and environmental destruction and make achieving the SDGs even more challenging.
The analysis in this chapter is done in the context of SDG monitoring, using breakdowns of the EU SDG indicators and other short-term indicators, such as quarterly greenhouse gas emissions, for illustrating some short-term effects on the EU’s progress towards the SDGs in the face of multiple crises, with a focus on the war in Ukraine. Many effects of the COVID-19 pandemic are discussed in the thematic SDG articles of this report (see, for example, the articles on SDG 3, SDG 5 and SDG 8).
While the EU economy has recovered after the COVID-19 pandemic, inflationary pressures have risen
The Russian invasion of Ukraine in February 2022 hit Europe at a time when it was just recovering from the economic disruptions caused by the COVID-19 pandemic. Previously, following the lockdown measures put in place by EU Member States to halt the spread of COVID-19, the EU’s economy (SDG 8) experienced a considerable drop in the EU’s real gross domestic product (GDP) per capita by 5.7 % in 2020 compared with 2019. However, by 2021, many economic indicators had bounced back to almost pre-pandemic levels. Starting from the second quarter of 2021, GDP in the EU has increased continuously, resulting in an annual growth of real GDP per capita by 3.3 % in 2022 compared with 2021 [2].
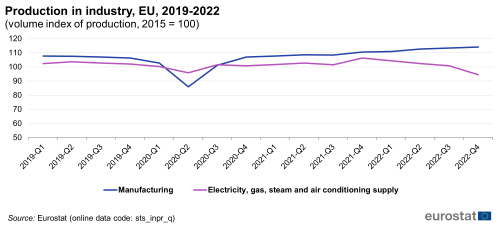
While overall industrial production (in value added terms) (SDG 12) had fallen significantly in 2020 owing to the pandemic, it has made a significant recovery and in 2022 exceeded pre-pandemic levels, leading to an annual increase of 3.0 % in 2022 compared with the previous year [3]. However, this trend was largely driven by the manufacturing sector. In contrast, production (in value added terms) in electricity, gas, steam and air conditioning supply fell by 1.8 % in the first quarter of 2022 compared with the last quarter of 2021 and has been gradually declining since (see Figure 1). In the fourth quarter of 2022, the production volume of this sector was around 11 % lower than in the last quarter of 2021 [4].
Source: Eurostat (sts_inpr_q)
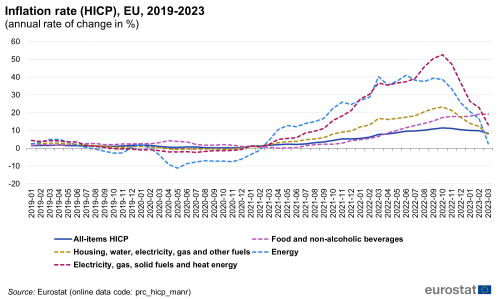
One of the most significant impacts from the recent crises is the rise in the EU’s inflation rate since the start of 2021, reaching a peak of 11.5 % in October 2022, affecting most goods and services. This increase in prices since 2021 can be attributed to a fast reopening of the economy after the pandemic and higher energy prices owing to lower oil and gas reserves from the previous year [5]. The first quarter of 2022, which marked the beginning of Russia’s military aggression towards Ukraine, exacerbated the price rise, particularly for electricity, gas, solid fuels and heat energy (SDG 7). The inflation rate continued to increase for all categories throughout 2022, peaking in October 2022, which marked the height of the energy crisis in the EU. In that month, consumer prices for electricity and gas were 52.6 % higher than in October 2021. However, this rate has fallen from October 2022 through March 2023, with values lower than at the start of 2022, but still significantly higher than pre-pandemic levels [6].
Source: Eurostat (prc_hicp_manr)
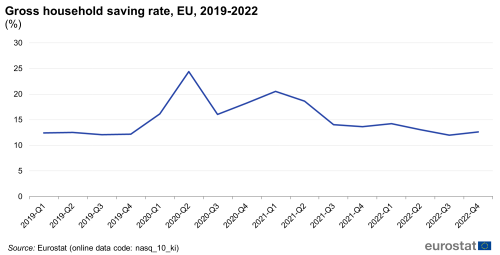
The inflation rate for the category of food and non-alcoholic beverages (SDG 2) has also been on the rise since 2021. However, unlike energy inflation, food price inflation has not shown a decline in recent months and continued to rise as of March 2023. The housing costs (SDG 1) followed the overall trend, showing an increase in 2021 and through most of 2022, with a decline towards the end of 2022 [7]. The economic disruptions brought about by the pandemic and Russia’s invasion of Ukraine, leading to high energy prices and subsequent rise in the prices of goods and services, are also reflected in the evolution of the EU’s gross household saving rate (see Figure 3) (SDG 1). While the savings rate had remained stable at around 12.5 % in the year before the pandemic, it rose dramatically in the second quarter of 2020, reaching almost 25 %. Since 2021, however, the rate has shown a substantial decline, in parallel to the increase in the inflation rate described above. By the third and fourth quarters of 2022, the gross household saving rate had fallen back to the levels observed in 2019, at 12.0 % and 12.6 %, respectively [8].
The impact of rising prices on the standard of living are being felt by the public. According to the Spring 2022 Eurobarometer survey carried out by the European Parliament around the start of the Russian invasion, almost nine in ten Europeans have either already experienced a reduction in their standard of living (SDG 1) which they expect to continue (40 %), or expect such an impact to occur over the next year (47 %). Vulnerable socio-demographic groups in Europe were hit harder by the consequences of the invasion, including the elderly, citizens with lower formal education, those without employment, single parents, and those that otherwise have difficulties in making ends meet. In total, a majority of Europeans said they are not ready to face surging energy (58 %) or food prices (59 %). However, a similar majority of the Europeans surveyed (59 %) considered the defence of common European values such as freedom and democracy (SDG 16) more important than maintaining prices and the cost of living.
The EU’s energy import dependency on Russia has fallen
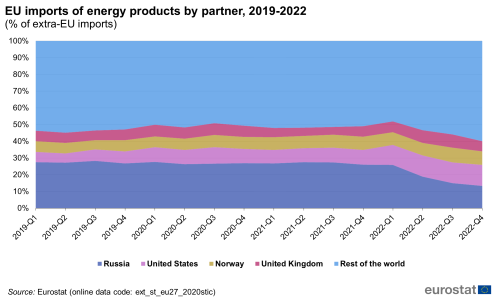
Russia’s invasion of Ukraine and the consequent sanctions have impacted the international trade in goods, both directly and indirectly, especially causing disruptions in the trade of oil, natural gas and coal (SDG 7). In 2021, the year before the invasion, more than half of the EU’s energy demand was met by imports, with the import dependency being particularly high for oil and petroleum products (91.7 %) and natural gas (83.4 %) [9]. For both energy carriers, Russia was the most important supplier in 2021, accounting for 28.4 % of extra-EU imports of oil and petroleum products and for 44.1 % of extra-EU imports of natural gas [10]. Starting from the first and second quarters of 2022, however, the share of energy imports from Russia dropped significantly and continued to decline for the rest of the year. Between the first and the fourth quarters of 2022, the share of energy imports from Russia decreased from 25.8 % to 13.3 %. This relative reduction in dependence on Russia was substituted with increased imports from the United States, Norway and the United Kingdom, accounting for 12.6 %, 8.1 % and 6.1 % of the total energy imports in the fourth quarter of 2022, respectively [11].
Source: Eurostat (ext_st_eu27_2020stic)
The gradual shift in trade partners away from Russia resulted in strong declines in the monetary value of Russia’s share in extra-EU imports of natural gas, falling from 36 % in 2021 to 21 % in 2022 [12]. The invasion also impacted EU’s gas consumption, reducing it by 19.3 % in the period August 2022 to January 2023, compared with the average consumption for the same months between 2017 and 2022 [13].
At the start of 2022, Russia was also the largest supplier of crude oil to the EU, accounting for 31 % of imports, followed by the United States. The instability that came along with the Russian invasion was also reflected in the imports of crude oil from Russia, which first showed considerable fluctuations between February and April of 2022, followed by a significant decline from May 2022 onwards. In December 2022, crude oil imports from Russia were down to only 4 % of the total. This decline in imports from Russia was substituted with imports from the United States and Norway, amounting to 18 % and 17 % of the total imports of crude oil, respectively [14].
Temporary protection has been granted in the EU to those displaced by the Russian invasion of Ukraine
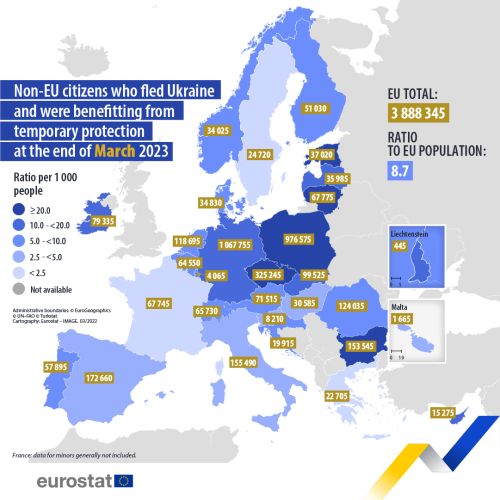
In addition to its effects on the economy and trade in energy, the Russian military aggression against Ukraine has left in its wake an influx of displaced people from the invasion (SDG 10) who have sought refuge in the EU and other neighbouring countries. Following the displacement caused, the Council Decision of March 2022 enabled non-EU citizens fleeing Ukraine to receive immediate and temporary protection. The Decision originally granted temporary protection for one year but this has now been extended until March 2024, with provisions made for further extension conditional on how the situation evolves [15].
Source: Eurostat (migr_asytpsm) and (demo_gind)
At the end of March 2023, about 3.9 million displaced people from Ukraine were beneficiaries of this temporary protection in the EU. Germany, Poland and Czechia hosted the highest absolute number of beneficiaries, providing temporary protection for around 61 % of all beneficiaries in the EU. Czechia, Estonia, Poland, Lithuania and Bulgaria provided the highest temporary protections relative to their populations. After the first half of 2022, the number of temporary protections sought decreased considerably, with the number of people granted temporary protection in the EU falling by about 65 % between the first and the last quarter of 2022. As of March 2023, a large proportion of temporary protection seekers were adult women (mainly aged 35 to 64 years), representing around 47 % of the total beneficiaries. The second largest group were children, amounting to about 35 % of the beneficiaries. Of the countries for which data is available, Belgium and Lithuania granted the most temporary protections to unaccompanied minors in the EU [16].
Greenhouse gas emissions have declined since the start of 2022
The more recent crises mentioned above also interfere with the EU’s ambition of tackling the climate crisis. The COVID-19 pandemic and the related lockdown measures resulted in a short-term improvement in some indicators that are used as proxies to monitor climate change mitigation, such as energy use and greenhouse gas (GHG) emissions (SDG 7 and SDG 13). At the same time, there is evidence that the pandemic has caused harm to the environment (SDG 12 and SDG 15) in the form of increased pollution from single-use plastics (such as masks, gloves and take-away food containers) [17].
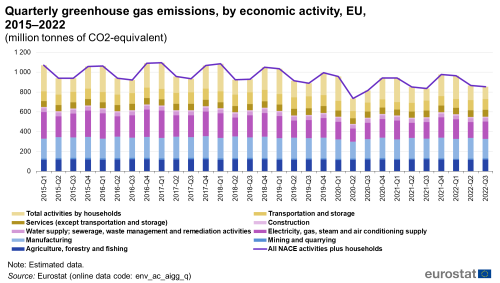
Given the revival of the economy after the COVID-19 pandemic, the EU’s greenhouse gas (GHG) emissions increased by 2 % in the third quarter of 2022 compared with the same quarter of the previous year. However, relative to the pre-pandemic levels, GHG emissions remained 4 % below the level reported in the third quarter of 2019. The highest increases in GHG emissions between the third quarters of 2021 and 2022 were observed in transportation and storage (9 %), electricity and gas supply (5 %), and services excluding transport and storage (4 %). Over the same period, GHG emissions from agriculture, manufacturing and water supply declined slightly by around 1 % or less. The EU’s overall GHG emissions have declined since the start of 2022, indicating that despite the economic rebound, the EU managed to continue the long-term downward trend of GHG emissions trend [18].
Source: Eurostat (env_ac_aigg_q)
Conclusions
The EU had already strayed off its path to achieving the 2030 Agenda and the SDGs as a result of the pandemic sweeping the world. Russia’s military aggression against Ukraine and the consequent social and economic disruptions, in addition to the substantial loss of life and property, have been felt throughout the EU and other parts of the world. The invasion also highlighted the energy dependency of the EU, and other parts of the world, on Russia and impacted EU citizens directly through rising living costs. Combined with the ongoing climate crisis, these short-term crises have created significant hurdles for attaining the SDGs.
The EU’s response has included humanitarian support by providing temporary protection to people fleeing Ukraine, financial support to Ukraine and placing economic sanctions on the Russian government, companies and individuals. The majority of Europeans consider the EU’s overall response to be satisfactory [19], even though the consequences of the Russian invasion are already clearly visible in the EU. Despite the EU’s efforts to diversify its energy sources and reduce its dependence on Russia, the EU economy has seen a price hike for energy that has influenced prices for housing and increasingly food products. Conversely, the household saving rate has fallen back to pre-pandemic levels, after peaking during the COVID-19 crisis. In the area of energy, available short-term statistics show a considerable decline in Russia’s share of EU energy imports alongside a reduction in the EU’s overall demand for natural gas. These developments might also help the EU to meet its long-term climate targets. While the available short-term data for 2022 suggest a slight increase in GHG emissions compared with 2021, EU emissions remain below pre-pandemic levels and appear to continue their long-term downward trend.
One year on from the onset of Russia’s invasion, the long-term effects on the EU’s economic and social fabric remain to be seen. With more data becoming available, future SDG monitoring reports might present a more detailed and nuanced picture of the consequences of Russia’s military aggression against Ukraine.
Direct access to
More detailed information on EU SDG indicators for monitoring of progress towards the UN Sustainable Development Goals (SDGs), such as indicator relevance, definitions, methodological notes, background and potential linkages, can be found in the introduction of the publication ’Sustainable development in the European Union — Monitoring report on progress towards the SDGs in an EU context — 2023 edition’.
Further reading on Short Term Crises
- European Central Bank (2021), Why is inflation currently so high?
- Eurostat (2022), EU international trade in goods — latest developments.
- Eurostat (2023), EU trade with Russia continues to decline.
- Eurostat (2023), EU gas consumption decreased by 19 %.
- Eurostat (2023), Crude oil imports and prices: changes in 2022.
- European Council (2023), Infographic — EU temporary protection for displaced persons.
- Eurostat (2023), Statistics Explained: Temporary protection for persons fleeing Ukraine — monthly statistics.
- Eurostat (2023), Quarterly greenhouse gas emissions in the EU.
- EEA (2021), Impacts of COVID-19 on single-use plastic in Europe’s environment.
- EEA (2023), Europe’s air quality status 2023.
- European Parliament (2022), EP Spring 2022 Survey: Rallying around the European flag — Democracy as anchor point in times of crisis.
- European Parliament (2023), Standard Eurobarometer 98 — Winter 2022–2023: The EU’s response to the war in Ukraine
- International Organization for Migration (IOM) (2022). DTM Ukraine — Internal Displacement Report — General Population Survey Round 11 (25 November - 5 December 2022). IOM, Ukraine.
Further data sources on Short Term Crises
Notes
- ↑ European Parliament (2022), EP Spring 2022 Survey: Rallying around the European flag — Democracy as anchor point in times of crisis.
- ↑ Source: Eurostat (online data codes: (sdg_08_10) and {{Stable link|title=|code=namq_10_gdp})
- ↑ Source: Eurostat (online data code: (sts_inpr_a))
- ↑ Source: Eurostat (online data code: (sts_inpr_q))
- ↑ European Central Bank (2021), Why is inflation currently so high?
- ↑ Source: Eurostat (online data code: (pcr_hicp_manr))
- ↑ Source: Eurostat (online data code: (prc_hicp_midx))
- ↑ Source: Eurostat (online data code: (nasq_10_ki))
- ↑ Source: Eurostat (online data code: (sdg_07_50))
- ↑ Source: Eurostat (online data codes: (nrg_ti_oil) and (nrg_ti_gas))
- ↑ Eurostat (2022), EU international trade in goods — latest developments.
- ↑ Eurostat (2023), EU trade with Russia continues to decline; and Eurostat (online data code: (DS-045409)).
- ↑ Eurostat (2023), EU gas consumption decreased by 19 %.
- ↑ Eurostat (2023), Crude oil imports and prices: changes in 2022.
- ↑ European Council (2023), Infographic — EU temporary protection for displaced persons.
- ↑ Source: Eurostat (online code: (migr_asytpsm)) and Eurostat (2023), Statistics Explained: Temporary protection for persons fleeing Ukraine — monthly statistics.
- ↑ EEA (2021), Impacts of COVID-19 on single-use plastic in Europe’s environment.
- ↑ Eurostat (2023), Quarterly greenhouse gas emissions in the EU.
- ↑ European Parliament (2023), Standard Eurobarometer 98 — Winter 2022–2023: The EU’s response to the war in Ukraine.
