SDG 12 - Responsible consumption and production
Ensure sustainable consumption and production patterns
Data extracted in April 2024.
Planned article update: June 2025.

This article is a part of a set of statistical articles, which are based on the Eurostat publication ’Sustainable development in the European Union — Monitoring report on progress towards the SDGs in an EU context — 2024 edition’. This report is the eighth edition of Eurostat’s series of monitoring reports on sustainable development, which provide a quantitative assessment of progress of the EU towards the SDGs in an EU context.
SDG 12 calls for a comprehensive set of actions from businesses, policy-makers and consumers to adapt to sustainable practices. It envisions sustainable production and consumption based on advanced technological capacity, resource efficiency and reduced global waste.
Full article
Responsible consumption and production in the EU: overview and key trends
Consumption and production patterns have wide environmental and social impacts. Monitoring SDG 12 in an EU context focuses on developments in the areas of consumption patterns, the green economy, and waste generation and management. Overall, the EU’s progress towards this goal over the five-year period assessed has been mixed. While consumption of hazardous chemicals and energy productivity have shown positive developments, the EU’s material footprint has increased, and the EU’s consumption footprint continues to considerably transgress several planetary boundaries. The picture is also mixed on waste, as circular use of materials is not growing fast enough to meet the target, while waste generation has slightly reduced. On a positive note, the value added from the environmental goods and services sector has been growing.
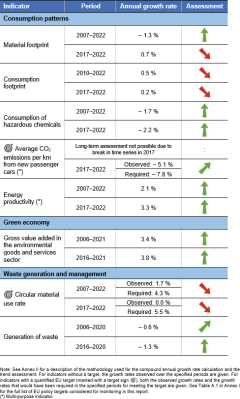
Table 1: Indicators measuring progress towards SDG 12, EU
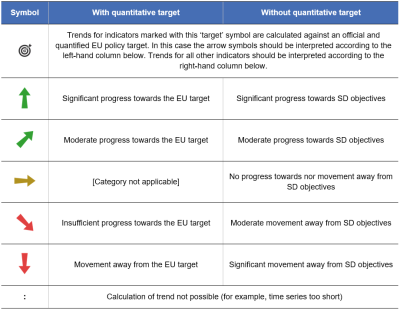
Table 2: Explanation of symbols for indicating progress towards SD objectives and targets


Consumption patterns
Economic growth improves people’s well-being but has long been associated with greater environmental impacts due to increased resource and energy consumption. Continuous growth in the consumption of finite resources both harms the environment and significantly contributes to climate change. The EU’s long-term objective, as outlined in the 8th Environment Action Programme, is to build a well-being economy, where resource- and energy-efficiency are improved, and environmental and climate impacts associated with production and consumption are reduced.
The EU’s material footprint has been growing over the past decade
The material footprint, also referred to as raw material consumption (RMC), is the amount of materials used along the supply chains of goods and services that are finally consumed in a country. The indicator thus measures the extracted materials (both domestic and abroad) needed to produce goods and services consumed by final users inside EU borders and estimates the volume of traded products — imports and exports — in raw material equivalents.
The EU’s material footprint had been growing between 2000 and 2008, before it was halted by the effects of the financial crisis. As the economy recovered, the raw material consumption of the EU inhabitants started growing again, increasing by 7.4 % since 2013. A pandemic-related drop in 2020 did not reverse the growing trend, and in absolute terms, final users in the EU consumed 6.67 billion tonnes of raw material (in raw material equivalents) in 2022, which translates into a per-capita material footprint of 14.9 tonnes. The increase in the EU’s material consumption over the past decade suggests further efforts might be required to meet the objectives of the European Green Deal, which calls for a reduction in environmental pressures alongside economic growth (also see the article on spillover effects).
The EU’s consumption footprint considerably transgresses planetary boundaries
The consumption footprint, based on a basket of products in five consumption areas, shows that EU consumption patterns considerably transgress several planetary boundaries, emphasising the need for further efforts to reduce consumption and achieve the EU’s policy goals. Overall, the EU’s consumption footprint transgressed planetary boundaries by 3.4 times in 2022, which is a 0.9 % increase since 2017 and a 6.0 % increase since 2010. The 2022 value also constitutes a new record high and indicates that the environmental impact of the EU’s consumption of goods — both within the EU and abroad — remains too high. The EU’s transgression of planetary boundaries was particularly high for the impacts on climate change (by 8.2 times), particulate matter pollution (by 9.5 times) and freshwater ecotoxicity (by 10.5 times) [1]. Data per inhabitant show that Luxembourg, Denmark and Malta had the highest consumption footprint in 2022, whereas Romania, Slovakia, Bulgaria and Hungary had the lowest.
More than half of fossil energy carriers and metal ores used in the EU are imported
Material import dependency captures the extent to which an economy relies on imports to meet its material needs. Material import dependency is calculated as the ratio of imports to direct material input (DMI), which is the sum of imports and domestic extraction. In 2022, imports accounted for 22.4 % of the EU’s DMI. Import dependency was highest for fossil energy carriers, at 69.7 % in 2022, followed by metal ores at 51.5 %. The EU’s import dependency on fossil energy carriers has increased by about 10 percentage points over the past decade (up from around 60 %), while dependency on metal ore imports has remained stable. In contrast, the EU is almost completely self-sufficient for non-metallic minerals, with an import dependency of only 3.0 % in 2022 [2].
The EU’s self-sufficiency is especially relevant for critical raw materials (CRMs), which are raw materials of high importance to the EU economy and with a high supply risk. To address the challenge of ensuring reliable and unhindered access to certain raw materials, the European Commission presents a list of critical raw materials that is reviewed every three years. The CRM list from 2023 contains 34 materials; data on the EU’s self-sufficiency are available for eight of them. They show that in 2022, the EU’s self-sufficiency was highest for vanadium (100 %), copper (52 %) and fluorspar (40 %). However, the EU economy was (almost) completely dependent on imports for borate (0 % self-sufficiency), cobalt (1 %) and tantalum (1 %) [3]. To ensure access to a secure and sustainable supply of the critical raw materials needed for the EU to meet its 2030 climate and digital objectives, the Commission has proposed a Critical Raw Materials (CRM) Act. This would set benchmarks for domestic capacities, such as for extraction or recycling, to be met by 2030.
Resource and energy productivity have increased in the EU over the five-year period assessed
Resource productivity [4] monitors how much output an economy produces per unit of materials used and can provide insights into whether decoupling between the use of natural resources and economic growth is taking place. It is measured as the ratio of gross domestic product (GDP) to domestic material consumption (DMC). Between 2017 and 2022, the EU economy (in terms of GDP) grew by 7.5 %, while DMC grew at a slower pace, by 3.0 % over the same period. This resulted in a 4.0 % increase in the EU’s resource productivity, from EUR 2.04 per kg of DMC in 2017 to EUR 2.13 per kg in 2022 [5].
Like resource productivity, energy productivity [6] measures economic output (in terms of GDP) per unit of energy used. Observed trends for energy productivity are stronger than for resource productivity, due to larger decreases in energy consumption than in material use. Between 2017 and 2022, the EU increased its energy productivity by 17.8 %, from EUR 7.9 per kg of oil equivalent (kgoe) to 9.3 EUR per kgoe. Over the same period, economic growth of 7.5 % in the EU was accompanied by an 8.8 % reduction in gross available energy (GAE) [7]. A particularly strong growth in the EU’s energy productivity, by 8.4 % on the previous year, occurred in 2022 due to the 3.4 % increase in GDP and a simultaneous 4.5 % reduction in GAE.
Consumption of hazardous chemicals dropped by 12.1 % in 2022
Most everyday products used by businesses and consumers are produced with the help of chemicals. This makes them a significant contributor to the EU economy, with chemical sales worth EUR 760 billion in 2022 [8]. The consumption of chemicals provides benefits to society but can also entail environmental and health risks. The level of risk depends on both the hazardous properties of chemicals and the exposure to them. Tracking the consumption volumes of industrial (manufactured) chemicals that are hazardous to human and environmental health is, therefore, used as a proxy for human exposure [9].
In 2022, 196.7 million tonnes of hazardous chemicals were consumed in the EU, which was 22.6 % less than in 2007 and 10.8 % less than in 2017. Between 2016 and 2021, the consumption of toxic chemicals was on the rise, but a 12.1 % drop in 2022 reversed the trend. This resulted in an overall decline in the consumption of hazardous chemicals over the short term from 2017 to 2022.
Average CO2 emissions per km from new car fleets have fallen since 2017
Road transport was responsible for almost a quarter of the EU’s total greenhouse gas (GHG) emissions in 2022, and more than half of road transport emissions came from passenger cars[10]. To reduce those emissions, the EU has set targets for the fleet-wide average CO2 emissions of new passenger cars and vans, and new heavy duty vehicles registered in a given year. For each manufacturer’s new fleet, a binding specific emission target applies so that the overall target for the EU’s average fleet emissions will be met. For cars and vans, a manufacturer’s annual target is based on the average mass of its new vehicles registered in that year. For lorries the target is based on the vehicles’ mileage and payload. From 2035 onwards, all new cars and vans registered in the EU must be zero-emission vehicles[11].
Over the period 2017 to 2022, average CO2 emissions per km from new passenger cars registered in the EU fell by 23.2 %, reaching 109.8 g/km in 2022. This is still far from the EU targets of reducing these emissions to 93.6 g/km by 2025 and to 49.5 g/km by 2030 [12].
Accelerating the market uptake of new zero emission vehicles is a crucial step towards achieving the CO2 emission targets for new vehicles. In the EU, the share of zero-emission vehicles (including battery and fuel cell electric cars as well as hydrogen cars) in newly registered cars rose from 0.7 % in 2017 to 12.1 % in 2022. However, the share differs considerably between countries. Sweden reported the highest share with 32.9 % in 2022, followed by the Netherlands with 23.5 % and Denmark with 20.6 %. In contrast, zero-emission vehicles only accounted for around 2 % of newly registered passenger cars in Czechia and Slovakia [13].
Green economy
An economy is green when it is resource efficient, low in carbon emissions and socially just, contributing to the achievement of good life for all on a healthy planet. The EU is promoting the green economy through various policies such as the European Green Deal. The environmental goods and services sector (EGSS) produces the goods and services used in environmental protection and resource management activities, and thus helps to green the economy. Such goods and services can include, for example, products to prevent, measure, control, limit, minimise or correct environmental damage and resource depletion. Increasing the market share of green technologies in the EU can also have important socio-economic benefits in terms of value added and employment [14].
The environmental goods and services sector has grown faster than the overall economy
The gross value added in the EGSS in the EU has grown by 64.4 % over the 15-year period assessed, from EUR 193.0 billion in 2006 to EUR 317.3 billion in 2021 (all numbers here are given in 2010 chain-linked prices). Growth in the renewable energy and energy efficiency sectors, along with increased spending on green infrastructure, are among the main drivers of this development [15]. In relation to the whole economy, the EGSS grew — in gross value added terms — from 1.8 % of GDP in 2006 to 2.5 % in 2021. This indicates the sector grew disproportionally faster than other economic sectors. Notably, the sector's gross value added continued to grow in 2020 compared with the previous year, by 2.0 %, when the EU’s GDP fell by 5.6 % as a result of the COVID-19 pandemic [16]. Employment in the sector has also increased, in terms of full-time equivalent), by 42.2 % since 2006. In 2021, the sector provided 5.2 million full-time equivalent jobs throughout the EU [17].
Waste generation and management
Production and consumption patterns characterised by products being made, used and then disposed of are not sustainable. Therefore, the EU aims to move towards a circular economy where materials and resources are kept in the economy for as long as possible (through repair, recycling and reuse) and waste is minimised or even prevented. Because waste contains resources, recycling can put these materials back into the economy and ensure they are used again to preserve the value embedded within them.
Waste generation has fallen, but the EU is not on-track to meet its circular material use goal
In 2020, 2.2 billion tonnes of waste were generated in the EU by all economic activities and households, corresponding to 4 815 kilograms (kg) of waste per inhabitant. Almost two-thirds (64.0 % or 3.1 tonnes per inhabitant) of this waste was major mineral waste, including dredging spoils and contaminated soils that are mainly created in the mining and construction sectors [18]. Of the total waste, 4.4 % was hazardous to health or the environment, corresponding to 214 kg per resident in 2020. The total amount of waste generated in the EU fell by 4.6 % between 2016 and 2020, likely as a result of the pandemic-related economic slowdown in 2020. This translates into a 5.1 % reduction of waste generated per EU inhabitant between 2016 and 2020.
Total waste excluding major mineral waste constituted one-third (36 %) or 776 million tonnes of total waste generated in the EU in 2020. From this amount, 212 million tonnes were recorded for waste and water services, followed by households (196 million tonnes) and manufacturing activities (167 million tonnes). In 2020, food waste accounted for 58 million tonnes in the EU. More than half (54 %) of food waste was generated by household activities, followed by manufacture of food products and beverages (21 %) and primary production of food (9 %) [19].
When not managed sustainably, all of this waste has a huge impact on the environment, causing pollution and greenhouse gas emissions, and significantly lowering the efficiency materials use [20]. Recycling waste and feeding it back into the economy as secondary raw materials is crucial for reducing the EU’s demand for primary raw materials and relies heavily on improved waste management systems [21]. Between 2007 and 2022, the EU circular material use (CMU) rate — the share of used materials derived from collected waste — increased from 8.9 % to 11.5 %. Since 2016, however, the CMU rate has stagnated at between 11.3 % and 11.6 %, meaning the EU will need to make stronger progress in the next few years to meet its goal of doubling the materials it uses from collected waste by 2030 to 23.2 %.
Data for the recycling of waste excluding major mineral wastes show that 58 % of EU waste was recycled in 2020 [22]. The difference between this relatively high end-of-life recycling rate and the CMU rate (11.5 % in 2022) may seem surprising. However, the comparatively low degree of circularity in the EU can be attributed to three structural barriers. First, a large fraction of the materials extracted, in particular minerals, is used to build and maintain buildings, infrastructure and other long-life goods and is not readily available for recycling. The second barrier is the large amount of materials used to generate energy. For these materials, in particular for fossil fuels, closing the loop is hardly possible and the high share of these materials keeps the degree of circularity low [23]. Another barrier is that in many cases, despite the relatively high recycling rate, secondary (recycled) raw materials often are not of sufficient quality to be used in new products (for example, in construction products, packaging or transport) and therefore lack market demand. In other words, there is a gap between the supply of recycled materials and demand for quality secondary material as input.
Main indicators
Material footprint

The material footprint, also referred to as raw material consumption (RMC), represents the global demand for the extraction of materials (minerals, metal ore, biomass and fossil energy materials) induced by consumption of goods and services within a geographical reference area. Data for material footprints stem from material flow accounts, which model the flows of natural resources from the environment into the economy. They include domestic extraction of materials measured in tonnes of gross material (for example, gross ore or gross harvest) as well as imports and exports measured by estimates of the raw material equivalents of the products traded (domestic and abroad extraction required to produce the traded products). RMC thus measures the amount of extraction needed to produce the goods demanded by final users in the geographical reference area, irrespective of where in the world the material extraction took place.
.png)
Source: Eurostat (online data codes: (sdg_12_21) and (env_ac_rme))
.png)
Source: Eurostat (sdg_12_21)
Consumption footprint

The consumption footprint is a set of 16 life cycle assessment (LCA)-based indicators to assess the environmental impacts of EU and its Member States consumption by combining data on consumption intensity and environmental impacts of representative products [24]. It is based on the combination of: (a) the emissions to air, soil and water, as well as the resources used along the life cycle of around 165 representative products, belonging to five areas of consumption (food, mobility, housing, household goods, and appliances), (b) the consumption intensities of those products, which are calculated based on consumption statistics, and (c) the Environmental Footprint (EF) impact assessment method, which translates emissions and resource consumption into 16 potential environmental impacts that can be aggregated into a single score. The EF impact indicators can be compared with a set of thresholds based on the Planetary Boundaries framework [25].

Note: y-axis does not start at 0.
Source: Eurostat (online data code: (sdg_12_31))

Source: Eurostat (sdg_12_31)
Consumption of hazardous chemicals

This indicator measures the consumption of toxic chemicals, expressed in million tonnes. The consumption of chemicals is calculated as the sum of the production volumes and the net import volumes of the chemicals according to the equation: consumption = production + imports – exports. The two sub-categories of hazardous chemicals — hazardous to human health and hazardous to the environment — overlap by definition and as a result their sum is not equal to the total consumption of hazardous chemicals.

Source: Eurostat (sdg_12_10)
Gross value added in the environmental goods and services sector

The environmental goods and services sector (EGSS) is defined as that part of a country’s economy that is engaged in producing the goods and services used in environmental protection and resource management activities either domestically or abroad. Gross value added in EGSS represents the contribution of the environmental goods and services sector to (GDP) and is defined as the difference between the value of the sector’s output and intermediate consumption.

Note: y-axis does not start at 0.
Source: Eurostat (online data codes (sdg_12_61) and (nama_10_gdp))

Source: Eurostat (sdg_12_61)
Circular material use rate

The circular material use rate (CMU) measures the share of material recovered and fed back into the economy in overall material use. The CMU is defined as the ratio of the circular use of materials to the overall material use. The overall material use is measured by summing up the aggregate domestic material consumption (DMC) and the circular use of materials. DMC is defined in economy-wide material flow accounts. The circular use of materials is approximated by the amount of waste recycled in domestic recovery plants minus imported waste destined for recovery plus exported waste destined for recovery abroad. A higher CMU rate value means more secondary materials are being substituted for primary raw materials, thus reducing the environmental impacts of extracting primary material.

Source: Eurostat (sdg_12_41)

Source: Eurostat (sdg_12_41)
Generation of waste

This indicator is defined as all waste generated in a country. It covers waste generated by industrial production (including the waste management sector itself) and by households. Major mineral wastes, dredging spoils and soils are included. This leads to high quantities of waste in some countries with substantial economic activities such as mining and construction.

Source: Eurostat (sdg_12_51)

Source: Eurostat (sdg_12_51)
Direct access to
More detailed information on EU SDG indicators for monitoring of progress towards the UN Sustainable Development Goals (SDGs), such as indicator relevance, definitions, methodological notes, background and potential linkages can be found in the introduction as well as in Annex II of the publication ’Sustainable development in the European Union — Monitoring report on progress towards the SDGs in an EU context — 2024 edition’.
Further reading on responsible consumption and production
- EEA (2023), The European biomass puzzle: Challenges, opportunities and trade-offs around biomass production and use in the EU, EEA Report No 8/2023, European Environment Agency, Copenhagen.
- EEA (2019), The European environment — state and outlook 2020. Chapter 9 – Waste and resources in a circular economy, European Environment Agency, Copenhagen.
- EEA (2024), Accelerating the circular economy in Europe: State and outlook 2024, EEA Report 13/2023, European Environment Agency, Copenhagen.
- EEA (2019), Preventing Plastic Waste in Europe, EEA Report No 2/2019, European Environment Agency, Copenhagen.
- EEA (2024), Management of used and waste textiles in Europe’s circular economy.
- EEA (2023), Pathways to circular plastics in Europe: Good examples from countries, business and citizens.
- EEA (2024), Capturing the climate change mitigation benefits of circular economy and waste sector policies and measures.
- EEA (2023), Many EU Member States not on track to meet recycling targets for municipal waste and packaging waste.
- Circle Economy (2022), The Circularity Gap Report 2022, Circle Economy, Amsterdam.
- Sala, S., Crenna, E., Secchi, M., Sanyé-Mengual, E. (2020), Environmental sustainability of European production and consumption assessed against planetary boundaries, Journal of Environmental Management, 269, 110686.
- UNEP (2020), Resource Efficiency and Climate Change. Material Efficiency Strategies for a Low-Carbon Future, A report of the International Resource Panel, United Nations Environment Programme, Nairobi, Kenya.
- United Nations Environment Programme (2019), Global Chemicals Outlook II. From Legacies to Innovative Solutions: Implementing the 2030 Agenda for Sustainable Development.
Further data sources on responsible consumption and production
- European Automobile Manufacturers Association, Interactive map: Affordability of electric cars, correlation between market uptake and GDP in the EU.
- European Commission, Raw Materials Information System (RMIS).
- Eurostat, Monitoring Framework for the Circular Economy.
- UNEP/IRP, Global Material Flows Database.
Notes
- ↑ Source: JRC (cei_gsr010)
- ↑ Source: Eurostat (env_ac_mid)
- ↑ Source: Eurostat (online data code: (cei_gsr020)). Copper does not meet the CRM threshold but is included on the CRM list as strategic raw material in line with the Critical Raw Materials Act.
- ↑ Resource productivity is defined as GDP per unit of domestic material consumption (DMC), measured in EUR per kilogram. Part of these materials is directly consumed by households, which means they are not used as an input to production activities. Thus, resource productivity is not directly comparable to concepts such as labour or capital productivity.
- ↑ Source: Eurostat (online data codes: (env_ac_rp), (env_ac_mfa)and (nama_10_gdp)).
- ↑ Energy productivity is defined as GDP per unit of gross inland energy consumption, measured in EUR per kg of oil equivalent. Part of the energy considered is consumed by households, which means it is not used as an input to production activities. Thus, energy productivity is not directly comparable to concepts such as labour or capital productivity. Note that the indicator's inverse is energy intensity.
- ↑ Source: Eurostat (online data codes: (nama_10_gdp) and (nrg_bal_s)).
- ↑ The European Chemical Industry Council (2023), CEFIC Facts and Figures 2023.
- ↑ European Environment Agency (2019), Consumption of hazardous chemicals.
- ↑ Source: Eurostat (online data codes: (env_air_gge)).
- ↑ Please note that the EU targets also cover vehicles registered in Norway and Iceland, while those countries are not included in the emission values quoted, which relate to EU-27.
- ↑ European Commission (2023), Commission Implementing Decision (EU) 2023/1623 of 3 August 2023 specifying the values relating to the performance of manufacturers and pools of manufacturers of new passenger cars and new light commercial vehicles for the calendar year 2021 and the values to be used for the calculation of the specific emission targets from 2025 onwards.
- ↑ Source: Eurostat and European Alternative Fuels Observatory (online data code: (road_eqr_zevpc)).
- ↑ European Environment Agency (2019), Environmental Goods and Services Sector: employment and value added.
- ↑ Ibid.
- ↑ Source: Eurostat (online data code: (nama_10_gdp)).
- ↑ Source: Eurostat (env_ac_egss1).
- ↑ Source: Eurostat (online data code (env_wasgen)).
- ↑ Source: Eurostat (online data codes (env_wasgen) and (env_wasfw)).
- ↑ European Commission (2010), Being wise with waste: the EU’s approach to waste management, Publication Office of the European Union, Luxembourg.
- ↑ European Commission (2024), Circular economy.
- ↑ Source: Eurostat (env_wasoper)
- ↑ Haas, W., Krausmann, F., Wiedenhofer, D., Heinz, M. (2015), How Circular is the Global Economy?: An Assessment of Material Flows, Waste Production, and Recycling in the European Union and the World in 2005, Journal of Industrial Ecology, October 2015, Vol.19(5), 765-777.
- ↑ Sanye Mengual, E. and Sala, S. (2023), Consumption Footprint and Domestic Footprint: Assessing the environmental impacts of EU consumption and production, Publications Office of the European Union, Luxembourg.
- ↑ Sala, S., Crenna, E., Secchi, M., Sanyé-Mengual, E. (2020), Environmental sustainability of European production and consumption assessed against planetary boundaries, Journal of Environmental Management, Volume 269, 110686.