Climate change - driving forces
Based on data available in August 2024.
Planned article update: 1 September 2025.
Highlights
At EU level, all main source sectors, except transport, have reduced their greenhouse gas emissions compared with 1990.
Improved energy efficiency and changes in fuel mix are important drivers for reducing greenhouse gas emissions in the EU.
Source: EEA, republished by Eurostat (env_air_gge)
GHG emissions resulting from human activities cause anthropogenic climate change. The EU is an ambitious contributor to the global efforts to fight climate change and reduce GHG emissions and is committed to being climate neutral by 2050.
This article analyses major driving forces behind long-term trends of greenhouse gas (GHG) emissions in the European Union (EU) based on statistics available from Eurostat.
GHG emissions in the EU have decreased by 29.2% between 1990 and 2022 (the most recent reference year for which data officially reported to UNFCCC are available). Year 2020 had seen a special decline due to the COVID-19 pandemic. In 2021, GHG emissions increases back to the level of the long-term trend and continued on that trajectory in 2022. The main driving forces behind the long-term fall in total GHG emissions are improvements in energy efficiency and in the energy mix.
Full article
General overview
This statistical article is organised in the same order as the reporting on the main source sectors in the GHG emission inventories. First an overall picture is given, followed by sections presenting the GHG emissions of each specific source sector together with the developments for the underlying drivers. The aim is to help the reader understand which factors influence the development of GHG emissions.
The European statistical system (ESS) collects official statistics, some of which are used to estimate GHG emissions that are reported in GHG emission inventories. While national statistical institutes are usually not directly responsible for compiling GHG emission inventory data, they often support the compilation by providing auxiliary input data.
In the EU, GHG emission inventories of Member States are collected by the European Environment Agency (EEA) on behalf of the European Commission, more specifically the Directorate-General for Climate Action, in order to produce the EU GHG emission inventory. Eurostat contributes to the validation of the GHG emission inventories by providing energy statistics to the EEA. Eurostat also has a range of statistics that provide a solid basis for analysing the driving forces behind GHG emissions.
Total emissions, main breakdowns by source and general drivers

Source: EEA, republished by Eurostat (env_air_gge)
Figure 1 shows that overall, the EU's GHG emissions have followed a downward trend over the last three decades; in 2022 - the most recent year for which figures officially reported to the UNFCCC are available – total GHG emissions (excluding LULUCF - Land use, land use change and forestry - and memo items while including international aviation; see Figure 1) equaled 3.48 billion tonnes of CO2-equivalent compared with 4.92 billion tonnes in 1990, a decrease of 1.44 billion tonnes, or 29.2%. The net GHG emissions (including LULUCF, i.e. taking into account net-removals by ecosystems) amounted to 3.25 billion tonnes in 2022 compared with 4.70 billion tonnes CO2-equivalent in 1990 (-31.0%, see Figure 1). Due to the COVID-19 pandemic, emissions declined extraordinarily in 2020, after which they increased to the level of the long-term pre-pandemic trend in 2021. In 2022, they followed the long-term declining trend. Already in 2018 the EU surpassed its reduction target of 20% set for 2020 (see the line for Total and Target for 2020 in Figure 1). The target proposed for 2030, a reduction of GHG emissions by 55% compared with 1990 levels is for net GHG emissions, i.e. taking into account net removals in LULUCF (see the line for Net GHG emissions and Target for 2030 in Figure 1).
Source: EEA, republished by Eurostat (env_air_gge)
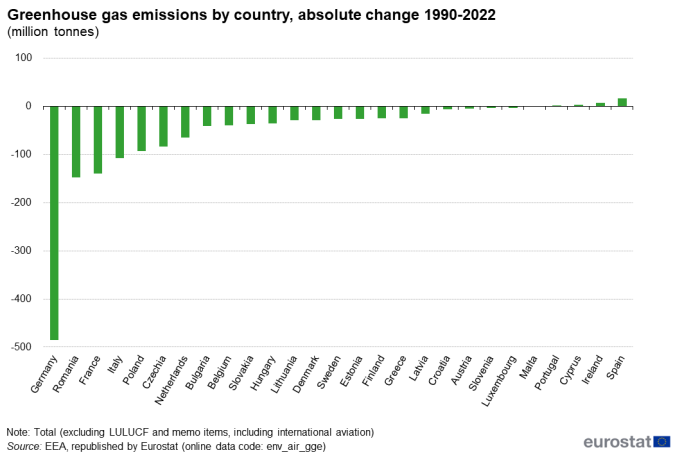
Figure 2 shows the absolute 1990-2022 change in GHG emissions by country. These absolute changes add up to the EU total reduction of 1.48 billion tonnes of CO2-equivalent. Note that the ranking would change to a large extent if the relative changes or changes in emissions per capita were compared. The rest of this Statistics Explained article will focus on the aggregate for the EU. More information for individual Member States can be retrieved from the Statistics Explained article 'Greenhouse gas emission statistics - emission inventories ' and the GHG inventory dataset in Eurostat's database.
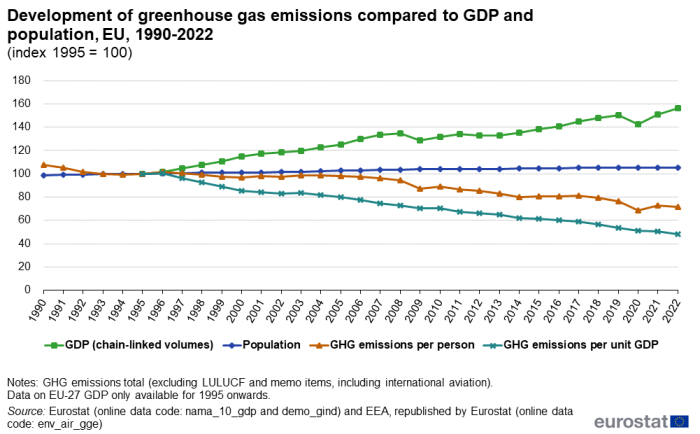
The greenhouse gas emissions reported in Figure 1 are all due to human activities. Therefore, one may think that more people would cause more GHG emissions. In addition, most of these human activities are economic activities, for example to produce and consume goods and services. Hence, one may also expect that more economic activity would produce more GHG emissions. The most general indicator for economic activity is gross domestic product (GDP).
Source: Eurostat (nama_10_gdp) (demo_gind) and EEA, republished by Eurostat (env_air_gge)
Figure 3 shows an upward trend for GDP (except for year 2020, due to the COVID-19 pandemic) and a less distinctive, but also upward trend for population. Over the last decades, the average annual growth rates for GDP and population are 1.7% and 0.2%, respectively. The GHG emissions per person in the EU have been declining, on average by -1.2% annually.
This implies that there must have been changes in how these human activities were carried out, so that even with almost continuous economic growth and increasing population, greenhouse gas emissions are being reduced.
Source: EEA, republished by Eurostat (env_air_gge)
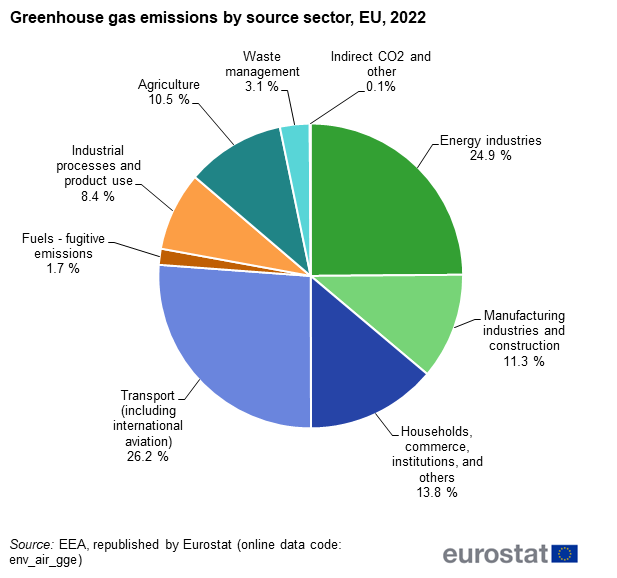
To understand better the driving forces behind the reduction in GHG emissions, we need to look in more detail at the sources of these GHG emissions and the underlying human activities. Figure 4 shows the GHG emissions broken down by source sectors as reported in UNFCCC GHG emission inventories. International aviation is included in all graphs and statistics presenting totals and GHG emissions from transport in this article, although it is officially reported as 'memo item' in the GHG emission inventories.
As shown in Figure 4, about three-quarters of the GHG emissions are due to fuel combustion. This includes fuel combustion to generate electricity and heat (energy industries), to manufacture goods and to construct buildings and infrastructure (manufacturing industries and construction), to heat buildings and water (households, commerce etc.), and to move freight and persons (transport). The remaining share of total GHG emissions, about one quarter, is due to other activities that mostly do not involve fuel combustion. These include industrial processes and product uses, agricultural activities, and waste management.
Source: EEA, republished by Eurostat (env_air_gge)
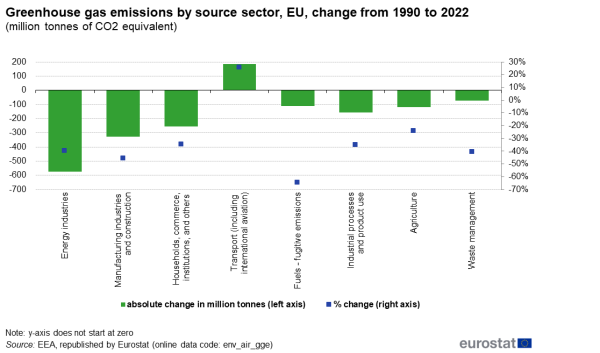
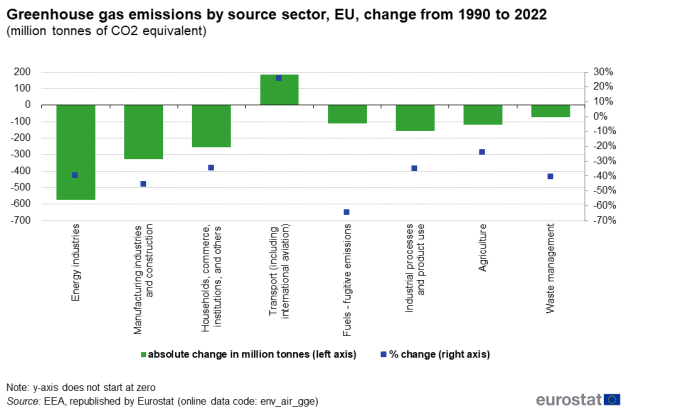
Overall, GHG emissions have been declining, and this holds for most source sectors (see Figure 5). However, there is one exception; GHG emissions from fuel combustion in transport, including international aviation, have increased, compared with 1990. The largest absolute decrease in emissions occurred in the fuel combustion of the energy sector, which was mainly linked to the generation of electricity and heat. An impressive reduction in both absolute and relative terms can be seen for fuel combustion in manufacturing industries and construction. The remainder of this article looks at the source sectors in more detail and explains what is behind these changes.
Fuel combustion
In 2022, GHG emissions from fuel combustion stood at 2 654 million tonnes; which was 973 million tonnes less than in 1990.
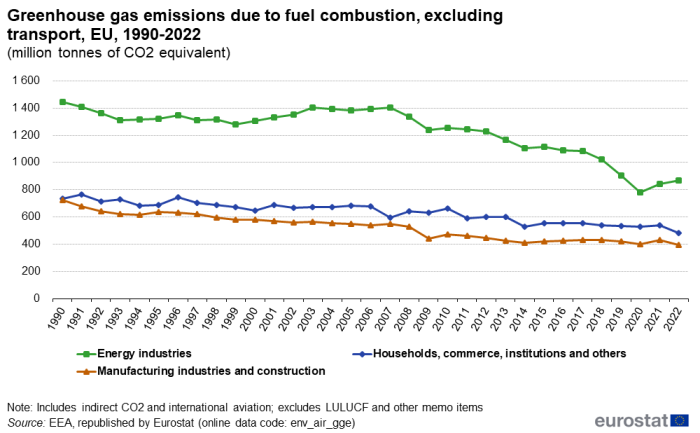
Fuel combustion is broken down into four sub-sectors, three of which are presented in Figure 6. Transport, the fourth sub-sector of fuel combustion is discussed further below.
Source: EEA, republished by Eurostat (env_air_gge)
Energy industries
Total GHG emissions of fuel combustion by the energy industries (public electricity and heat production, petroleum refining, and manufacturing of solid fuels) have fallen strongly from 1990 to 2022 by 576 million tonnes of CO2-equivalent or 40%. At the same time, the production of electricity and heat has increased by 12%. The driving force behind this positive development is the change in fuel mix in the energy sector. Emission-intensive solid and liquid fossil fuels have been replaced by renewable energy sources and natural gas. The latter does not produce as many emissions as the combustion of solid and liquid fossil fuels.
Source: Eurostat (nrg_bal_c)
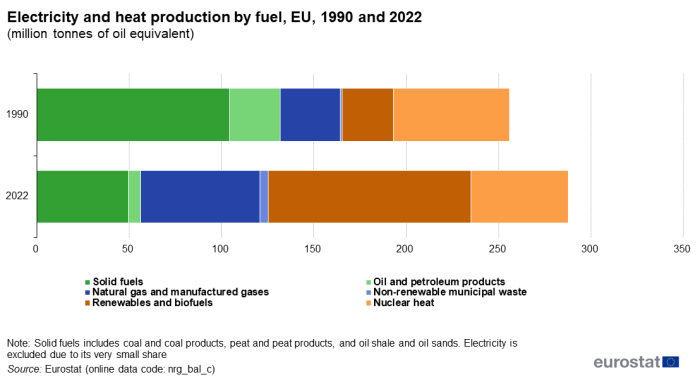
Of the GHG emissions from fuel combustion by energy industries, 85% is due to public electricity and heat production. Figure 7 compares the production of electricity and heat in 1990 with 2022 by type of fuel. The most remarkable finding is the increase by 12% of the total production of electricity and heat, from 256 to 288 million tonnes of oil equivalent (MTOE). However, the energy sources that have contributed most to this increase in absolute terms are renewable ones showing an increase of 82 MTOE, and gas of 32 MTOE.
Figure 7 also shows that the use of solid fuels and crude oil and petroleum products both decreased significantly from 1990 to 2022. These are both fuel types with high emission coefficients; in other words, fuel types that emit relatively large amounts of GHG when they are combusted.
Renewables can also replace fossil fuels indirectly by substituting electricity generated from fossil fuels with electricity generated from renewable energy sources. Examples are electric cars, electric cooking and electric heating, which do not combust fuels on the spot. Hence, electricity from renewable sources has a large potential to reduce GHG emissions from fuel combustion.
Source: Eurostat (nrg_bal_c)
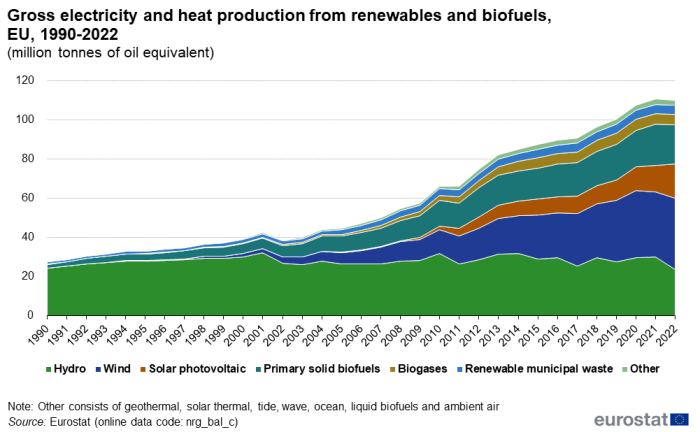
Figure 8 shows the relative contribution of renewables to the increase in electricity generated from this source in 1990-2022. From the first years of the millennium, electricity generated from renewable sources more than tripled. While hydro-electric power was almost completely responsible for all renewable electricity generated in 1990 with 88%, it generated only 22% of electricity in the EU in 2022. Wind power has clearly seen the largest overall increase with 36% of renewable energy generated by this source in 2022, whereas solar photovoltaic power is just catching up with the main renewable energy sources over the last few years, accounting for 18% in 2022.
Manufacturing industries and construction
Fuel combustion in manufacturing industries and construction is the source sector with the second largest reduction in GHG emissions between 1990 and 2022 by 329 million tonnes of CO2-equivalent (Figure 5). This drop in emissions is driven by an increase in energy efficiency, in other words producing more output with less energy, and a change in the fuel mix.
Figure 5 also shows that the reduction in GHG emissions by 46% in this source sector is the largest relative decrease among the fuel combustion source sectors. Figure 6 illustrates that this has been a steady path over the years, with small interruptions linked to the economic recession (2009) and the COVID-19 pandemic (2020).

Source: Eurostat (sts_inpr_a) (sts_copr_a)
This is in contrast to the production volume by manufacturing, which has increased over these years as shown in Figure 9. Manufacturing output has increased most years, with large drops only in 2009 as a result of the recession and recently due to COVID-19 pandemic. Construction output shows a different path, because the impact of the economic recession has led to a more prolonged reduction in construction output. The decrease in output lasted up to 2013 and has only slowly been increasing over the past few years before dropping gain due to COVID-19. Still, just prior to the recession, construction output was around 10% higher than in the nineties, without having a visible impact on the GHG emissions for these years. The years 2021-2022 show an increase in manufacturing and construction, signaling a recovery from the COVID-19 pandemic (see Figure 6).
Source: Eurostat (nrg_bal_c)
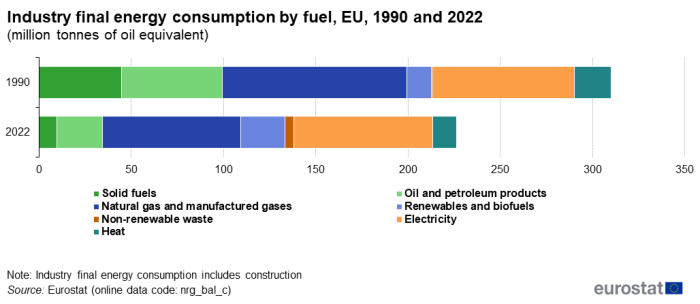
Although production output has increased in these industries, the GHG emissions have fallen and hence the GHG intensity of the activities has been reduced. The industries' final energy consumption composition in Figure 10 shows the two underlying drivers for the reduction in GHG emissions: energy efficiency and a change in the fuel mix. Energy efficiency has increased, because more is produced with less energy; from 1990 to 2022 the total final energy consumption by industry has fallen by 27%. In addition, the fuel mix has changed, although not as prominently as for electricity and heat generation. Still, the consumption of solid fuels and total petroleum products has more than halved over the years, whereas the use of renewable energy, including biofuels has increased by 85%. This implies less greenhouse gas emissions from fuel combustion per unit of final energy consumption.
Households, commerce, institutions and others
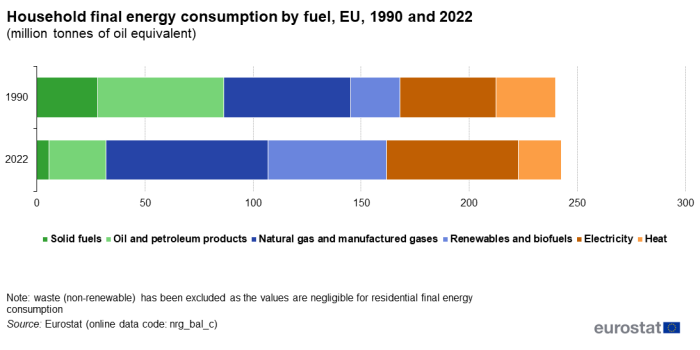
GHG emissions from fuel combustion by households, commerce, institutions and others arise mainly in connection to space heating and warm water. They contributed with a drop of 254 million tonnes of CO2-equivalent to the overall reductions of GHG emissions in 1990-2022 (see Figure 5) mainly due to a change in the fuel mix used, as shown in Figure 11.
Source: Eurostat (nrg_bal_c)
The relative drop in GHG emissions of 35% over 1990 to 2022 (Figure 5) follows from a relatively stable downward trend (Figure 6). Fuel combustion-born GHG emissions can be related to final energy consumption in households and commerce. Figure 11 shows associated changes in the final energy consumption of households between 1990 and 2022. Final energy consumption by households increased by 1% over this time period. In this case, the fuel mix change is the sole driver of the reduction of GHG emissions. The use of solid fuels and petroleum products decreased by 80% and 55%, respectively. Households now use substantially more renewables including biofuels (increase by 138%), natural gas (increase by 28%) and electrical energy (increase by 38%).
Transport-related emissions, including emissions from international aviation
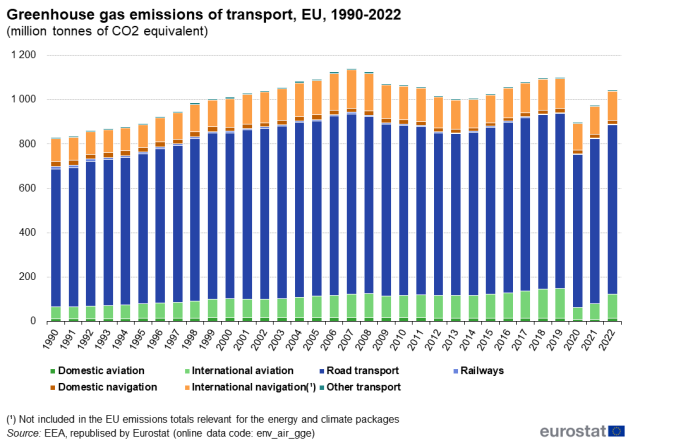
The transport sector, including international aviation (and including international navigation), is the only fuel combustion sub-sector, which shows an increase in GHG emissions over the last decades, as shown in Figure 5. Between 1990 and 2022, total GHG emissions increased by 26%, or 215 million tonnes of CO2-equivalent (see Figure 12). In 2020, GHG emissions from transport dropped by more than 200 million tonnes CO2-equivalent due to the COVID-19. By 2022, these emissions have returned back to pre-pandemic levels.
Source: EEA, republished by Eurostat (env_air_gge)
Figure 12 presents the development of GHG emissions by the transport sector over time in more detail. To provide a complete picture, this amount also includes international navigation, which constitutes 12-15% of the total GHG emissions of transport as reported here. Road transport is the largest contributor accounting for three quarters of the transport-related GHG emissions.
The development in GHG emissions correlates closely with overall transport activity, also referred to as transport performance or transport volume, measured in tonne-kilometres and passenger-kilometres, see Figure 13. Note that these statistics are currently only available up to 2021. Passenger transport has increased during most of the years until 2019, showing a steep decrease in 2020 due to the COVID-19 pandemic and a partial recovery in 2021. Freight transport shows the impact of the economic recession in 2009 and of the COVID-19 pandemic in 2020, and a complete recovery and exceedance of pre-pandemic levels in 2021. Transport performance statistics confirm that road transport is the most significant mode of transport: 87% of passenger transport performance and 54% of freight transport performance was due to road transport, if considering all types of transport modes (inland, air and maritime transport), in 2021.
The energy consumption in transport has increased in line with the increase in transport activity. Almost all fuel used in transport consists of petroleum products and there has only been a marginal shift towards renewables, so there has not been a significant favourable shift in the fuel mix as seen for the other sectors.[1]
To conclude this section on GHG emission from fuel combustion, energy mix changes seem to be the driving force behind the reduction in most fuel combustion sub-sectors. In particular the manufacturing and construction industries have managed to substantially increase their energy efficiency. The following sections describe the GHG emissions by source sectors other than fuel combustion.
Industrial processes and product use
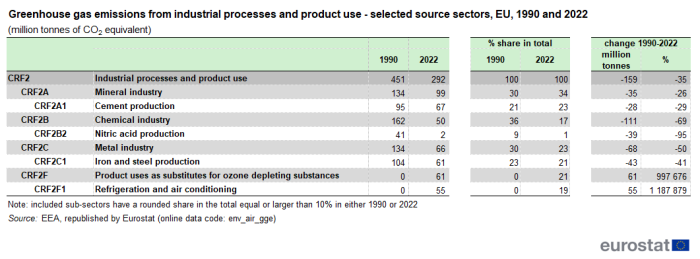
The source sector 'industrial processes and product use' is responsible for approximately 8% of total GHG emissions including international aviation (see Figure 4). Of the three non-energy source sectors, it has the largest absolute reduction in GHG emissions in 2022 compared with 1990, equal to 159 million tonnes of CO2-equivalent (see Figure 5). This source sector represents a wide range of production processes and economic activities across different industries (see Table 1). Notably, this source sector excludes GHG emissions from fuel combustion (see above).
Source: EEA, republished by Eurostat (env_air_gge)
To understand what drives the reduction in GHG emissions, it is useful to have a more detailed look at the sub-sectors with the largest shares. Table 1 shows a selected subset of the industrial processes and product use source sector. All production processes that traditionally had a large share in the total, namely mineral (cement, lime, glass), chemical and metal manufacturing, have managed to reduce their GHG emissions sizably. The GHG emissions from nitric acid production are even reduced to a small fraction of what they used to be.
The complete the overview, opposite trend is seen for sub-sector 'product uses as substitutes for ozone depleting substances' which mainly relates to the emissions of fluorinated gases (F-gases). Within this sub-sector, 'refrigeration and air conditioning' has by far the largest absolute increase with 55 million tonnes of CO2-equivalent. The demand for refrigeration and air conditioning is likely to increase in the future, so the GHG intensity of this source sector will need to be reduced.
Agricultural emissions
Out of the total GHG emissions in 2022, 10.5% were emitted by the agricultural source sector (see Figure 4). Over the time span 1990 to 2022, the source sector reduced its emissions by 117 million tonnes of CO2-equivalent, which corresponds to -24% compared with 1990 (see Figure 5). Figure 14 shows the GHG emissions in 1990 and 2021 for different agricultural activities.

Source: EEA, republished by Eurostat (env_air_gge)
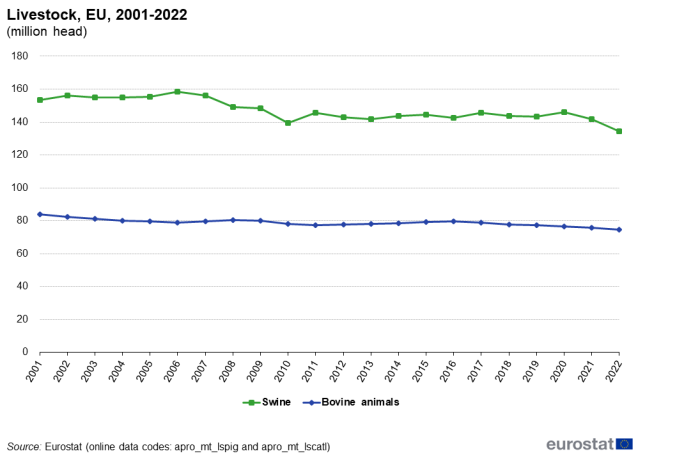
Emissions from enteric fermentation (methane), the fermentation of feed during the digestive processes of animals, were reduced by 56 million tonnes of CO2-equivalent or 24% of the 1990 GHG emissions. The largest share of the GHG emissions due to enteric fermentation, 86%, are from the digestive system of cattle. These emissions fell by 22% since 1990, but the decrease in GHG emissions primarily took place during the first decade. The emission reduction for the years 2001 to 2022 is equal to only 8%, whereas there was a 12% drop in the head count of bovine animals, which are reported under 'other livestock'.</ref>, which includes cattle, buffaloes and oxen (Figure 15). Note, data on bovine animals for the EU is not available for the years before 2001. However, based on what is available, the livestock data show a drop of around a quarter for the period 1990 to present.
Not all digestive systems produce as much methane as the digestive system of cattle. For example, the head count of swine in the EU is almost twice the head count of bovine animals, as shown in Figure 15. Still, the enteric fermentation of swine results in only 2%, of total GHG emissions of enteric fermentation.
Emissions from manure management fell by 18 million tonnes of CO2-equivalent or 22% (see Figure 14). GHG emissions from manure management are either estimated based on livestock statistics or manure management system usage data. They include methane emissions (two-thirds on average) and nitrous oxide emissions (one-third on average).
Emissions from waste
Emissions from waste have fallen mainly due to a reduction in GHG emissions from solid waste disposal following a reduction in the amount of landfilling; i.e. the deposit of waste into or onto land. Decomposition of the organic fraction of waste in absence or at low levels of oxygen leads to methane emissions. Such conditions are present in landfills.
In 2022, the share of waste management in total GHG emissions was just 3.1% (see Figure 4). GHG emissions from waste management have been reduced by 75 million tonnes of CO2-equivalent. Although in absolute terms this source sector has the smallest reduction in GHG emissions, it managed to reduce its emissions by 41% since 1990.

Source: EEA, republished by Eurostat (env_air_gge)
Figure 16 shows that waste management emissions remained relatively stable in the first half of the 1990s. Since the second half of the 1990s, GHG emissions started to decrease and have continued to do so in a very stable way until the first half of the 2010s, after which the decrease has slowed down. In absolute terms, the decrease was largest for solid waste disposal with 60 million tonnes or 44%. Waste water treatment reduced its GHG emissions by 45%, but due to the smaller share in the total, this only amounts to 19 million tonnes.
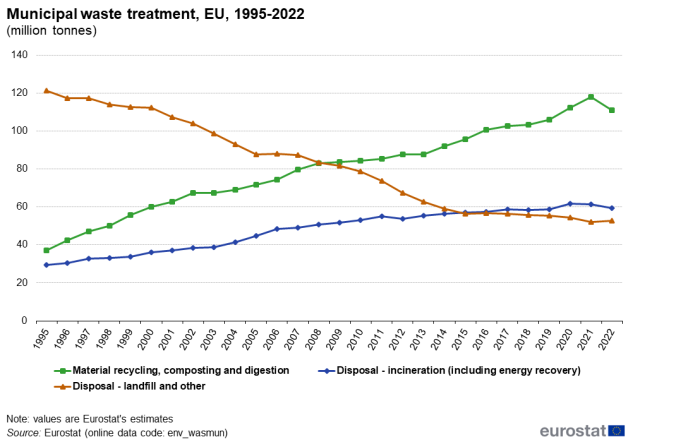
Figure 17 shows statistics from municipal waste treatment that give more background on the apparently steady fall of GHG emissions from waste management.
Waste landfilling was reduced by 56% in 1995-2022. There are two main reasons for this reduction. First, the recycling and composting of solid waste is now close to three times its 1995 value. Given that 1) our economy is growing and needs materials to produce goods and services, 2) material resources are not unlimited and 3) the use of primary materials needs to be reduced, recycling has become more and more important. Second, total incineration with energy recovery has increased. This seems counterfactual to the fact that reported GHG emissions from incineration have decreased. However, GHG emissions from incineration with energy recovery are not recorded in the waste source sector of the GHG emission inventories, but in the energy source sector. In addition, carbon dioxide emissions from burning biomass are only included as a memo item in the GHG emission inventories and are not included in the total value of GHG emissions reported. Figure 7 shows that waste used as a fuel to produce electricity and heat has more than tripled over 1990-2022.
The strong reduction in landfilling as a treatment of waste is a combined result of the Waste Framework Directive (Directive 2008/98/EC) and the Landfill Directive (Council Directive 1999/31/EC). The Waste Framework Directive sets out a waste hierarchy in waste prevention and management, legislation and policy. Waste disposal is last on the list. The objective of the Landfill Directive is to prevent or reduce, as far as possible, the negative effects on the environment and risks to human health from the landfilling of waste. The Circular Economy Package came into effect in 2019. These Directives aim to further increase re-use and recycling and limit disposal such as landfilling.
Land use, land use change and forestry (LULUCF) is an overall sink of emissions
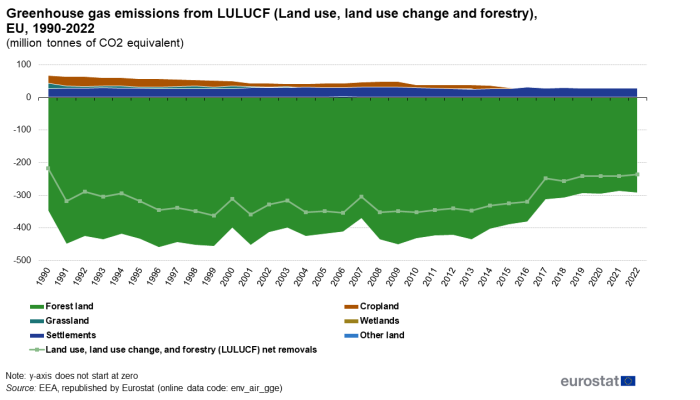
In addition to the sources of GHG emissions represented in Figure 4 and Figure 5, GHG emission inventories also include a source sector that is, overall, a sink of GHG emissions. This means that the GHG emissions recorded for this source sector are negative, because represent a removal of GHG from the atmosphere. This source sector is called land use, land use change and forestry, abbreviated as LULUCF. Depending on the context and purpose, emissions from LULUCF are either included in, or excluded from, reported total GHG emissions (therefore Figure 1 shows two totals). On average, taking LULUCF into account reduces total GHG emissions by 6-7%.
Previously, LULUCF was excluded from the EU climate target (e.g. the 20% reduction by 2020). The 2030 Target Plan fully integrates the LULUCF sector's emissions and removals into the proposed 2030 EU greenhouse gas target of -55% (Article 4(1) of Regulation (EU) 2021/1119 establishing the framework for achieving climate neutrality and amending Regulations (EC) No 401/2009 and (EU) 2018/1999 ('European Climate Law')).
Source: EEA, republished by Eurostat (env_air_gge)
Figure 18 shows the sources and sinks of GHG in the LULUCF sector, by type of land use. Land-use types with positive values of GHG emissions, such as Grassland or Cropland, represent sources of GHG. The only actual sink of GHG emissions in the EU GHG emission inventory is Forest land. The sum for all land-use types is represented by the net removals of GHG emissions from total LULUCF. Hence, forests play an important role in the mitigation (in other words reduction) of GHG emissions. Harvested wood products are a sink of GHG emissions. Grassland and wetlands, if left undisturbed, can also become a sink.
The EU forest strategy for 2030 sets out how to protect and restore forests in the European Union, to ensure they continue to deliver their many services on which society depends. The Commission published a biodiversity strategy for 2030 as part of the European Green Deal, with the aim to put EU biodiversity on the path to recovery by 2030. The EU Nature restoration law, aiming to help combat climate change, was adopted in 2024. It calls for binding targets to restore degraded ecosystems, in particular those with the most potential to capture and store carbon, and prevent and reduce the impact of natural disasters.
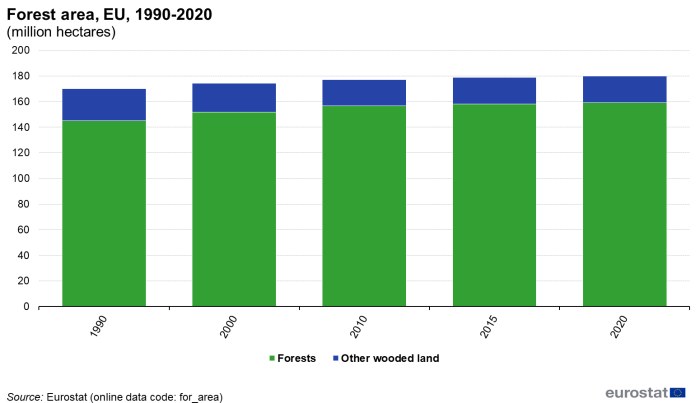
Forestry statistics show indeed that the total forest area within the EU has increased from 1990 to 2020, see Figure 19. Other wooded land has slightly decreased over the years, but overall the trend is still positive for the sum of both categories.
GHG intensities of economic activities
The GHG emission intensity of the total economy, expressed as the amount of GHG emissions in grams of CO2-equivalents per euro of value added in the EU, has decreased by 34.1%, when comparing 2022 with 2008 (Table 2).
Estimating the emission intensities of economic activities requires data on emissions that are conceptually aligned to national accounts data. GHG emission inventories are the primary reporting format for GHG emissions, but the inventory source sectors cannot be matched one-to-one with economic activities (industries) as recorded in national accounts. The scope of each of the source sectors in the GHG emission inventories is defined in a way that best fits the underlying technical processes that result in GHG emissions, but not necessarily the economic classification.
Within the System of Environmental-Economic Accounting (SEEA), air emissions are recorded in accounts that apply the same accounting concepts, structures, rules and principles as the System of National Accounts.[2] These air emissions accounts are consistent with national accounts, including the break-down by economic activity according to the NACE Rev.2 classification. Air emissions accounts also enable the analysis of changes in economic structure and the effect on GHG emissions.
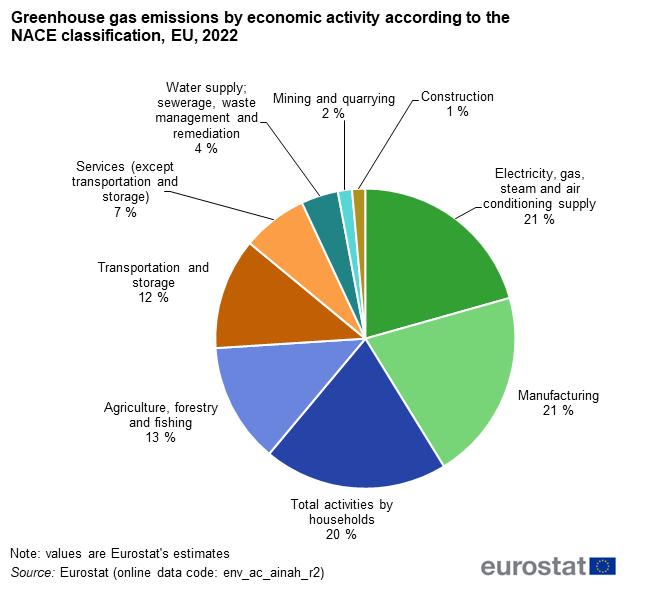
Source: Eurostat (env_ac_ainah_r2)
The shares of GHG emissions by economic activity are presented in Figure 20. In the air emissions accounts, emissions are assigned to the economic activities for which the GHG are emitted. For example, emissions reported as transportation in the GHG emission inventories are partly assigned to households and other economic activities that operate their own transport fleet. The Statistics Explained article 'Greenhouse gas emission statistics - air emissions accounts' showcases the air emissions accounts in more detail.
By combining information from air emissions accounts and national accounts, GHG emission intensities of economy activities can be calculated. Emission intensities express how many GHG emissions are produced per unit of output or value added of the economic activity.
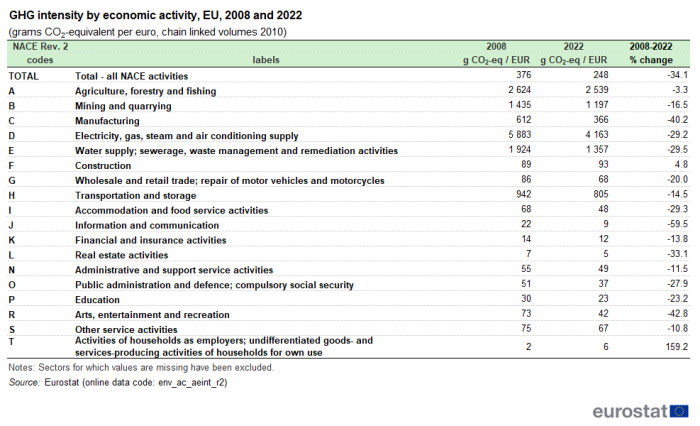
Source: Eurostat (env_ac_aeint_r2)
Table 2 shows the GHG emissions in grams of CO2-equivalents emitted for each euro of value added generated by the different economic production activities in more detail. Electricity, gas, steam and air conditioning supply shows by far the largest amount of GHG emitted per euro of value added. Other production activities with high GHG intensities are agriculture, forestry and fishing; water supply, sewerage, waste management and remediation activities; and mining and quarrying. Service production activities emit much less GHG per euro of value added. In general, economic structural changes towards a bigger service sector implies fewer GHG emissions.
Source data for tables and graphs
Data sources
GHG emission inventories are taken from Eurostat's dataset Greenhouse gas emissions by source sector (env_air_gge). This dataset is originally produced and published by the European Environment Agency (EEA). The EEA GHG emission inventory data are accessible through the EEA greenhouse gas data viewer.
The Directorate-General for Climate Action of the European Commission has an overall responsibility for the GHG emission inventory of the EU and the reporting to the United Nations Framework Convention on Climate Change (UNFCCC). The EEA is responsible for the preparation of the EU's GHG emission inventory and the quality assurance and quality control (QA/QC) procedures on the GHG emission inventories reported by EU Member States, the United Kingdom and Iceland. Each Member State compiles its national inventory and submits it to both the UNFCCC and to the EEA. Eurostat collects national energy statistics reported under the EU Energy Statistics Regulation and is responsible for supplying the energy data for the IPCC reference approach for CO2 emissions from fossil fuel combustion. This is a key verification procedure of the energy data reported in the EU GHG emission inventory. The Joint Research Centre is responsible for the QA/QC of the LULUCF and agriculture source sectors in the EU's GHG emission inventory.
Data on transport performance are from the EU transport in figures Statistical Pocketbook of the Directorate-General for Mobility and Transport, which includes data from Eurostat, other sources and own estimates.
All other statistics are from Eurostat and accessible through Eurostat's online database. Each dataset can be identified an online data code reported as the source below the figure or table.
Direct hyperlinks to each Eurostat dataset, for the selection of variables and lay-out of dimensions used for this article are included in the attached Excel file (see above).
Definition and coverage
Greenhouse gas emissions include emissions of carbon dioxide (CO2), methane (CH4), nitrous oxide (N2O) and several fluorinated gases: sulphur hexafluoride (SF6), nitrogen trifluoride (NF3), hydrofluorocarbons (HFCs), and perfluorocarbons (PFCs). Carbon dioxide represents 82% of total GHG emissions in 2022, as shown in Figure 21, and its share increased two percentage points from 1990 to 2022.
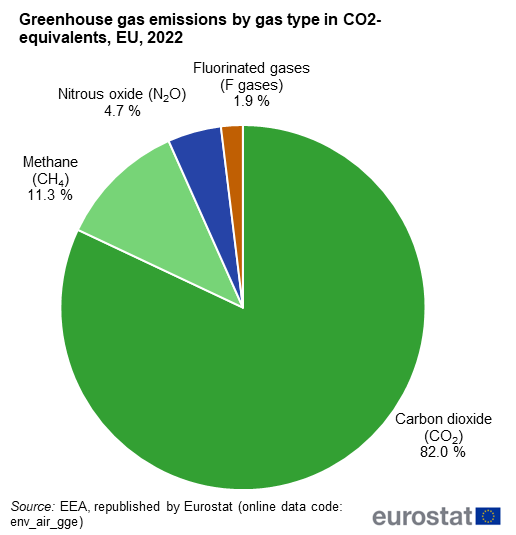
Source: EEA, republished by Eurostat (env_air_gge)
To be able to compare and add up the GHG emissions together, each GHG is expressed in CO2- equivalent based on its global warming potential (GWP) relative to carbon dioxide. For example, methane absorbs 28 times more thermal infrared radiation than carbon dioxide and is therefore 28 times more potent as a greenhouse gas than carbon dioxide. To calculate methane emissions in CO2-equivalent, the amount of methane is multiplied by its GWP value of 28. The relative composition shown in Figure 21 takes the GWP of GHG into account. Note that these GWPs are updated when new information on the energy absorption or lifetime of the gases becomes available from research. Currently, the GWP values used to compile GHG emission inventories in Europe are based on the IPCC's Fifth Assessment Report.[3].
All GHG totals in this article include indirect CO2 emissions. Carbon dioxide emissions from the burning of biomass are recorded as 'memorandum item (memo item)' in GHG emission inventories and are also not included in the various totals. By contrast, all GHG totals, and the figures on transport, include international aviation, although it is officially reported as memo item in the GHG emission inventories. All other memo items (transport and storage of CO2, international navigation, and multilateral operations) are excluded.
Although GHG emission inventories and air emissions accounts both report GHG emissions, there are differences in definition and scope that result in differences in the reported values both at the total level and for individual components. The table below lists the main differences between GHG emission inventories and air emissions accounts. Data from the latter have been used to compile GHG emissions by economic activity (Figure 20) and GHG intensities (Table 2).
| National inventories for greenhouse gases and other air pollutants | Air emissions accounts |
|---|---|
| Emissions are assigned to the country where the emission takes place (territory principle). | Emissions are assigned to the country where the company causing the emission is based (residence principle as used in the system of national accounts). |
| Emissions are assigned to technical processes (e.g. combustion in power plants, solvent use). | Emissions are classified by economic activity (using the NACE classification as used in the system of national accounts). |
| Emissions from international shipping and aviation are assigned to the countries where the associated fuel is purchased regardless of where the purchasing company is based. | Emissions from international shipping and aviation are assigned to the countries where the airline/shipping company is based, regardless of where the emission takes place. |
Note: National and EU totals differ between the two approaches, as different boundaries apply. GHG emission inventories include international aviation and maritime transport (international bunker fuels) as memorandum items, which means that they are excluded from national totals reported. However, they are included in air emissions accounts totals. Therefore total emissions reported in GHG emission inventory databases can differ significantly from the total reported in air emissions accounts for countries with a large international aircraft and/or shipping fleet, but data can be reconciled using bridging tables.
Source: dedicated section on climate change related statistics
Significant differences between the totals for GHG emission inventories and air emissions accounts may occur in certain countries where very large resident businesses engage in international water- and air transport services. For instance, in Denmark, carbon dioxide emissions reported in the accounts are more than 2 times the amount of emissions reported in GHG inventories. This difference is due to a very large Danish shipping company, which operates vessels worldwide, and hence bunkers most of its fuel and emits most of its emissions outside Denmark. These emissions abroad are not accounted for in the Danish GHG emission inventory, but they are included in the air emissions accounts. For the EU as a whole, the differences between totals from the GHG emission inventories and the air emissions accounts are much less pronounced.
More detail on the definition and scope of the statistics reported on in this article can be found in the metadata accompanying the respective datasets.
Context
Climate change as a result of human activities is a major threat to society due to the wide-ranging impacts on ecosystems, the economy, human health and wellbeing. It is a problem of common concern and requires a global response. The European Commission aims to address the causes and consequences of climate change through policies and by being an ambitious partner in the international negotiations. To monitor the progress in reducing GHG emissions and trends of climate change drivers, the impact and the adaptation to climate change, high quality data are essential.
EU policy context
The EU's progress on greenhouse gas (GHG) emission reduction is evaluated against targets set in its political commitments. The EU succeeded in reducing its GHG emissions beyond the amounts agreed on in the first commitment period (2008-2012) of the Kyoto Protocol. The target set for 2020 in the 2020 climate & energy package, a 20% reduction of GHG emissions compared with 1990, was also met. The EU is working towards cutting 55% of its emissions in 2030 compared with 1990, as target set in the 2030 climate & energy framework and in accordance with the EU's commitment to the Paris agreement. By 2050 the EU aims to be climate neutral.[4]
The two main instruments to achieve the EU GHG targets are the EU Emissions Trading System (EU ETS) and the Effort Sharing Regulation. The EU ETS is a market for trading carbon that works on the basis of a cap set on the amount of GHG emissions that can be emitted by installations covered by the system. Within the cap, companies receive or buy emission allowances. If a company produces less GHG emissions than it has allowances for, it can sell these to a company that needs more. The market forces of supply and demand, and the resulting prices help ensure that the lowest-cost solutions for reducing GHG emissions are implemented. The Effort Sharing Regulation covers emissions from most source sectors not included in the EU ETS and establishes binding annual GHG emission targets for EU Member States for these source sectors.
For the commitment period from 2021-2030, two new Regulations have been adopted; the Regulation on binding annual GHG emission targets by Member States for 2021-2030 for the sectors not regulated under the EU ETS, such as transport, agriculture and waste, and the Regulation on the inclusion of greenhouse gas emissions and removals from land use, land use change and forestry in the 2030 climate and energy framework. The second Regulation includes binding commitments for each Member State to ensure that accounted emissions from land use are entirely compensated by an equivalent removal of CO₂ from the atmosphere through action in the sector. It also specifies the accounting rules to determine compliance. Also, the burning of biomass will count towards the 2030 commitments of each Member State. To address the GHG emissions from transport, the Commission has put together a strategy on low-emission mobility to increase the use of low and zero-emission vehicles and alternative low-emission fuels.
Predictions and modes suggest that EU Members States are likely to face severe challenges such as heat extremes, water scarcity, forest fires, sea level rise, storm surges, floods and landslides as a result of climate change. As a results, in 2021, the EU adopted the its new EU Adaptation Strategy to enhance preparedness and resilience in Europe. Complementing the activities of Member States, the strategy supports action by promoting greater coordination and information-sharing between Member States, and by ensuring that adaptation considerations are addressed in all relevant EU policies.
In July 2021, the European Commission adopted a series of legislative proposals setting out how it intends to achieve climate neutrality in the EU by 2050, including the intermediate target of an at least 55% net reduction in greenhouse gas emissions by 2030.
EU contribution to the global policy context
The EU is an ambitious contributor to the global efforts to fight climate change and reduce GHG emissions. The fight against climate change at global level is governed by the United Nations Framework Convention on Climate Change (UNFCCC). The Convention is an international environmental treaty that entered into force in 1994 and has been ratified by 198 countries, including all EU Member States, as well as the EU itself. The objective of the UNFCCC as expressed in the Convention text is "stabilization of greenhouse gas concentrations in the atmosphere at a level that would prevent dangerous anthropogenic interference with the climate system".
The Kyoto Protocol was the first international agreement to operationalize the UNFCCC setting binding emission reduction targets for industrialized countries, among them the EU as a region. It included two commitment periods: from 2008 to 2012, and from 2013 to 2020, the latter agreed upon in the Doha Amendment to the Protocol.
The successor of the Kyoto protocol, the Paris Agreement, entered into force on 4 November 2016. The Paris Agreement is the first-ever universal, legally binding global climate agreement. It was adopted during the 21st Conference of the Parties in December 2015 in Paris. The objectives of the Paris Agreement are to keep the global temperature rise well below 2 degrees Celsius above pre-industrial levels, pursuing efforts to limit the increase to 1.5 degrees Celsius, and enhancing adaptive capacity, strengthening resilience and reducing vulnerabilities. The goals of the Paris Agreement should be met by working towards achieving the nationally determined contributions (NDCs) put forward by the Parties to the Agreement, and planning for and implementing adaptation action.
In parallel, the sustainable development goals (SDGs) agreed upon in 2015 include a climate action goal. The targets related to this goal do not address GHG emissions directly, but are important to combat climate change and its impacts through capacity building, promoting climate change measures, and strengthening resilience and adaptive capacity to withstand the impacts of climate change. In addition to the dedicated climate action goal, several of the other SDGs are related to climate change, either directly or indirectly.
Direct access to
- Greenhouse gas emission statistics - emission inventories
- Electricity and heat statistics
- Energy statistics - an overview
- Freight transport statistics - modal split
- Agricultural production - livestock and meat
- Municipal waste statistics
- Greenhouse gas emission statistics - air emissions accounts
- Environmental accounts - establishing the links between the environment and the economy
Dedicated section
European Commission - Directorate-General for Climate Action
- Directorate-General for Climate Action home page
- Climate strategies & targets
- Consequences of climate change
- Climate and nature - joint action
European Environment Agency
- European Environment Agency European Environment Agency - Climate change mitigation
- European Environment Agency European Environment Agency - Climate change impacts, risks and adaptation
- EEA greenhouse gas - data viewer
United Nations Framework Convention on Climate Change (UNFCCC)
Intergovernmental Panel on Climate Change (IPCC)
Other
Notes
- ↑ For an in-depth analysis of developments in the environmental performance of transport in the EU see the Transport and Environment Report 2022
- ↑ See also the Statistics Explained article 'Environmental accounts - establishing the links between the environment and the economy'.
- ↑ See the column 'GWP 100-year' in Table 8.A.1 of Appendix 8.A of the report Climate Change 2013: The Physical Science Basis - Contribution of Working Group I to the IPCC's Fifth Assessment Report, page 731.
- ↑ See the Commission's European Green Deal and the European Climate Law.

