Happy European Statistics Day!

Statistics have been a part of the European project since the start, with the creation of the statistics division of the Coal and Steel Community (ESCS) in 1953. 70 years have passed since then, and now Eurostat is widely known as the provider of objective data on Europe. To commemorate statistics, today we celebrate European Statistics Day, initiated to promote the value of official statistics in making informed decisions and holding public debates.
2023 is the European Year of Skills, and we want to focus on how the EU is doing in this regard, on how EU people are striving to increase their skills to fetch higher quality jobs. For example, in 2022, 11.9% of the EU people between 25-42 years old participated in lifelong learning programs, up by 1.5 percentage points (pp) since 2017; 61% of the students in upper secondary general education were studying 2 or more languages, indicating an increase of 1.6 pp since 2016; and 42% of the people between 25 and 34 years old had a tertiary educational level of attainment (+4.4 pp since 2017).
In terms of digital skills, in 2021, 53.9% of EU people aged 16-74 had at least basic digital skills, and in 2022, ICT specialists represented 4.6% of total employment (+0.9 pp since 2017).
Source datasets: trng_lfse_01, edat_lfse_03, isoc_sks_itspt, educ_uoe_lang02 and isoc_sk_dskl_i21
To celebrate European Statistics Day, we invite you to dive into Eurostat’s products and discover all we have to offer.
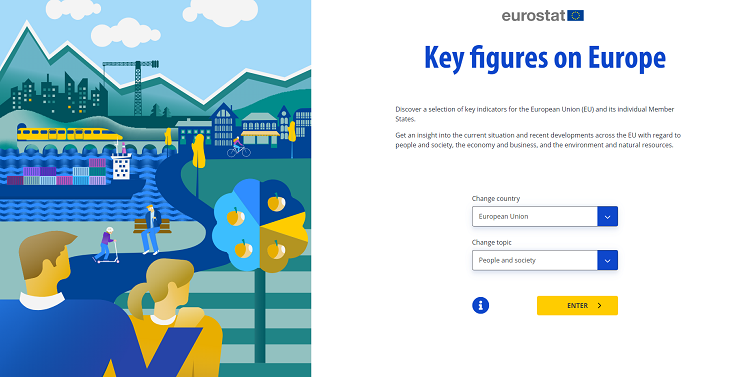
Check out the visualisation tool ‘Key figures on Europe’
The visualisation tool ‘Key figures on Europe 2023’, with data for the EU, individual EU members and EFTA countries, offers a quick and interactive overview of key aspects of the EU and your country and allows you to compare it with other EU countries. The different visualisation tools allow you to dig into selected statistics focusing on people & society, economy & business, and environment & natural resources.
The Key figures on Europe visualisation tool is available in English, while the publication itself is also available in German and French.
Inflation explained to kids
Recently, Eurostat released a short animation on inflation for children, explaining what causes inflation, and the link between supply and demand.
Targeted to children aged 9-12, the animation is a useful tool for teachers. The video has an English voiceover and subtitles in all official EU languages and Luxembourgish and is available on YouTube and the European Commission Audiovisual Service.
Webinar on job skills statistics
On 27 October, from 11.00 to 12.00 CEST, Eurostat will be organizing a webinar on job skills statistics.
Add the event to your calendar by clicking below, and join us.
Add to Calendar Add to Google Calendar Add to Yahoo! Calendar
For more information
- Visualisation tool Key figures on Europe
- Publication Key figures on Europe
- Webinar on job skills statistics
- Podcast on statistical literacy
Methodological notes
- Educational attainment levels are classified according to the International Standard Classification of Education (ISCED).
If you have any queries, please visit our contact us page.


