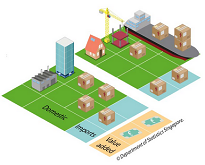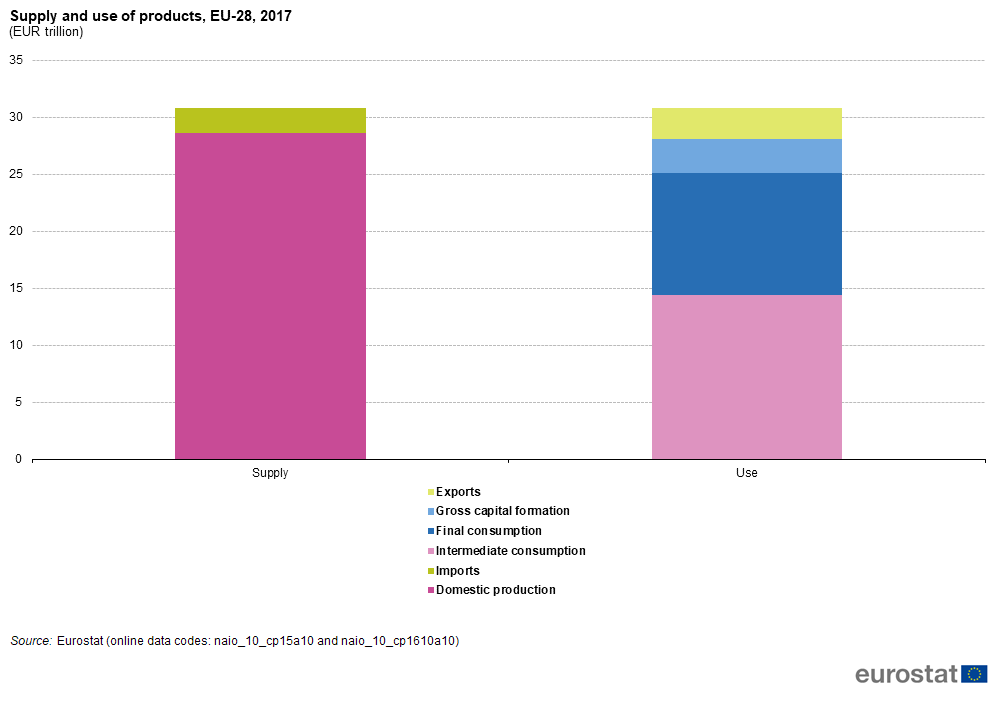
In 2017, products (goods and services) valued at EUR 28.6 trillion (thousand billion) were produced within the EU28, and the value of imports from outside of the EU28 was valued at EUR 2.2 trillion. As shares, domestic production accounted for 92.8% of the total supply and imports for the remaining 7.2%.
What use was made of these products?
In value terms, nearly half (46.7%) were used for intermediate consumption, in other words to make other products. The next largest share, just over one third (34.9%), was used for final consumption, typically by households or the government sector. Nearly one tenth (9.6%) of the supply was used for gross capital formation, mainly for investment, however this share also includes any changes in the level of stocks of products between the beginning and the end of the year. Exports of products were valued at EUR 2.7 trillion accounting for the remaining 8.8% of the supply.
Do you want to read more about supply and use in the Member States or other details of the subject?
Then have a look at the newly released Statistics Explained article Supply and use statistics.
To contact us, please visit our User Support page.
For press queries, please contact our Media Support.


