
In 2018, households in the European Union (EU) spent over €1 047 bn (equivalent to 6.6% of EU GDP) on 'food and non-alcoholic beverages'.
This represents 12.1% of their total consumption expenditure and ranks as the third most largest category of household expenditure after 'housing, water, electricity, gas and other fuels', which accounted for 24.0% of household expenditure, and 'transport', which accounted for 13.2%.
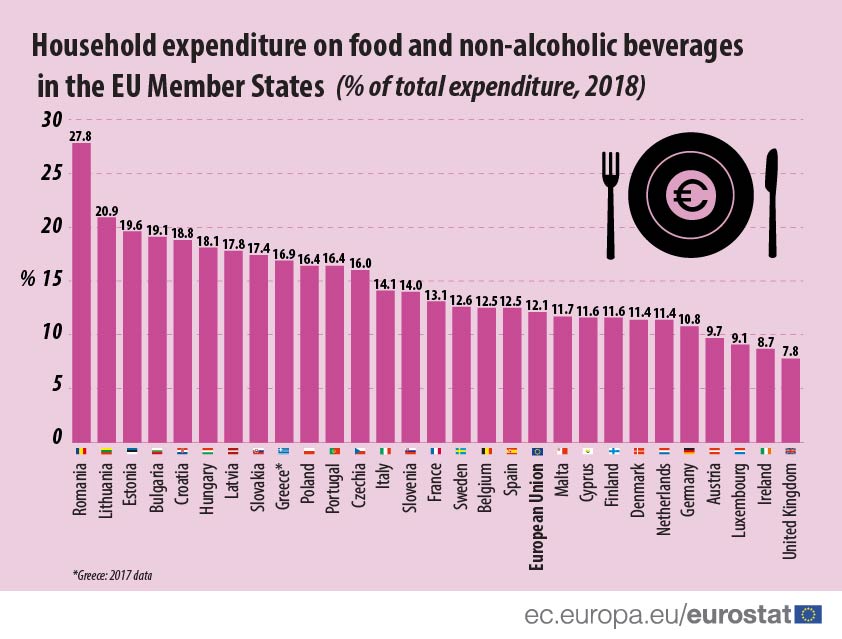
Households in Romania spent around a fifth of total household consumption expenditure on food and non-alcoholic beverages (27.8%). The next highest shares were in Lithuania (20.9%) and Estonia (19.6%).
The source dataset can be found here.
In contrast, the figure was below 10% in four EU Member States: the United Kingdom (7.8%), Ireland (8.7%), Luxembourg (9.1%) and Austria (9.7%).
Lithuania - highest decrease in food expenditure, Czechia and Slovakia the highest increase
Between 2008 and 2018, the share of total household expenditure on food decreased or remained stable in most EU Member States where 2018 data is available. The largest decrease was recorded in Lithuania (from 24.8% of total household expenditure in 2008 to 20.9% in 2018, or a fall of 3.9 percentage points (pp)), followed by Poland (-3.4 pp) and Malta (-3.0 pp).
In contrast, household expenditure on food increased in 10 EU Member States where 2018 data is available. The largest increase was recorded in Czechia and Slovakia (both +1.4 pp), the Netherlands (+1.0 pp) and Hungary (+0.8 pp).
For more information:
- Statistics Explained article on household consumption by purpose
To contact us, please visit our User Support page.
For press queries, please contact our Media Support.