|
|
||||||||||||||||||||||||||||||||||||||||||||||||||||||||||||||||||||||||||||||||||||||||||||||||||||||
| For any question on data and metadata, please contact: Eurostat user support |
|
|||
| 1.1. Contact organisation | Eurostat, the Statistical Office of the European Union |
||
| 1.2. Contact organisation unit | E2: Environmental statistics and accounts; sustainable development |
||
| 1.5. Contact mail address | 2920 Luxembourg, LUXEMBOURG |
||
|
|||
| 2.1. Metadata last certified | 9 January 2024 | ||
| 2.2. Metadata last posted | 9 January 2024 | ||
| 2.3. Metadata last update | 17 April 2024 | ||
|
|||
| 3.1. Data description | |||
Physical energy flow accounts (PEFA) is one module of the European environmental-economic accounts - Regulation (EU) 691/2011 Annex VI. PEFA record the flows of energy (in terajoules)
using the accounting framework of physical supply and use tables. PEFA provide information on energy flows arranged in a way fully compatible with concepts, principles, and classifications of national accounts – thus enabling integrated analyses of environmental, energy and economic issues e.g. through environmental-economic modelling. PEFA complement the traditional energy statistics, balances and derived indicators which are the main reference data source for EU energy policies. This metadata refers to three PEFA datasets based on the same data collection:
|
|||
| 3.2. Classification system | |||
Physical energy flow accounts (PEFA) datasets have the following dimensions: 1) Supply and use tables (STK_FLOW): the elements of this dimension are the five questionnaire tables: - energy supply (questionnaire table A); - energy use (table B), of which transformation use (table B1), of which end use (table B2), and of which emission relevant use (table C). 2) Energy product (PROD_NRG): (not relevant for env_ac_pefa04 and env_ac_pefa05) The flows of energy recorded in PEFA are broadly grouped into natural energy inputs (flows from environment to economy), energy products (flows within economy), and energy residuals (flows from economy to environment mainly). Each of these generic groups is further broken down. In total this dimension distinguishes 31 items which are regulated in Commission Delegated Regulation (EU) 2016/172. 3) Classification of economic activities - NACE Rev.2 (NACE_R2): (not relevant for env_ac_pefa05) The supply and use of energy flows is broken down by NACE classification of economic activities. The aggregation level used is A*64 (i.e. 64 branches), fully compatible with ESA supply and use tables. Furthermore, this dimension includes private households, accumulation (e.g. product inventories), the rest of the world economy for imports and exports, and the environment. 4) Indicators (INDIC_PEFA): (only relevant for env_ac_pefa04 and env_ac_pefa05): Various key indicators that can be derived from the physical supply and use tables (env_ac_pefa04) and so-called 'bridging-items' (env_pefa_pefa05) which present the various elements explaining the differences between the national totals as reported by PEFA vis-a-vis the national totals as reported by Eurostat's energy balances. 5) Geopolitical entity (GEO): EU Member States, EFTA countries, candidate countries, and potential candidates. 6) Period of time (TIME): Energy flow data are annual. 7) Unit (UNIT): Energy flows are reported in Terajoules. |
|||
| 3.3. Coverage - sector | |||
The data set covers the entire national economy as defined in national accounts (ESA 2010, paragraph 2.04), as well as its physical relation to economies in the rest of the world and the environment. |
|||
| 3.4. Statistical concepts and definitions | |||
Physical energy flow accounts (PEFA) are conceptually rooted in the System of Environmental-Economic Accounting (SEEA) which is an international statistical standard. The SEEA central framework provides standard concepts, definitions, classifications, accounting rules and tables for the provision of statistics on the environment and its relationship with the economy. PEFA constitute satellite accounts to the National Accounts (NA). Hence, the statistical concepts and definitions of PEFA are derived from those of NA. As far as applicable PEFA is also compliant with the statistical concepts and definitions internationally established for energy statistics: the International Recommendations for Energy Statistics (IRES). Three concepts are essential to PEFA:
The PEFA manual provides more details on the conceptual foundations of PEFA and includes all relevant definitions. |
|||
| 3.5. Statistical unit | |||
Data refer to activities of resident economic units in the sense of SEEA central framework (SEEA CF 2012) and National Accounts (NA), including households. |
|||
| 3.6. Statistical population | |||
The national economy is as defined in SEEA CF 2012 and National Accounts (NA); i.e. all economic activities undertaken by resident units (see ESA 2010, paragraph 2.04). A unit is said to be a resident unit of a country when it has a centre of economic interest in the economic territory of that country, that is, when it engages for an extended period (1 year or more) in economic activities in that territory. |
|||
| 3.7. Reference area | |||
EU Member States, EFTA countries, EU candidate countries and potential candidates. (limited to data availability) |
|||
| 3.8. Coverage - Time | |||
The time coverage is 2014 to 2021 (data to be reportded under legal base). For some countries, data for preceding years are available as well. |
|||
| 3.9. Base period | |||
Not applicable |
|||
|
|||
Terajoule (TJ) |
|||
|
|||
The data refer to the calendar year. |
|||
|
|||
| 6.1. Institutional Mandate - legal acts and other agreements | |||
PEFA are legally covered by Regulation (EC) No. 691/2011 on European environmental economic accounts (EEEA) as amended by Regulation (EU) No. 538/2014. EEEA currently include six modules (air emissions accounts, environmentally related taxes by economic activity, economy-wide material flow accounts, environmental protection expenditure accounts, environmental goods and services sector accounts, and physical energy flow accounts). The EEEA are fully in accordance with internationally agreed concepts and definitions set out in the system of environmental economic accounting 2012 – central framework (SEEA CF 2012, see annex). The SEEA CF is a multi-purpose conceptual framework to report the interactions between the environment and the economy. EEEA present environmental information in a way that is fully compatible with National Accounts. |
|||
| 6.2. Institutional Mandate - data sharing | |||
Not applicable |
|||
|
|||
| 7.1. Confidentiality - policy | |||
Regulation (EC) No 223/2009 on European statistics (recital 24 and Article 20(4)) of 11 March 2009 (OJ L 87, p. 164), stipulates the need to establish common principles and guidelines ensuring the confidentiality of data used for the production of European statistics and the access to those confidential data with due account for technical developments and the requirements of users in a democratic society. |
|||
| 7.2. Confidentiality - data treatment | |||
Confidential data are flagged "confidential" and not published. Aggregates of confidential data respect Eurostat confidentiality rules. |
|||
|
|||
| 8.1. Release calendar | |||
Dissemination of data is usually at the end of the year (December). |
|||
| 8.2. Release calendar access | |||
Not applicable |
|||
| 8.3. Release policy - user access | |||
In line with the Community legal framework and the European Statistics Code of Practice Eurostat disseminates European statistics on Eurostat's website (see item 10 - 'Accessibility and clarity') respecting professional independence and in an objective, professional and transparent manner in which all users are treated equitably. The detailed arrangements are governed by the Eurostat protocol on impartial access to Eurostat data for users. Data are disseminated simultaneously to all interested parties through a database update and on Eurostat's website. |
|||
|
|||
Data are disseminated annually. |
|||
|
|||||||||||||||||||||||||||||||||||||||||||||||||||||||||||||||||||||||||||||||||||||||
| 10.1. Dissemination format - News release | |||||||||||||||||||||||||||||||||||||||||||||||||||||||||||||||||||||||||||||||||||||||
There are no scheduled news or press releases. |
|||||||||||||||||||||||||||||||||||||||||||||||||||||||||||||||||||||||||||||||||||||||
| 10.2. Dissemination format - Publications | |||||||||||||||||||||||||||||||||||||||||||||||||||||||||||||||||||||||||||||||||||||||
A Statistics Explained article on energy use by businesses and households is partially based on PEFA data. |
|||||||||||||||||||||||||||||||||||||||||||||||||||||||||||||||||||||||||||||||||||||||
| 10.3. Dissemination format - online database | |||||||||||||||||||||||||||||||||||||||||||||||||||||||||||||||||||||||||||||||||||||||
The online database is available free of charge. There is also a dedicated section explaining PEFA. |
|||||||||||||||||||||||||||||||||||||||||||||||||||||||||||||||||||||||||||||||||||||||
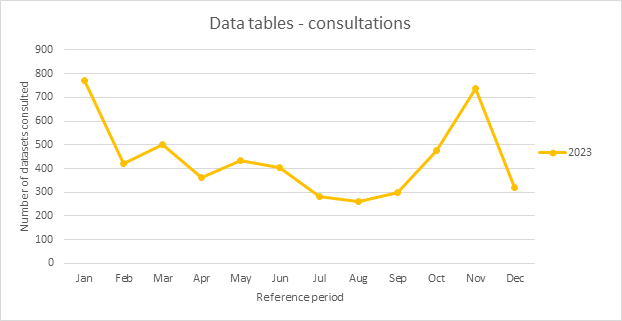
| 10.3.1. Data tables - consultations | |||||||||||||||||||||||||||||||||||||||||||||||||||||||||||||||||||||||||||||||||||||||
Consultations of Eurostat online database 'EUROBASE' – data sets This quality performance indicator presents the number of consultations of online data sets taking into account the following parameters: - DATASETS = 'env_ac_pefasu', 'env_ac_pefa04', 'env_ac_pefa05' - REFERENCE PERIOD = 2023 monthly
|
|||||||||||||||||||||||||||||||||||||||||||||||||||||||||||||||||||||||||||||||||||||||
| 10.4. Dissemination format - microdata access | |||||||||||||||||||||||||||||||||||||||||||||||||||||||||||||||||||||||||||||||||||||||
Not applicable |
|||||||||||||||||||||||||||||||||||||||||||||||||||||||||||||||||||||||||||||||||||||||
| 10.5. Dissemination format - other | |||||||||||||||||||||||||||||||||||||||||||||||||||||||||||||||||||||||||||||||||||||||
See point 3.1 of metadata. |
|||||||||||||||||||||||||||||||||||||||||||||||||||||||||||||||||||||||||||||||||||||||
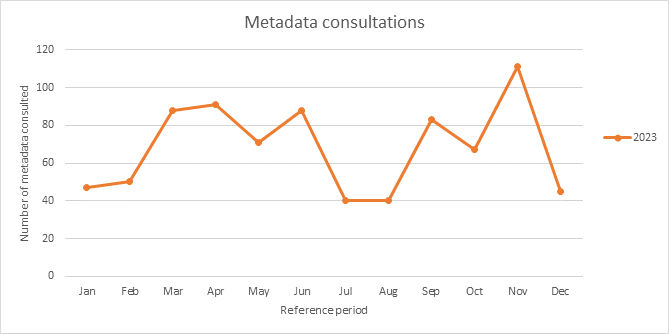
| 10.5.1. Metadata - consultations | |||||||||||||||||||||||||||||||||||||||||||||||||||||||||||||||||||||||||||||||||||||||
Consultations of Eurostat online database 'EUROBASE' - metadata This quality performance indicator presents the number of consultations of online metadata taking into account the following parameters: - METADATA = 'env_pefa_esms.htm' and 'env_pefa_sims.htm' - REFERENCE PERIOD = 2023 monthly
|
|||||||||||||||||||||||||||||||||||||||||||||||||||||||||||||||||||||||||||||||||||||||
| 10.6. Documentation on methodology | |||||||||||||||||||||||||||||||||||||||||||||||||||||||||||||||||||||||||||||||||||||||
The PEFA manual and other methodological information can be downloaded from Eurostat's website. |
|||||||||||||||||||||||||||||||||||||||||||||||||||||||||||||||||||||||||||||||||||||||
| 10.6.1. Metadata completeness - rate | |||||||||||||||||||||||||||||||||||||||||||||||||||||||||||||||||||||||||||||||||||||||
Metadata completeness - rate This quality performance indicator presents the ‘ratio of completeness’ by country. It is defined as the number of metadata elements provided by countries in relation to the total number of metadata elements applicable. The following parameters are taken into account: - GEO = EU, Member States - REFERENCE PERIOD = 2023 data collection cycle - DEADLINE = 30 September 2023; January 2024 (metadata already published) - INDIC = National metadata file (SIMS) - Ratio of completeness = number of metadata elements provided / total number of metadata elements applicable The total number of metadata elements applicable include the following: - Statistical outputs concepts - 2.1, 2.2, 2.3, 3.1,3.2, 3.3, 3.4, 3.5, 3.6, 3.7, 3.8, 3.9, 4, 7.1, 8.1, 8.2, 8.3, 9 - Statistical processes concepts - 5, 6.1, 6.2, 7.2, 17.1, 17.2, 18.1, 18.1.1, 18.1.2, 18.1.3,18.1.4, 18.1.5, 18.1.6, 18.1.7, 18.2, 18.3, 18.4, 18.5, 18.5.1, 18.5.2, 18.5.3, 18.5.4, 18.5.5, 18.6 - Quality concepts - 10.1, 10.2, 10.3, 10.4, 10.5, 10.6, 10.7, 11.1, 11.2, 12.1, 12.2, 12.3, 13.1, 13.2, 13.3, 14.1, 14.2, 15.1, 15.2.1.1, 15.3, 15.3.1, 15.3.2, 15.3.3, 15.3.4, 15.3.5, 15.3.6, 15.3.7, 15.3.8, 15.4, 16
|
|||||||||||||||||||||||||||||||||||||||||||||||||||||||||||||||||||||||||||||||||||||||
| 10.7. Quality management - documentation | |||||||||||||||||||||||||||||||||||||||||||||||||||||||||||||||||||||||||||||||||||||||
Reporting national statistical instítutes provide national quality reports, according to Regulation 691/2011. |
|||||||||||||||||||||||||||||||||||||||||||||||||||||||||||||||||||||||||||||||||||||||
|
|||
| 11.1. Quality assurance | |||
To ensure quality of the data Eurostat implements the following procedures/guidelines: - Provision of methodological guidelines to assist countries in compiling PEFA - Provision of the PEFA-builder, an IT tool that allows the population of PEFA questionnaire based on available national energy statistics (IEA/ESTAT Annual Questionnaires) and additional information from the respondent. - Extensive validation procedure of the data received in consultation with the reporting country. The validation tools check:
|
|||
| 11.2. Quality management - assessment | |||
The overall data quality is considered medium to good at the current stage of development. Further improvements of data quality is envisaged. |
|||
|
||||||||||||||||||||||||||||||||||||||||||||||||||||||||||||||||||||||||||||||||||||||||||||||||||||||||||||||||||||||||||||||||||||||||||||||||||||||||||||||||||||||||||||||
| 12.1. Relevance - User Needs | ||||||||||||||||||||||||||||||||||||||||||||||||||||||||||||||||||||||||||||||||||||||||||||||||||||||||||||||||||||||||||||||||||||||||||||||||||||||||||||||||||||||||||||||
The users include policy makers in Commission DGs, European Parliament, Council, environmental ministries, environmental NGOs, as well as students and other citizens interested in the the interaction between the economy and the environment as regards the transfer and use of energy in its various forms. The relevance of PEFA is enhanced by using a conceptual framework consistent with National Accounts, which allows, e.g. to put in relation with estimates of production, value added, employment, GDP, etc. |
||||||||||||||||||||||||||||||||||||||||||||||||||||||||||||||||||||||||||||||||||||||||||||||||||||||||||||||||||||||||||||||||||||||||||||||||||||||||||||||||||||||||||||||
| 12.2. Relevance - User Satisfaction | ||||||||||||||||||||||||||||||||||||||||||||||||||||||||||||||||||||||||||||||||||||||||||||||||||||||||||||||||||||||||||||||||||||||||||||||||||||||||||||||||||||||||||||||
There are no systematic studies of user satisfaction. Eurostat has regular hearings with European policymakers and contacts with the research community and other stakeholders to monitor the relevance of the statistics produced and identify new priorities. |
||||||||||||||||||||||||||||||||||||||||||||||||||||||||||||||||||||||||||||||||||||||||||||||||||||||||||||||||||||||||||||||||||||||||||||||||||||||||||||||||||||||||||||||
| 12.3. Completeness | ||||||||||||||||||||||||||||||||||||||||||||||||||||||||||||||||||||||||||||||||||||||||||||||||||||||||||||||||||||||||||||||||||||||||||||||||||||||||||||||||||||||||||||||
The data set is complete for reference years 2014-2021 and all Member States of the EU. However, some gaps exist due to confidentiality of data. Reported data for a specific country and a single year are complete, meaning they encompass all the NACE production activities of the national economy and all energy flows (natural inputs, products, residuals). The breakdown into transformation use (questionnaire table B1) and end use (table B2) was not reported by all countries that sent data (reporting of these tables is not obligatory). |
||||||||||||||||||||||||||||||||||||||||||||||||||||||||||||||||||||||||||||||||||||||||||||||||||||||||||||||||||||||||||||||||||||||||||||||||||||||||||||||||||||||||||||||
| 12.3.1. Data completeness - rate | ||||||||||||||||||||||||||||||||||||||||||||||||||||||||||||||||||||||||||||||||||||||||||||||||||||||||||||||||||||||||||||||||||||||||||||||||||||||||||||||||||||||||||||||
Data completeness rate, in % This quality performance indicator presents data completeness rates by geographical entity taking into account the following parameters: - GEO = EU, Member States - INDIC_ENV = A, B, B1, B2, C, and E - REFERENCE PERIOD = 2021 legally mandatory reference year Remarks: - Indicator completeness rate = reported cells / expected cells Note: Indicator includes voluntary tables B1 and B2. NL and RO did not report voluntary tables B1 and B2 leading to a lower completness rate of 61.
|
||||||||||||||||||||||||||||||||||||||||||||||||||||||||||||||||||||||||||||||||||||||||||||||||||||||||||||||||||||||||||||||||||||||||||||||||||||||||||||||||||||||||||||||
|
|||
| 13.1. Accuracy - overall | |||
The overall accuracy is considered to be good but cannot be quantified. |
|||
| 13.2. Sampling error | |||
Not applicable to statistical accounts |
|||
| 13.2.1. Sampling error - indicators | |||
Not applicable to statistical accounts |
|||
| 13.3. Non-sampling error | |||
Not applicable to statistical accounts |
|||
| 13.3.1. Coverage error | |||
Not applicable |
|||
| 13.3.1.1. Over-coverage - rate | |||
Not applicable |
|||
| 13.3.1.2. Common units - proportion | |||
Not applicable |
|||
| 13.3.2. Measurement error | |||
Not applicable |
|||
| 13.3.3. Non response error | |||
Not applicable |
|||
| 13.3.3.1. Unit non-response - rate | |||
Not applicable |
|||
| 13.3.3.2. Item non-response - rate | |||
Not applicable |
|||
| 13.3.4. Processing error | |||
Not applicable |
|||
| 13.3.5. Model assumption error | |||
Not applicable |
|||
|
||||||||||||||||||||||||||||||||||||||||||||||||||||||||||||||||||||||||||||||||||||||||||||||||||||||||||||||||||||||||||||||||||||||||||||||||||||||||||||||||||||||||||||||||||||||||||||||||||||||||||||||||||
| 14.1. Timeliness | ||||||||||||||||||||||||||||||||||||||||||||||||||||||||||||||||||||||||||||||||||||||||||||||||||||||||||||||||||||||||||||||||||||||||||||||||||||||||||||||||||||||||||||||||||||||||||||||||||||||||||||||||||
Every year by the 30 September, Member States have to transmit to Eurostat data for the pre-previous reference year, i.e., with a timeliness of T+21 months. After validation Eurostat will publish the data in December of the sameyear. (i.e. T+24m). |
||||||||||||||||||||||||||||||||||||||||||||||||||||||||||||||||||||||||||||||||||||||||||||||||||||||||||||||||||||||||||||||||||||||||||||||||||||||||||||||||||||||||||||||||||||||||||||||||||||||||||||||||||
| 14.1.1. Time lag - first result | ||||||||||||||||||||||||||||||||||||||||||||||||||||||||||||||||||||||||||||||||||||||||||||||||||||||||||||||||||||||||||||||||||||||||||||||||||||||||||||||||||||||||||||||||||||||||||||||||||||||||||||||||||
Not applicable |
||||||||||||||||||||||||||||||||||||||||||||||||||||||||||||||||||||||||||||||||||||||||||||||||||||||||||||||||||||||||||||||||||||||||||||||||||||||||||||||||||||||||||||||||||||||||||||||||||||||||||||||||||
| 14.1.2. Time lag - final result | ||||||||||||||||||||||||||||||||||||||||||||||||||||||||||||||||||||||||||||||||||||||||||||||||||||||||||||||||||||||||||||||||||||||||||||||||||||||||||||||||||||||||||||||||||||||||||||||||||||||||||||||||||
Not applicable |
||||||||||||||||||||||||||||||||||||||||||||||||||||||||||||||||||||||||||||||||||||||||||||||||||||||||||||||||||||||||||||||||||||||||||||||||||||||||||||||||||||||||||||||||||||||||||||||||||||||||||||||||||
| 14.2. Punctuality | ||||||||||||||||||||||||||||||||||||||||||||||||||||||||||||||||||||||||||||||||||||||||||||||||||||||||||||||||||||||||||||||||||||||||||||||||||||||||||||||||||||||||||||||||||||||||||||||||||||||||||||||||||
All Member States are currently able to meet the transmission deadline (30 September). |
||||||||||||||||||||||||||||||||||||||||||||||||||||||||||||||||||||||||||||||||||||||||||||||||||||||||||||||||||||||||||||||||||||||||||||||||||||||||||||||||||||||||||||||||||||||||||||||||||||||||||||||||||
| 14.2.1. Punctuality - delivery and publication | ||||||||||||||||||||||||||||||||||||||||||||||||||||||||||||||||||||||||||||||||||||||||||||||||||||||||||||||||||||||||||||||||||||||||||||||||||||||||||||||||||||||||||||||||||||||||||||||||||||||||||||||||||
Punctuality of data delivery by country and Eurostat data dissemination This quality performance indicator presents several metrics related to the punctuality of data delivery and publication taking into account the following parameters: - GEO = EU, Member States - INDIC_ENV = A, B, B1, B2, C, and E - REFERENCE PERIOD = 2023 data collection - DEADLINE FOR DELIVERY = 30 September 2023 - DATE OF DATA DISSEMINATION = 21 December 2023
|
||||||||||||||||||||||||||||||||||||||||||||||||||||||||||||||||||||||||||||||||||||||||||||||||||||||||||||||||||||||||||||||||||||||||||||||||||||||||||||||||||||||||||||||||||||||||||||||||||||||||||||||||||
|
||||||||||||||||||
| 15.1. Comparability - geographical | ||||||||||||||||||
The comparability across countries is good due to clear statistical concepts and definitions. However, the national data sources used by National Statistical Institutes may differ in scope and quality. |
||||||||||||||||||
| 15.1.1. Asymmetry for mirror flow statistics - coefficient | ||||||||||||||||||
Not applicable. |
||||||||||||||||||
| 15.2. Comparability - over time | ||||||||||||||||||
Time series are available only for a limited number of countries, but their comparability over time is good due to consistent production based on clear statistical concepts and definitions. |
||||||||||||||||||
| 15.2.1. Length of comparable time series | ||||||||||||||||||
Length of comparable time series This quality performance indicator presents the number of ‘breaks in time series’ taking into account the following parameters: - GEO = EU Member States - STOCK or FLOW = [SUP] Supply, [USE] Use and [ER_USE] Emission-relevant use - COUNTING BREAKS IN SERIES = number of b) flag - REFERENCE PERIOD = 8 reference years - mandatory reference years - non-mandatory reference years
|
||||||||||||||||||
| 15.3. Coherence - cross domain | ||||||||||||||||||
The data are coherent with principles, definitions and concepts in National Accounts (ESA - European System of Accounts), energy statistics (IRES - International Recommendations for Energy Statistics), and Environmental Accounting (SEEA - System of Environmental-Economic Accounting). It is important that air emissions accounts (AEA) and physical energy flow accounts (PEFA) employ the same groupings of elementary economic units (NACE Rev. 2 activities) as the ESA supply and use tables. This coherence is important with regards to integrated analyses (e.g. applying Leontief-type input-output analysis). As an overarching general rule AEA and PEFA must apply exactly the same demarcation of productive activities (NACE Rev. 2 activities) as employed for the compilation of the monetary supply and use tables delivered to Eurostat under the ESA transmission programme. Compilers of AEA and PEFA are advised to contact and align with compilers of ESA supply and use tables with the aim to ensure highest coherence between AEA, PEFA and ESA supply and use tables. It has to be noted that this coherence is not yet fully established. |
||||||||||||||||||
| 15.3.1. Coherence - sub annual and annual statistics | ||||||||||||||||||
Not applicable; reported PEFA data are only annual. |
||||||||||||||||||
| 15.3.2. Coherence - National Accounts | ||||||||||||||||||
The data are coherent with national accounts and environmental-economic accounts. |
||||||||||||||||||
| 15.4. Coherence - internal | ||||||||||||||||||
The internal coherence is very high, ensured by the accounting framework. |
||||||||||||||||||
|
|||
According to the quality reports, countries are investing between one week and more than 1 year of full time expert equivalents (FTE) for the yearly production/update of PEFA. |
|||
|
||||||||||||||||||||||||||||||||||||||||||||||||||||||||||||||||||||||||||||||||||||||||||||||||||||||||||||||||||||||||||||||||||||||||||||||||||||||||||||||||||||||||||||||||||||||||||||||||||||||||||||||||||||||||||||||||||||||||
| 17.1. Data revision - policy | ||||||||||||||||||||||||||||||||||||||||||||||||||||||||||||||||||||||||||||||||||||||||||||||||||||||||||||||||||||||||||||||||||||||||||||||||||||||||||||||||||||||||||||||||||||||||||||||||||||||||||||||||||||||||||||||||||||||||
For PEFA, the general Eurostat revision policy applies. In the course of the annual production cycle, Eurostat publishes national data for those reference years that countries reported, which may lead to revisions of national data previously reported and published. EU aggregates are generated based on the national data reported. Data are not revised systematically in between annual releases. |
||||||||||||||||||||||||||||||||||||||||||||||||||||||||||||||||||||||||||||||||||||||||||||||||||||||||||||||||||||||||||||||||||||||||||||||||||||||||||||||||||||||||||||||||||||||||||||||||||||||||||||||||||||||||||||||||||||||||
| 17.2. Data revision - practice | ||||||||||||||||||||||||||||||||||||||||||||||||||||||||||||||||||||||||||||||||||||||||||||||||||||||||||||||||||||||||||||||||||||||||||||||||||||||||||||||||||||||||||||||||||||||||||||||||||||||||||||||||||||||||||||||||||||||||
New data are only used to update disseminated data if provided according to the provision schedule set by Eurostat, or in the case of reported errors. Reported errors are assessed for seriousness to determine whether they should trigger a correction of already disseminated data.
Data are only published once they are deemed to be sufficiently complete for all data providers contributing to the EU aggregate.
New data are only used to update disseminated data if provided according to the provision schedule set by Eurostat, or in the case of reported errors.
|
||||||||||||||||||||||||||||||||||||||||||||||||||||||||||||||||||||||||||||||||||||||||||||||||||||||||||||||||||||||||||||||||||||||||||||||||||||||||||||||||||||||||||||||||||||||||||||||||||||||||||||||||||||||||||||||||||||||||
| 17.2.1. Data revision - average size | ||||||||||||||||||||||||||||||||||||||||||||||||||||||||||||||||||||||||||||||||||||||||||||||||||||||||||||||||||||||||||||||||||||||||||||||||||||||||||||||||||||||||||||||||||||||||||||||||||||||||||||||||||||||||||||||||||||||||
Average absolute size of EUSE_RES revisions by country and year, in terajoule This quality performance indicator presents the average size of revisions for one important PEFA indicator, namely EUSE_RES. The following parameters are taken into account: - GEO = EU, Member States - INDIC_ENV = EUSE_RES - UNIT = Terajoule (TJ) - Number of data collection cycles: 7 Remarks: - For each reference year (columns in below table), the absolute revision size for EUSE_RES is calculated between two consecutive collection cycles. This is done for each data collection cycle. Then, the average is calculated over the number of data collection cycles. - Note that for reference year 2016 the average is built on six data collection cycles. For reference year 2017 the average is built on five data collection cycles and so on.
|
||||||||||||||||||||||||||||||||||||||||||||||||||||||||||||||||||||||||||||||||||||||||||||||||||||||||||||||||||||||||||||||||||||||||||||||||||||||||||||||||||||||||||||||||||||||||||||||||||||||||||||||||||||||||||||||||||||||||
|
|||
| 18.1. Source data | |||
PEFA are compiled combining a variety of (often administrative) data sources (e.g. national energy statistics) and auxiliary information. The compilation process may include estimation procedures. |
|||
| 18.2. Frequency of data collection | |||
Data are collected annually. |
|||
| 18.3. Data collection | |||
Data are collected by means of a questionnaire (deadline 30 September). Data collection is regulated in Regulation (EU) 691/2011 Annex VI. Respondents are given access to a supporting tool for the calculation of PEFA from energy statistics (PEFA Builder). |
|||
| 18.4. Data validation | |||
Data are extensively checked via a validation procedure using IT tools for the checking of formal compliance, consistency and plausibility. Reporting authorities are closely involved and are requested to approve all changes/corrections deemed necessary in the data set. More about data validation can be found in point 11.1. |
|||
| 18.5. Data compilation | |||
Eurostat derives EU aggregates bottom-up, i.e. by summing up country data, except for imports and exports of energy products, for which a special methodology is applied as described in the following: The imports and exports of energy products as reported by EU Member States include two components: an intra-EU and an extra-EU component. The former denotes trade with other EU Member States, while the latter concerns trade with non-EU countries. From the perspective of the aggregated EU economy, only the extra-EU component is relevant, and the intra-EU components need to be ignored. This calls for an adjustment to the standard bottom-up approach (sum of 27 Member States values) in the case of imports and exports of energy products. Eurostat uses exisiting European statistics on the annual trade of energy products by trade partner (nrg_t) to derive extra-EU shares, which are applied to the standard bottom-up EU sum. These coefficients are specific for country, energy product, trade type (import or export), and time.
|
|||
| 18.5.1. Imputation - rate | |||
Not applicable. |
|||
| 18.6. Adjustment | |||
Not applicable |
|||
| 18.6.1. Seasonal adjustment | |||
Not applicable |
|||
|
|||
|
|||
|
|||
| PEFA manual, PEFA questionnaire |
|||
|
|||