Further information

    Shedding light on energy in the EU - A guided tour of energy statistics is a digital publication released by Eurostat, the statistical office of the European Union.

    For further information

    The dedicated section on energy on the Eurostat website.

    Articles on energy in Statistics Explained.

    Information on data

    Date of data extraction: April 2017 for text and all infographics, maps and animations. The Sankey diagram is continuously updated.

    Contact

    If you have questions on the data, please contact the Eurostat User Support.

    Identifiers of the digital publication:

    Catalogue number: KS-02-17-394-EN-Q
    ISBN 978-92-79-67982-7
    Doi: 10.2785/208379

    © European Union, 2017
    Cover photo: © Shutterstock - copyright Capitanoseye - Image number: 315873152
    Menu icons: © Flaticon

    Cookie policy

    Privacy policy

    Legal notice

4.3 What is the share of renewable energy in the EU?

The share of renewable energy in energy consumption increased continuously between 2004 and 2015, from 8.5 % to 16.7 %, approaching the Europe 2020 target of 20 % by 2020.

The share of renewable energy in the Member States was highest in Sweden (53.9 % of energy consumption) followed by Finland (39.3 %) and Latvia (37.6 %). This share was lowest in Luxembourg and Malta (both 5.0 %), the Netherlands (5.8  %) and Belgium (7.9 %). Differences stem from variations in the endowment with natural resources, mostly in the potential for building hydropower plants and in the availability of biomass. All Member States increased their renewable energy share between 2004 and 2015, thirteen have at least doubled their share.
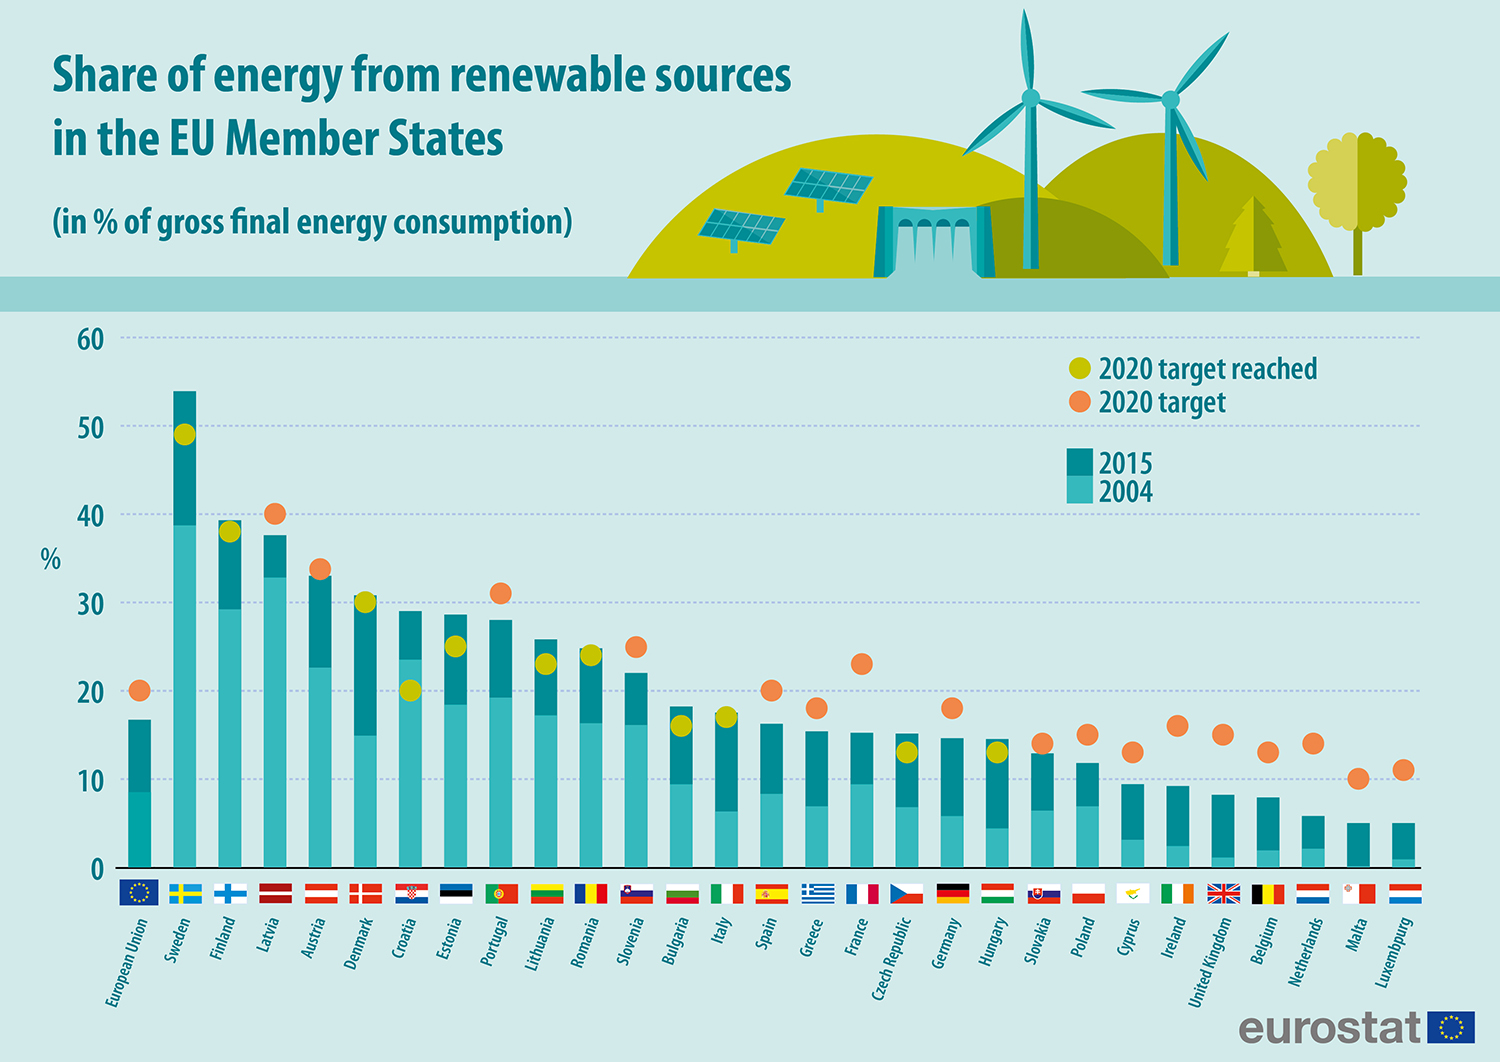
Share of energy from renewable energy sources in the EU member states