3.3 How much does the energy we consume cost?
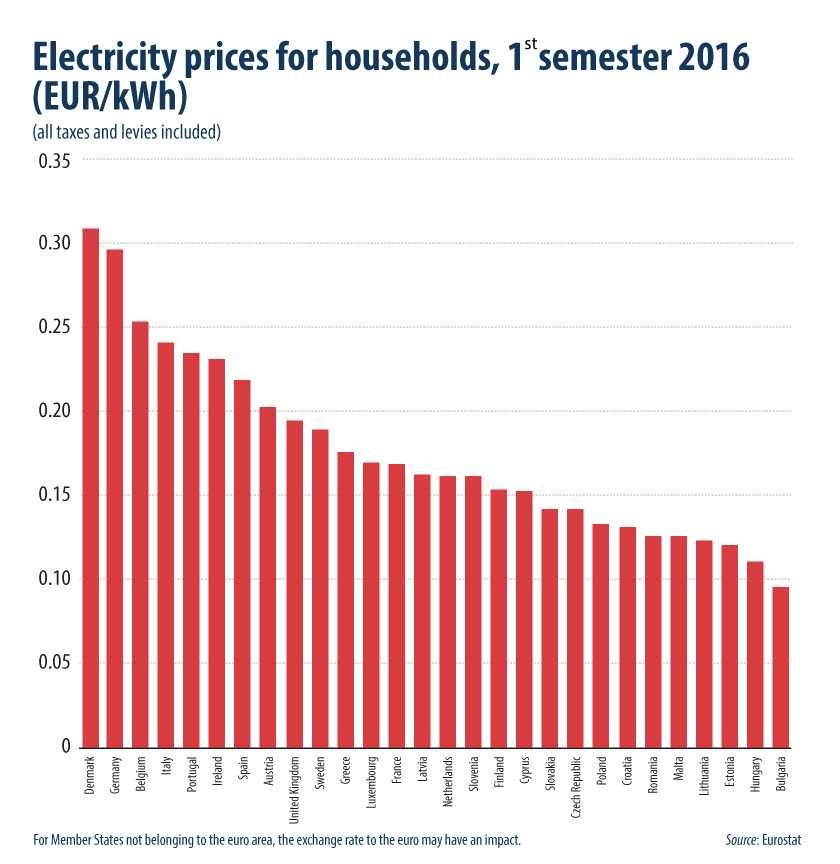
Electricity prices for households highest in Denmark and Germany
In order to compare prices of electricity and gas among the Member States, national prices have been converted into euro. Exchange rate fluctuations can have an effect on prices expressed in euro for non-euro area Member States.
For medium size household consumers, electricity prices including taxes and levies were the highest in the first semester of 2016 in Denmark (EUR 0.31 per kWh), Germany (EUR 0.30 per kWh) and Belgium (EUR 0.25 per kWh), while the lowest prices were recorded in Bulgaria (EUR 0.10 per kWh) and Hungary (EUR 0.11 per kWh). It should however be noted that over half of the electricity price in Denmark and Germany consists of taxes and levies, and 38 % in Belgium. On the other hand, in Bulgaria taxes and levies account for 17 % and in Hungary for 21 %.
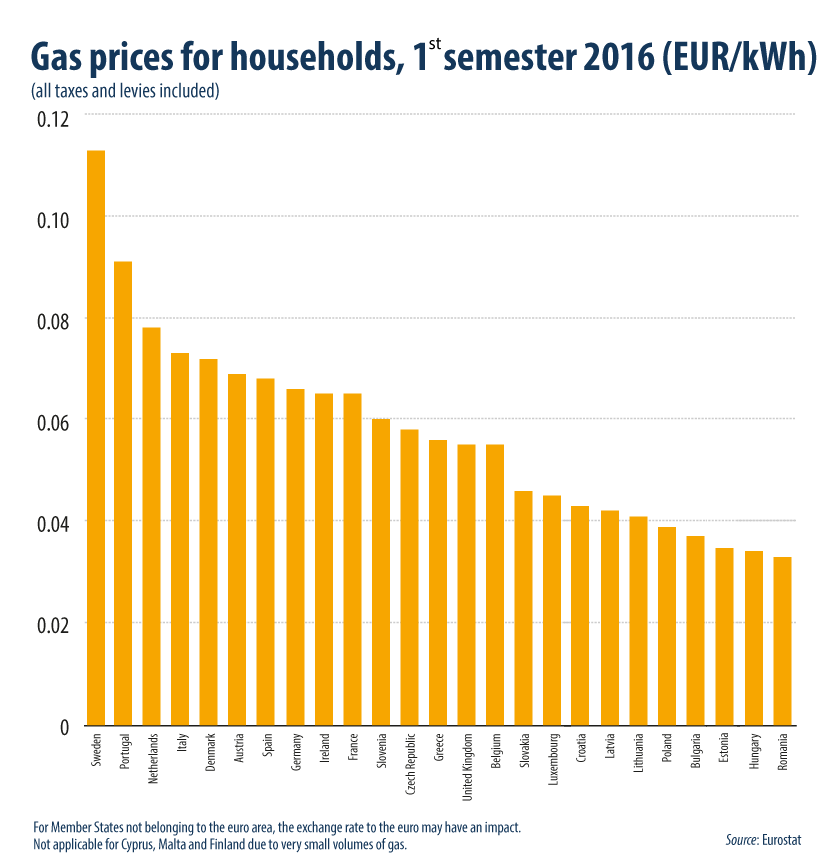
For medium size household consumers, natural gas prices including taxes and levies were highest in the first semester of 2016 in Sweden (EUR 0.11 per kWh) and Portugal (EUR 0.09 per kWh) and lowest in Romania, Hungary and Estonia (all EUR 0.03 per kWh).Taxes and levies make up 47 % in Romania and 46 % of gas prices in Sweden, however around a quarter in Portugal and Estonia and a fifth in Hungary.
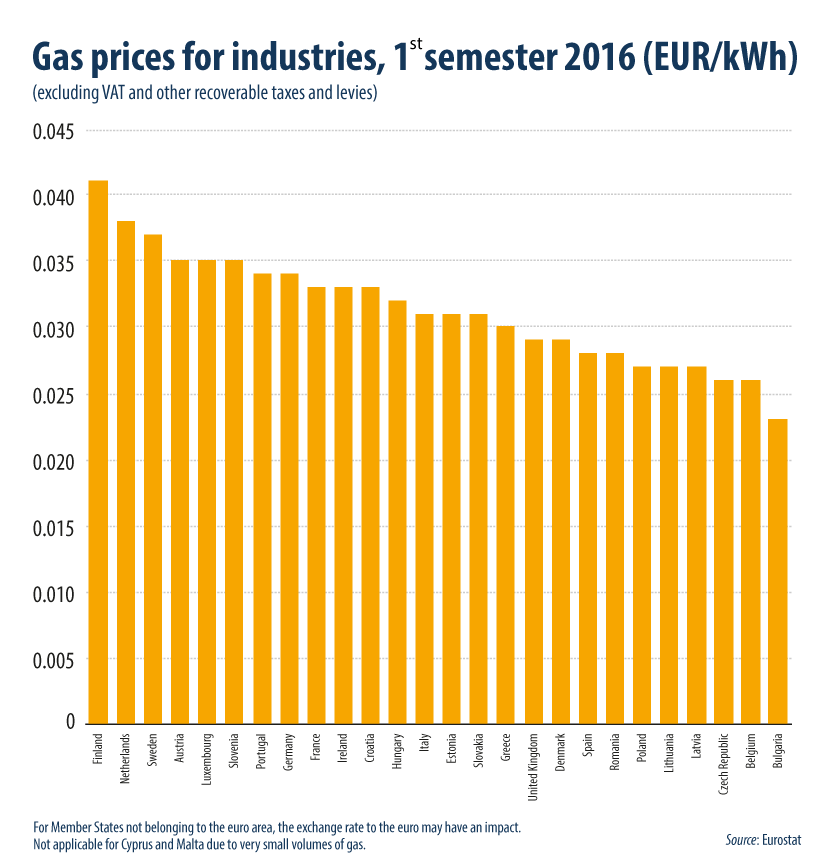
Gas prices for industrial consumers highest in Finland and the Netherlands
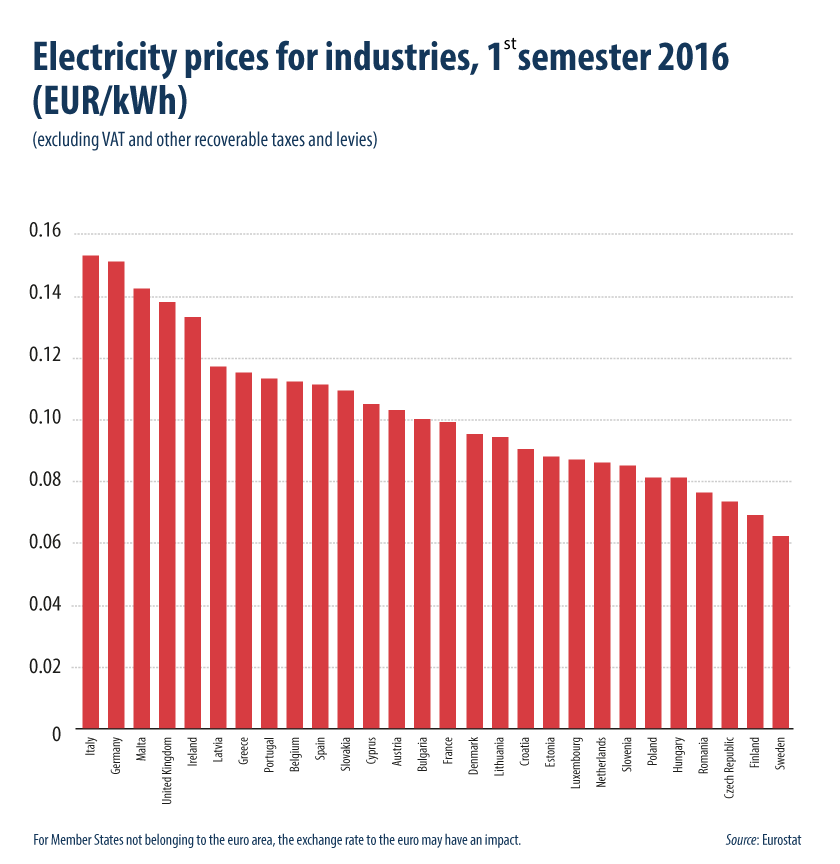
For industrial consumers, electricity prices (excluding VAT and other recoverable taxes and levies) in the first semester of 2016 ranged from EUR 0.15 per kWh in Italy and Germany to EUR 0.06 per kWh in Sweden.
For industrial consumers, natural gas prices (excluding VAT and other recoverable taxes and levies) in the first semester of 2016 were highest in Finland (EUR 0.041 per kWh) and the Netherlands (EUR 0.038 per kWh) and lowest in Bulgaria (EUR 0.023 per kWh).
For petrol, diesel and heating oil prices, see the Oil bulletin of the Directorate-General for Energy of the European Commission.


