Further information

    Shedding light on energy in the EU - A guided tour of energy statistics is a digital publication released by Eurostat, the statistical office of the European Union.

    For further information

    The dedicated section on energy on the Eurostat website.

    Articles on energy in Statistics Explained.

    Information on data

    Date of data extraction: April 2017 for text and all infographics, maps and animations. The Sankey diagram is continuously updated.

    Contact

    If you have questions on the data, please contact the Eurostat User Support.

    Identifiers of the digital publication:

    Catalogue number: KS-02-17-394-EN-Q
    ISBN 978-92-79-67982-7
    Doi: 10.2785/208379

    © European Union, 2017
    Cover photo: © Shutterstock - copyright Capitanoseye - Image number: 315873152
    Menu icons: © Flaticon

    Cookie policy

    Privacy policy

    Legal notice

4. What are the links between energy and the environment?

4.1 How are emissions of greenhouse gases by the EU evolving?

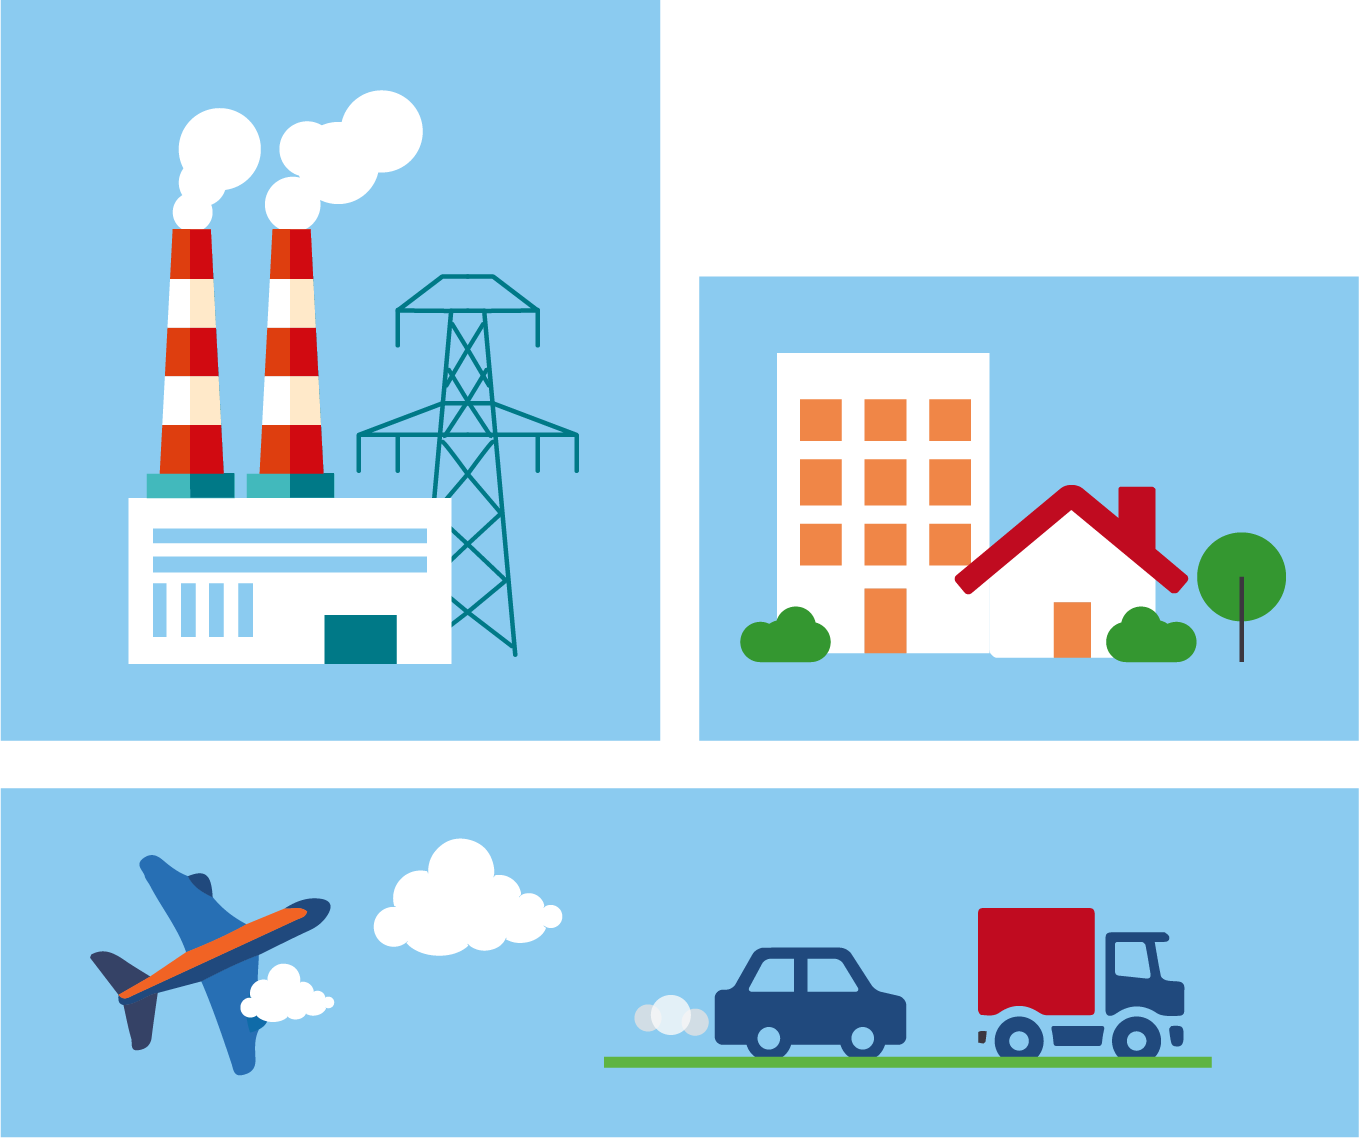
Climate change is a threat to sustainable development. After years of extensive research, the scientific community agrees that man-made greenhouse gas (GHG) emissions are the dominant cause of the Earth’s average temperature increases over the past 250 years (IPCC, 2014).

4.2 How efficient are we in our consumption of energy?

One of the priorities of the Energy Union strategy is to increase energy efficiency in an attempt to reduce energy consumption by 20 % by 2020. Energy intensity is a measure of an economy’s energy efficiency and shows how much energy is needed in order to produce a unit of gross domestic product (GDP).

4.3 What is the share of renewable energy in the EU?

The share of renewable energy in energy consumption increased continuously between 2004 and 2015, from 8.5 % to 16.7 %, approaching the Europe 2020 target of 20 % by 2020.