Further information

    Shedding light on energy in the EU - A guided tour of energy statistics is a digital publication released by Eurostat, the statistical office of the European Union.

    For further information

    The dedicated section on energy on the Eurostat website.

    Articles on energy in Statistics Explained.

    Information on data

    Date of data extraction: April 2017 for text and all infographics, maps and animations. The Sankey diagram is continuously updated.

    Contact

    If you have questions on the data, please contact the Eurostat User Support.

    Identifiers of the digital publication:

    Catalogue number: KS-02-17-394-EN-Q
    ISBN 978-92-79-67982-7
    Doi: 10.2785/208379

    © European Union, 2017
    Cover photo: © Shutterstock - copyright Capitanoseye - Image number: 315873152
    Menu icons: © Flaticon

    Cookie policy

    Privacy policy

    Legal notice

3. which type of energy do we consume?

3.1 What kind of energy do we consume in the EU?

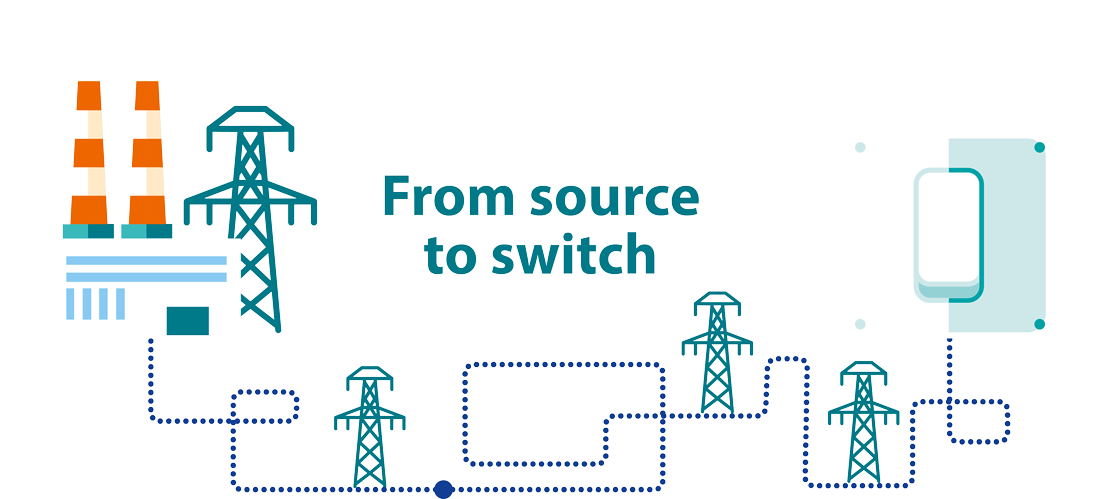
Out of the total energy available in the EU, around two thirds are consumed by end users, for example EU citizens, industry, transport etc. The difference – around one third – is mainly used for electricity generation and in other energy transformation processes. An example of a transformation process is crude oil being refined at refineries to become petroleum products.

3.2 What is the source of the electricity we consume?

Almost half of the electricity consumed in the EU comes from power stations burning combustible (renewable and non-renewable) fuels. Around 22 % of the final energy we consume is electricity and it comes from different sources.

3.3 How much does the energy we consume cost?

For medium size household consumers, electricity prices including taxes and levies were the highest in the first semester of 2016 in Denmark (EUR 0.31 per kWh), Germany (EUR 0.29 per kWh) and Belgium (EUR 0.25 per kWh), while the lowest prices were recorded in Bulgaria (EUR 0.10 per kWh) and Hungary (EUR 0.11 per kWh).