Further information

    Shedding light on energy in the EU - A guided tour of energy statistics is a digital publication released by Eurostat, the statistical office of the European Union.

    For further information

    The dedicated section on energy on the Eurostat website.

    Articles on energy in Statistics Explained.

    Information on data

    Date of data extraction: April 2017 for text and all infographics, maps and animations. The Sankey diagram is continuously updated.

    Contact

    If you have questions on the data, please contact the Eurostat User Support.

    Identifiers of the digital publication:

    Catalogue number: KS-02-17-394-EN-Q
    ISBN 978-92-79-67982-7
    Doi: 10.2785/208379

    © European Union, 2017
    Cover photo: © Shutterstock - copyright Capitanoseye - Image number: 315873152
    Menu icons: © Flaticon

    Cookie policy

    Privacy policy

    Legal notice

2. what energy is available in the EU?

2.1 Where does our energy come from?

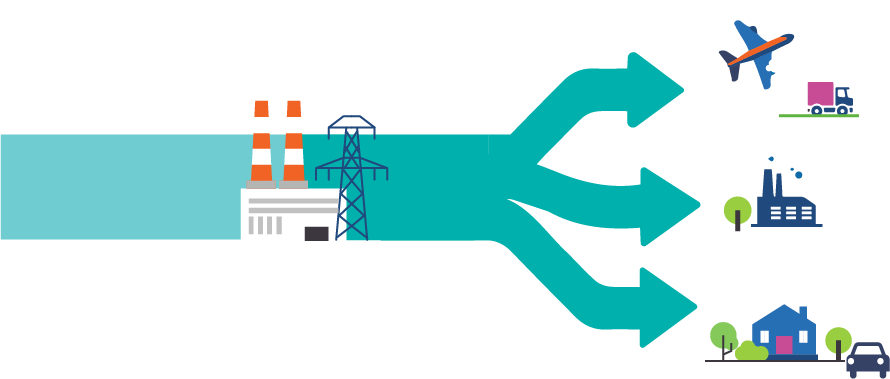
The energy available in the European Union comes from energy produced in the EU and from energy imported from third countries. In 2015, the EU produced around one third (34 %) of its own energy, while around two thirds (66 %) were imported.

2.2 What do we produce in the EU?

The production of energy in the EU is spread across a range of different energy sources: solid fuels (largely coal), natural gas, crude oil, nuclear energy and renewable energy (such as hydro, wind and solar energy).

2.3 From where do we import energy and how dependent are we?

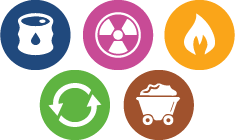
For its own consumption, the EU also needs energy which is imported from third countries. In 2015, the main imported energy product was petroleum products (including crude oil, which is the main component), accounting for almost two thirds of energy imports into the EU, followed by gas (23 %) and solid fuels (10 %).

2.4 From source to use - what are the energy flows?

The energy flows are shown through a Sankey diagram, which is a graphic illustration displaying the whole energy process.
The Sankey diagram will be displayed in a new tab.

eurostat-logo