3.1 What kind of energy do we consume in the EU?
Out of the total energy available in the EU, around two thirds are consumed by end users, for example EU citizens, industry, transport etc.. The difference – around one third – is mainly lost during electricity generation and distribution, used to support energy production processes or in non-energy uses (like asphalt or bitumen).
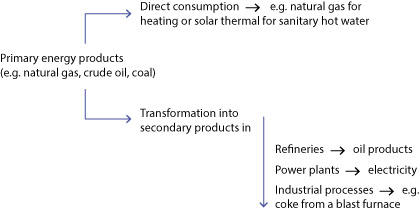
To properly interpret energy statistics, it is necessary to distinguish between primary and secondary energy products. A primary energy product is extracted or captured directly from natural resources, such as crude oil, firewood, natural gas or coal. Secondary energy products (such as electricity or motor gasoline) are produced as a result of a transformation process, either from a primary or from a different secondary energy product.
Flow of energy products from production to final consumption

Petroleum products are the most consumed
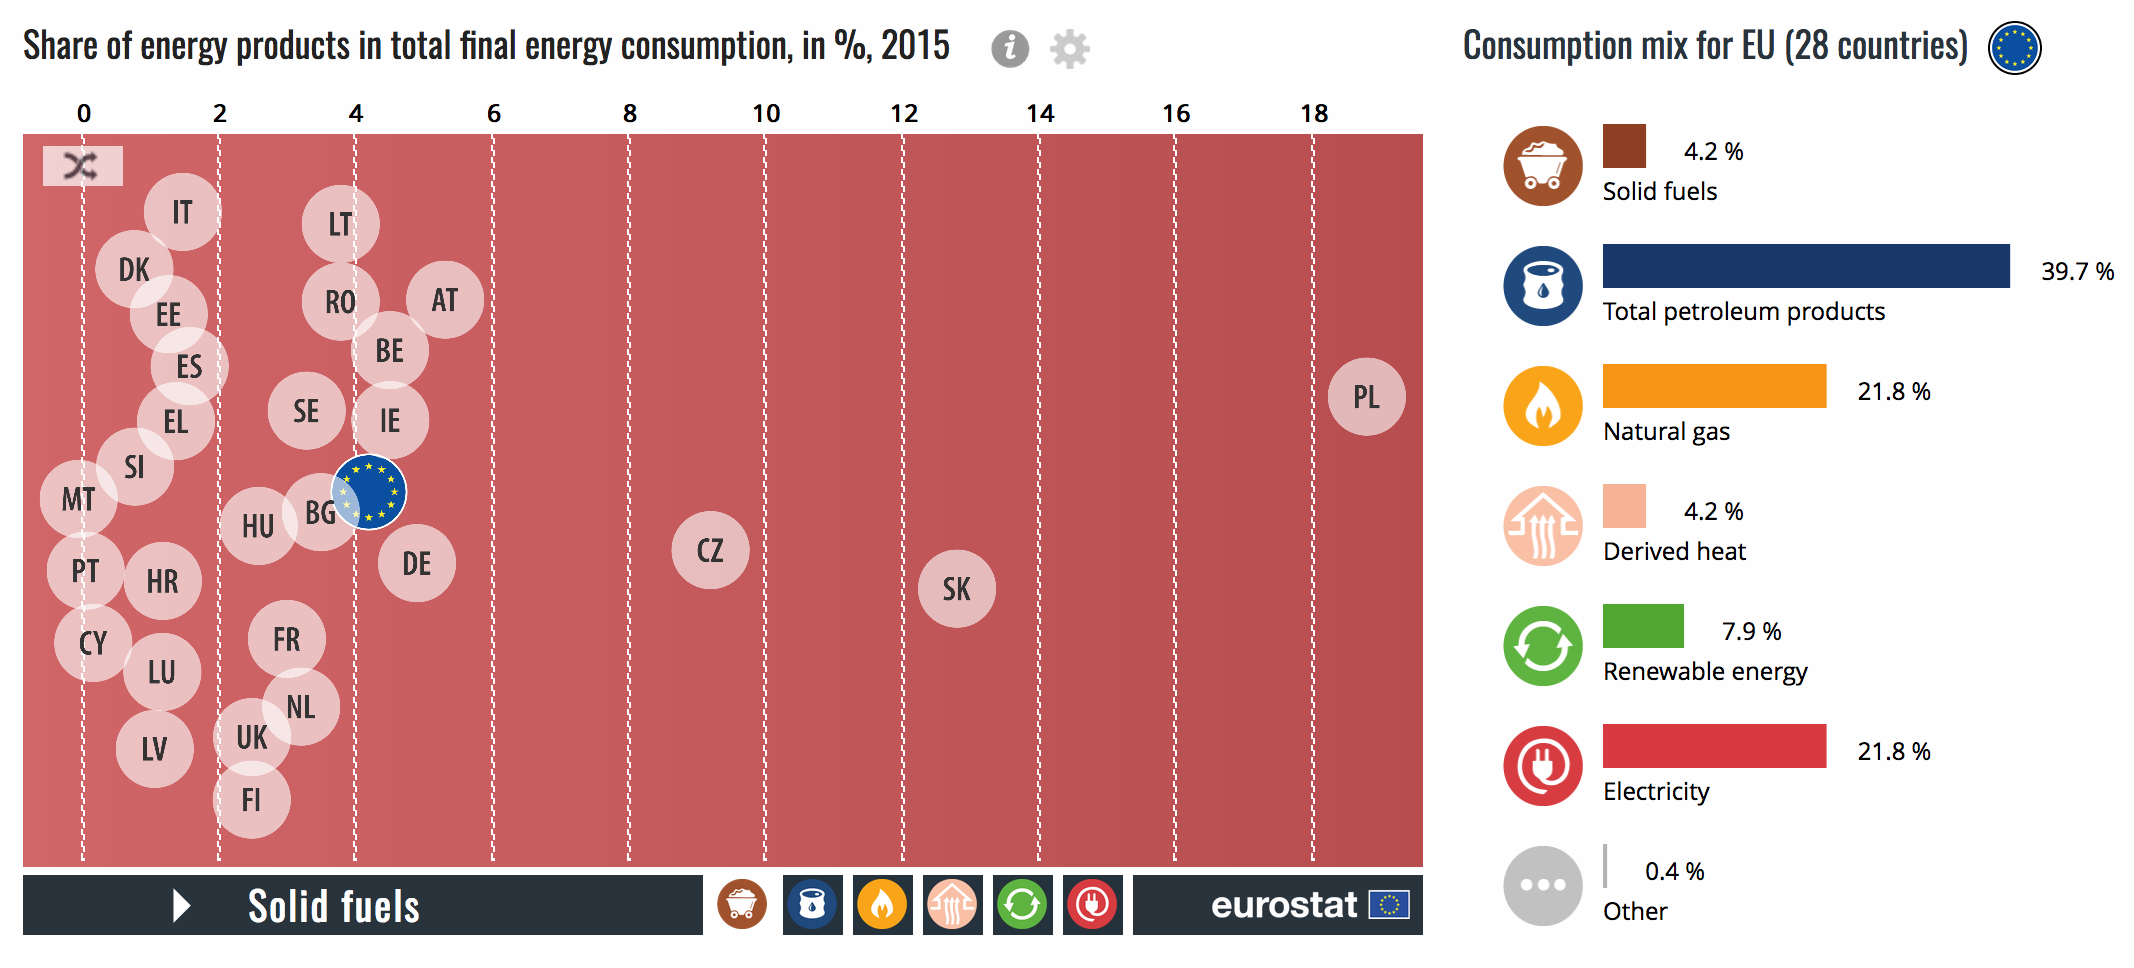
In the EU in 2015, petroleum products (such as heating oil, petrol, diesel fuel), which represent 40 % of final energy consumption were the most consumed, followed by electricity and natural gas (22 % each), direct use of renewables (not transformed into electricity, e.g. wood, solar thermal, geothermal or biogas for space heating or hot water production) (8 %), solid fossil fuels (mostly coal) and derived heat (such as district heating) (4 % each). The real consumption of renewable energy is higher than 8 %, because other renewable sources are included in electricity (e.g. hydropower, wind power or solar photovoltaic).
Within the EU Member States, the final energy consumption pattern varies considerably. Petroleum products reach over 65 % of final energy consumption in Cyprus, Malta and Luxembourg, while gas accounts for 30 % and over in the Netherlands, Hungary and Slovakia. Renewable energies reach 20 % and over in Latvia, Finland and Sweden, while the consumption of electricity in Sweden and Malta accounts for over 30 % of their final energy consumption.
The transport sector consumes a third of the final energy consumption in the
EU
Energy is consumed by different sectors of the economy: households (i.e. energy consumed in the residential sector), transport (e.g. rail, road, domestic aviation or inland shipping), industry, services (including commercial and public services) and agriculture & forestry.
Looking at which sectors in the EU consume the most energy, the transport sector (33 % of final energy consumption) consumes the most energy, followed by industry (25 %), households (25 %), services (14 %) and agriculture & forestry (2 %).
