2.3 From where do we import energy and how dependent are we?
What do we import?
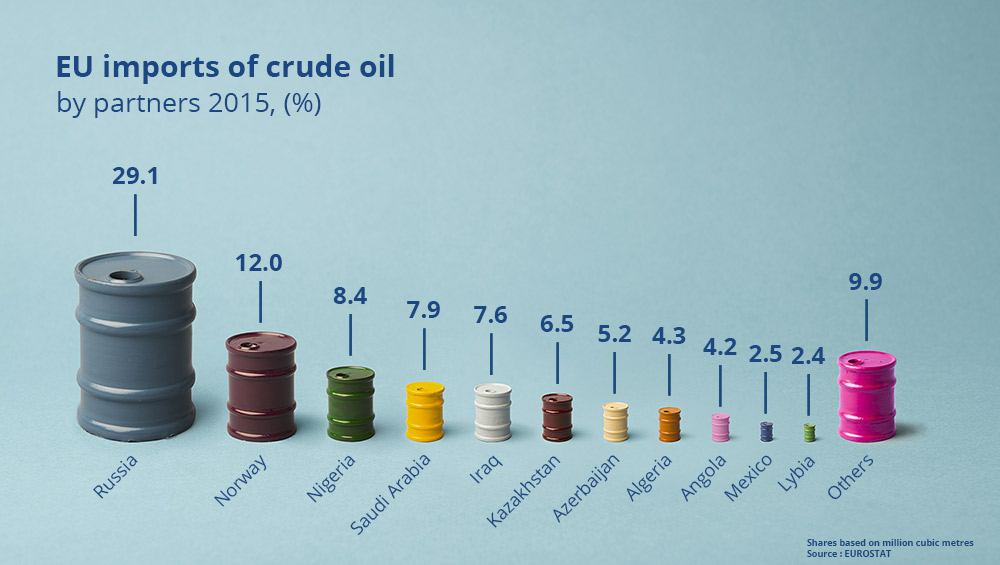
For its own consumption, the EU also needs energy which is imported from third countries. In 2015, the main imported energy product was petroleum products (including crude oil, which is the main component), accounting for almost two thirds of energy imports into the EU, followed by gas (23 %) and solid fuels (10 %).
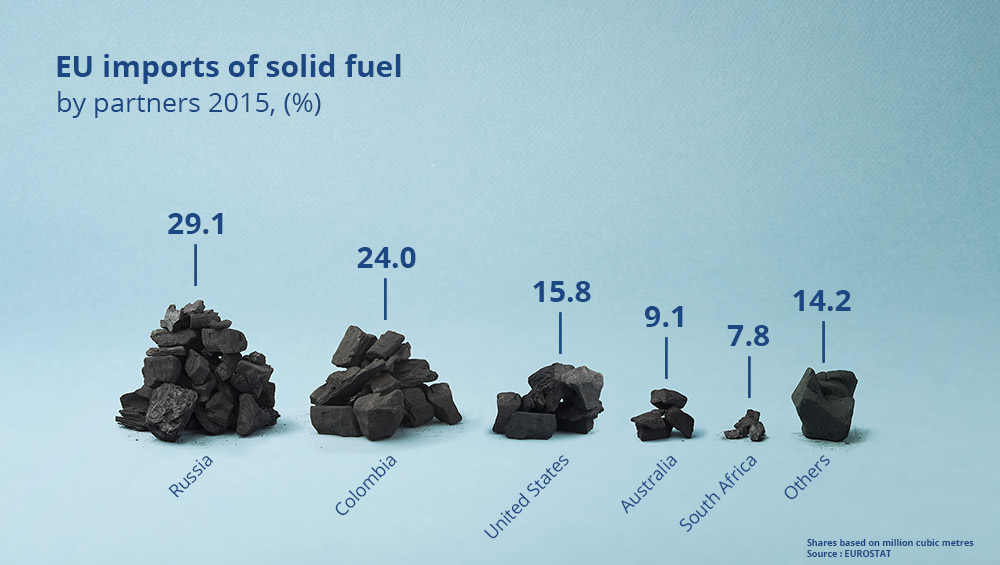
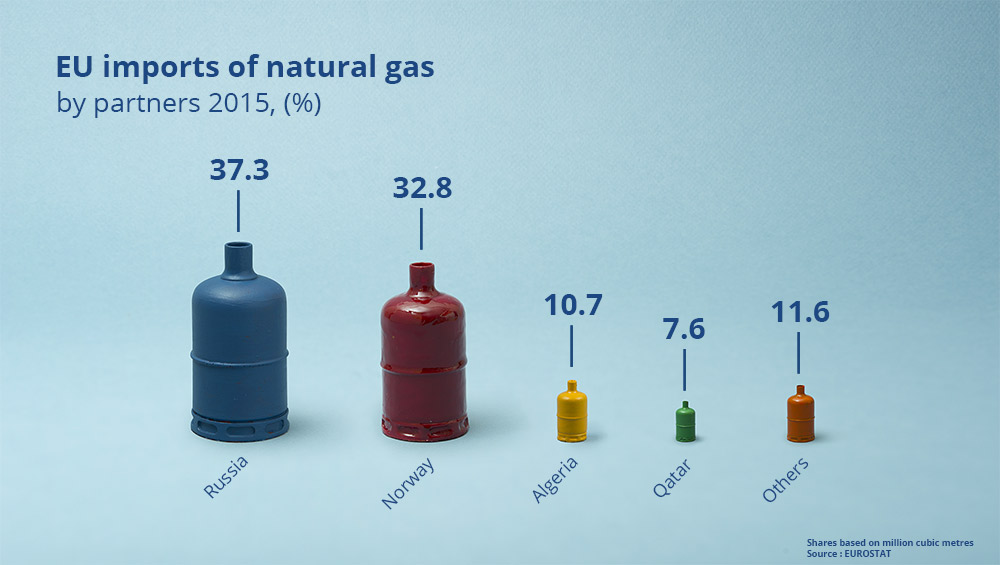
Russia is the main EU supplier of crude oil, natural gas and solid fuels
The stability of the EU’s energy supply may be threatened if a high proportion of imports are concentrated among relatively few external partners. In 2015, almost two thirds of the extra-EU's crude oil imports came from Russia (29 %), Norway (12 %), Nigeria, Saudi Arabia and Iraq (all 8 %). Kazakhstan (7 %) followed. A similar analysis shows that more than three quarters of the EU's imports of natural gas came from Russia (37 %), Norway (33 %) and Algeria (11 %), while almost three quarters of solid fuel (mostly coal) imports originated from Russia (29 %), Colombia (24 %) and the United States (16 %).
Different patterns among the EU Member States
More than 80 % of energy imports are petroleum products in Malta, Cyprus, Greece, Sweden and Romania and around a third or more is gas in Germany and Italy. More than 15 % of energy imports are solid fuels in Slovakia and Germany.
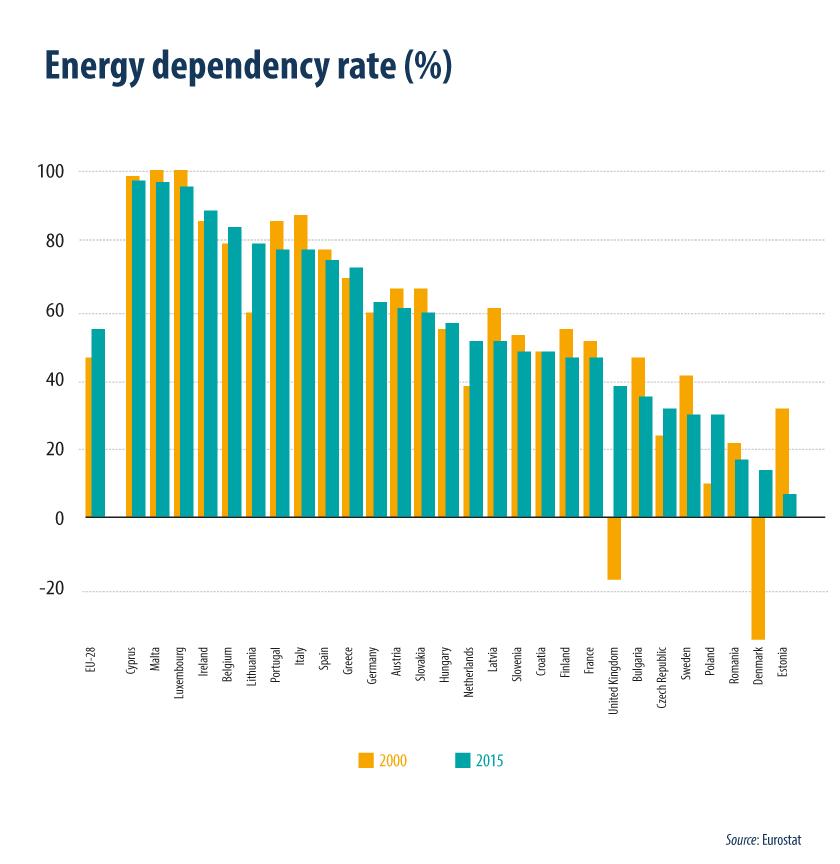
How dependent are we from energy produced outside the EU?
The dependency rate shows the extent to which an economy relies upon imports in order to meet its energy needs. It is measured by the share of net imports (imports - exports) in gross inland energy consumption (meaning the sum of energy produced and net imports). In the EU in 2015, the dependency rate was equal to 54 %, which means that more than half of the EU’s energy needs were met by net imports. This rate ranges from over 90 % in Malta, Luxembourg and Cyprus to below 20 % in Estonia, Denmark and Romania. The dependency rate on energy imports has increased since 2000, when it was just 47 %.
As mentioned in the part dealing with energy imports, the EU mainly depends on Russia for imports of crude oil, natural gas and solid fuels, followed by Norway for crude oil and natural gas.