European Statistical Recovery Dashboard: September edition

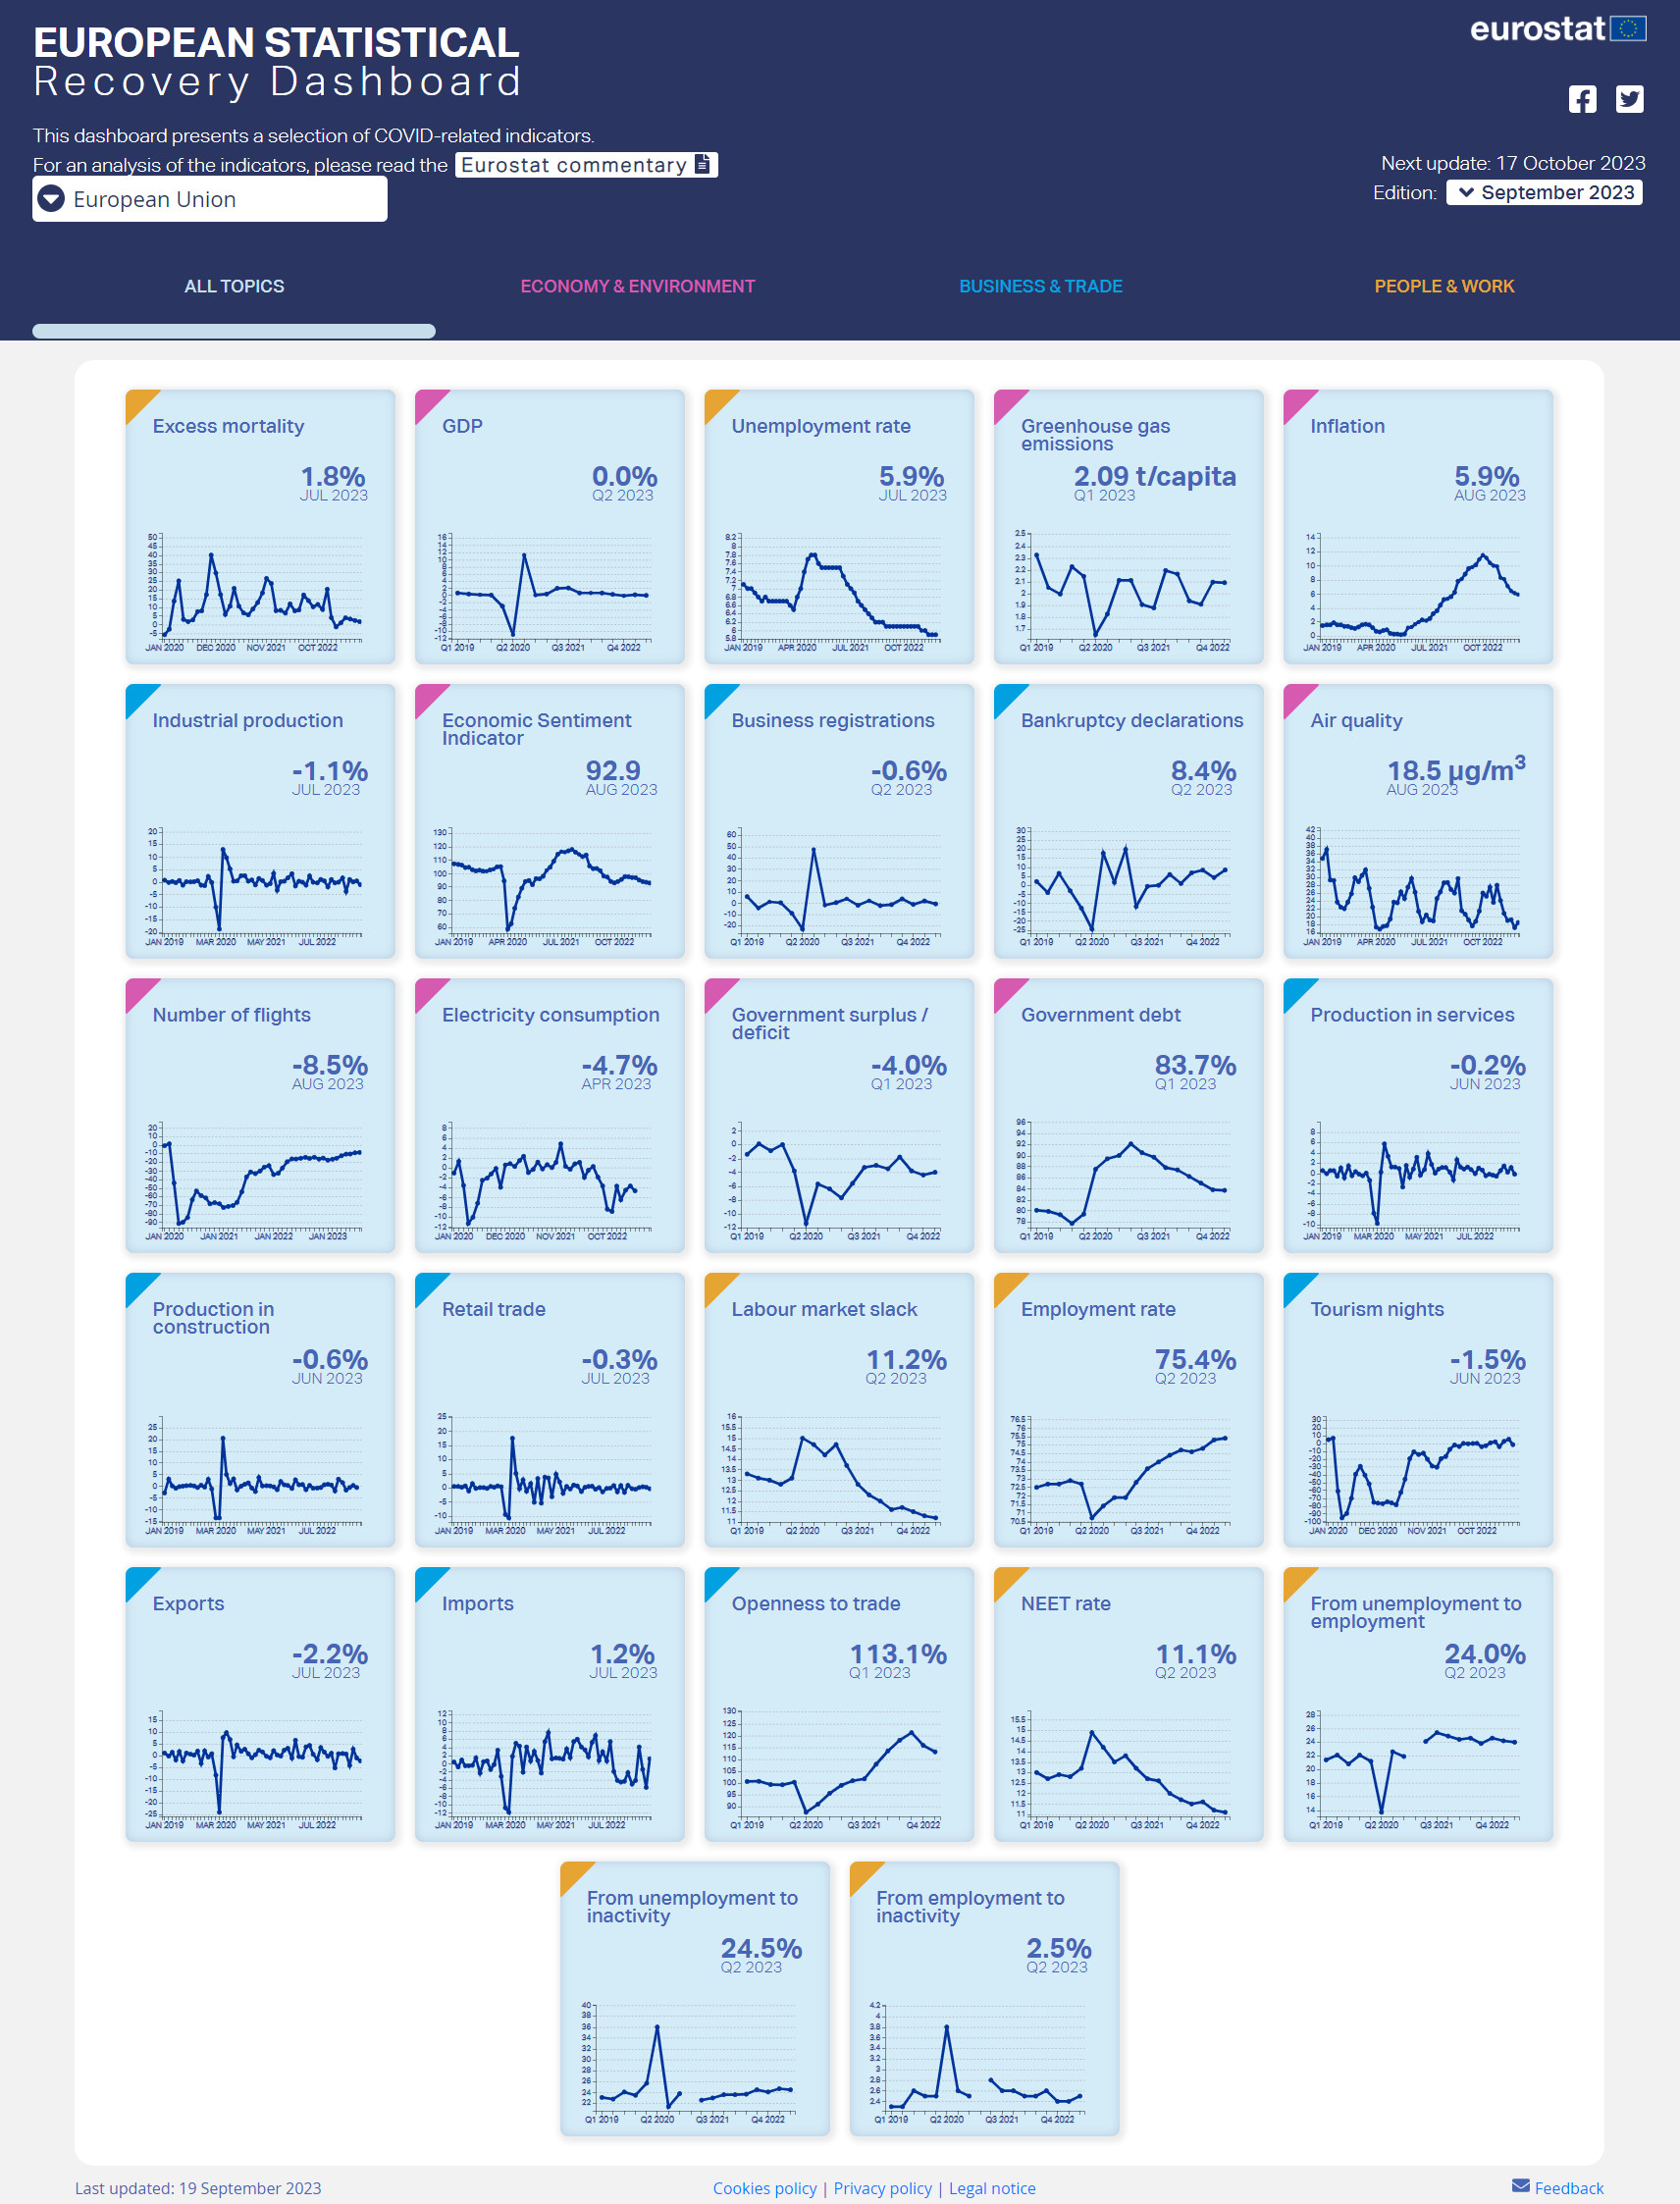
Today, Eurostat released the September edition of the interactive European Statistical Recovery Dashboard.
The dashboard contains monthly and quarterly indicators from a number of statistical areas relevant to tracking the economic and social recovery from the COVID-19 pandemic, across countries and time.
September highlights: Slowing growth momentum alongside declining inflation and a resilient labour market
EU industrial production and retail trade both declined in July 2023, following stable GDP in Q2 2023. Moreover, production in services fell in June 2023. While these indicators remain above their pre-pandemic levels, they signal slowing growth momentum in the EU economy. This trend, however, unfolds against a backdrop of declining inflation and a resilient labour market.
EU inflation declined for the tenth consecutive month in August 2023, reaching 5.9%.
The EU labour market maintained its robust performance, with the unemployment rate remaining at a historically low level in July 2023, after a slight decrease in labour market slack and a marginal increase in employment in Q2 2023.
In August 2023, EU economic sentiment declined for the seventh consecutive month, slipping further below its pre-pandemic level. This decrease was due to lower confidence among consumers and among managers in all the economic sectors.
At the EU level, excess mortality declined in July 2023, continuing at a relatively low rate.
You can read the full analysis by clicking “Eurostat commentary” on the dashboard’s header.
The dashboard is updated every month with the latest available data for each indicator.
We value your insights and would appreciate hearing about your experience with the European Statistical Recovery Dashboard. Please provide your response to our anonymous survey. Your responses will guide us in enhancing the dashboard for future use.
The line charts in the dashboard offer many functionalities to easily explore and analyse the development of the indicators, such as displaying a longer time series, comparing several countries and downloading the customised chart or the source dataset.
For more information
- Statistics Explained article on Eurostatistics - data for short-term economic analysis
- Thematic section on COVID-19
If you have any queries, please visit our contact us page.

