Short-term progress towards the SDGs
Data extracted in April 2024.
Planned article update: June 2025.
Highlights
This article is a part of a set of statistical articles, which are based on the Eurostat publication ’Sustainable development in the European Union — Monitoring report on progress towards the SDGs in an EU context — 2024 edition’. This report is the eighth edition of Eurostat’s series of monitoring reports on sustainable development, which provide a quantitative assessment of progress of the EU towards the SDGs in an EU context.
Full article
Sustainable development warrants a strong foundation for socio-economic stability supported by peace and security. Since 2020, the world has been marred by multiple events with the potential to affect the progress towards the goals set by the 2030 Agenda for Sustainable Development. These include the COVID-19 pandemic, Russia’s war of aggression against Ukraine and the related price hikes, especially for energy. In addition to these relatively short-term adversities, global climate change has been intensifying, with 2023 being the hottest year on record. In light of these turmoils, the role of the EU and its policies in extending support to Ukraine, transitioning to a healthy planet and a new digital era, securing economic prosperity and strengthening the role of the EU on the global stage is seen as crucial by its citizens to maintaining peace, security, economic growth and co-operation within its Member States [1]. The analysis in this chapter illustrates short-term trends related to the EU’s progress towards the SDGs, using additional breakdowns and more granulated time series of the EU SDG indicators, as well as other short-term statistics, to illustrate the impact of the most recent events on the lives of Europeans.
The increase in consumer prices across the EU has slowed in recent months
The Russian invasion of Ukraine in February 2022 hit at a time when Europe was just recovering from the economic disruptions caused by the COVID-19 pandemic. Following the measures put in place to combat the pandemic in 2020, Russia’s military aggression against Ukraine has exerted a notable economic and societal influence on the EU (SDG 1, SDG 2, SDG 8, SDG 10 and SDG 12) , impacting households across the region.
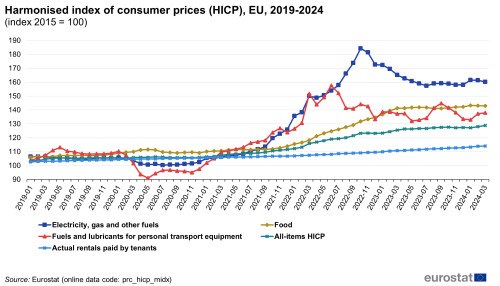
One of the most significant impacts can be seen in the rising prices for goods and services in the EU since the start of 2021 (see Figure 1). Despite a period of relative price stability observed in the final quarter of 2023 and the first three months of 2024, the overall price index for commodities surged by 21 % between January 2021 and March 2024. This dynamic was largely determined by the increase in prices for electricity, gas and other fuels, which rose at the onset of the war and stabilised thereafter following a sequence of emergency Council regulations. Nevertheless, prices remained considerably higher than in early 2021. The price index for electricity, gas and other fuels increased unprecedentedly by 52 % between January 2021 and March 2024, peaking at a 75 % increase in October 2022. Food prices followed with a steady increase of 30 % since January 2021, seeing a particularly sharp rise between February 2022 and March 2023. Actual rental payments made by tenants exhibited a slow but steady upward trend, with an increase of 8 % since January 2021 [2].

Note: y-axis does not start at 0.
Source: Eurostat (prc_hicp_midx)
The impact of the rise in prices on the standard of living have been felt by the public. According to quarterly data on living conditions collected in nine Member States [3], more than 50 % of the population (in age group 16 to 64) surveyed in Bulgaria, Slovakia, Italy, Ireland and Slovenia could make ends meet only with some to great level of difficulty in the last quarter of 2022. Bulgaria observed the highest share (75.3 %) whereas Finland observed the lowest (34.9 %). Moreover, in all surveyed countries more than 40 % of the population reported that their income had remained more or less stable within the last 12 months preceding the survey, which entails a significant loss of purchasing power due to rising prices. In the last quarter of 2022, among the countries surveyed, the share of the population that experienced an increase in income ranged between 7.6 % in Italy and 27.5 % in Ireland, whereas the share of those who reported a decrease in income ranged from 6.7 % in Bulgaria to 35 % in Austria. Nevertheless, overall life satisfaction remained relatively stable over all quarters of 2022 across all countries surveyed.
The EU is on the path to diversify its energy sources
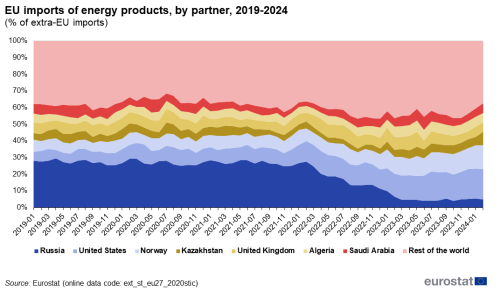
Russia’s invasion of Ukraine at the beginning of 2022 and the consequent sanctions have impacted the international trade in goods, most noticeably causing disruptions in the trade of oil, natural gas and coal (SDG 7). Throughout 2019, 2020 and 2021 and until the first quarter of 2022, Russia had been the EU’s largest single source of energy imports, accounting for between 26 % and 28 % of total EU energy imports from its extra-EU partners (see Figure 2). Owing to the sanctions and several policy actions, most notably REPowerEU and emergency Council regulations to warrant security of energy supply, this share declined substantially starting from the second quarter of 2022. By the beginning of 2024 (January and February), the share of energy imports from Russia had fallen to 5.1 % of total extra-EU imports. In turn, energy imports from other countries, in particular from the United States and Norway, increased to compensate for the decline in imports from Russia. In January and February 2024, the largest shares of extra-EU energy imports came from the United States (18.0 %), Norway (14.3 %), Kazakhstan (6.5 %), Algeria and the United Kingdom (5.8 % each) as well as Saudi Arabia (5.5 %) [4].

Source: Eurostat (ext_st_eu27_2020sitc)
Despite the increasing importance of renewable energy sources, crude oil and petroleum products continue to be fundamental to maintaining economic stability in the EU. As a result, ensuring energy security in the EU necessitates holding emergency oil stocks to be relied on in times of need, especially given the ongoing geopolitical instability. The stocks reached a historical low in June 2022 at 101.1 million tonnes, recording a 10.3 % decrease relative to June 2021. Since then, the EU has increased its stocks by 7.2 %, amounting to 108.2 million tonnes as of May 2023 [5].
The EU granted temporary protection to those displaced by the Russian invasion of Ukraine
In addition to its effects on the economy and trade in energy, the Russian military aggression against Ukraine has left in its wake an influx of displaced people from the territories affected by invasion (SDG 10) who have sought refuge in the EU. To address this displacement, the Council Decision of March 2022 activated the Council Directive 2001/55/EC known as the Temporary Protection Directive [6], an EU emergency scheme used in exceptional circumstances of a mass influx to (a) provide immediate and collective protection to displaced persons and (b) reduce pressure on the national asylum systems of EU countries. On 28 September 2023, the European Council agreed to extend the temporary protection for people fleeing from Russia’s war of aggression against Ukraine from 4 March 2024 to 4 March 2025 [7].

Source: Eurostat (migr_asytpsm) and (migr_asytpspop)
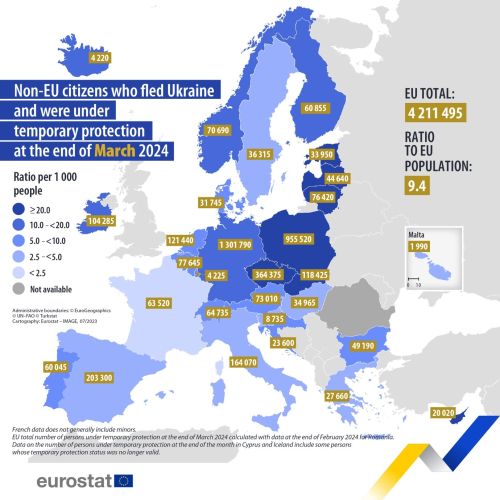
At the end of March 2024, about 4.2 million displaced people from Ukraine were beneficiaries of this temporary protection by the EU. Germany, Poland and Czechia hosted the highest absolute number of beneficiaries, providing temporary protection for more than 60 % of all beneficiaries in the EU. Czechia, Lithuania, Poland, Estonia and Latvia provided the highest temporary protection relative to their populations. In 2023, the number of non-EU citizens with temporary protections in the EU grew by almost half a million. As of March 2024, a large proportion of temporary protection seekers were adult women (mainly aged 35 to 64 years), representing 45.8 % of the total beneficiaries. The second largest group were children, amounting to 32.8 % of the beneficiaries. Of the countries for which data are available, Austria, Belgium and Lithuania granted the most temporary protections to unaccompanied minors in the EU. Most of the people who fled Ukraine and were under temporary protection in the EU at the end of February 2024 were Ukrainian (98.2 %). Other non-EU citizens receiving temporary protection were mainly from Russia (0.30 %), Nigeria (0.13 %) and Azerbaijan (0.11 %) [8].
While Ukrainian citizens fleeing the war zone have benefitted from the temporary protection scheme, other refugees are registered as asylum applicants [9]. The number of asylum applicants from Russia has grown, recording 1 195 first-time applicants in January 2024. In the same month, the EU received 1 475 applications from Ukraine. Furthermore, the influx of refugees from the Middle East has intensified after the Hamas-Israeli war. In November 2023, the EU received 1 700 first-time applicants from Palestine and 140 from Israel. In January 2024, 1 170 applicants from Palestine and 95 from Israel were registered. Overall, the highest numbers of asylum applications continue to come from Syria, with 13 445 first-time applicants in January 2024, followed by 7 185 applicants from Afghanistan and 6 380 applicants from Türkiye [10].
The EU continues to reduce its greenhouse gas emissions in the face of intensifying climate change
As the effects of climate change become more evident, the EU is striving to cut greenhouse gas (GHG) emissions towards its ambition of climate neutrality. Recent developments in mean temperature and weather extremes underline the importance of these actions. Earth’s average temperature reached a new record high in 2023 [11] and the frequency and intensity of heatwaves has accelerated by human-caused climate change. Measurements of mean near-surface temperature show that Europe is warming even faster than the global average, and that several regions in Europe are projected to become hotspots for multiple climate risks in the absence of urgent actions [12]. Without adequate mitigation and adaptation, the death-toll due to extreme heat in the EU could increase 30-fold until the end of the century [13]. In light of these projections, the EU has adopted the European climate law, which obliges EU countries to collectively cut greenhouse gas emissions by at least 55 % by 2030 and reach climate neutrality by 2050.
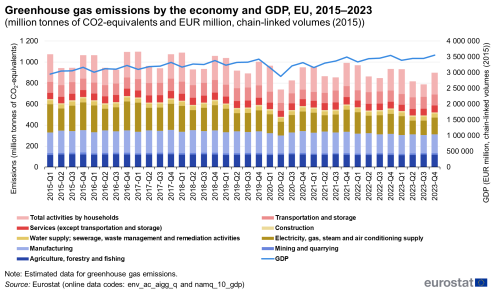
Quarterly data from Eurostat’s air emissions accounts [14] show that the EU’s overall greenhouse gas emissions have declined since the beginning of 2022 (see Figure 3), indicating that the EU has managed to continue the long-term reduction of its GHG emissions. Alongside a slight 0.2 % increase in GDP [15], the EU’s greenhouse gas emissions are estimated to have decreased by 4.0 % in the fourth quarter of 2023 compared with the same quarter of 2022. In the fourth quarter of 2023, the economic sectors with the highest share of greenhouse gas emissions were households (22.9 %), manufacturing (19.9 %) and electricity and gas supply (17.7 %). Between the fourth quarters of 2022 and 2023, greenhouse gas emissions fell strongest in electricity and gas supply, by 17.2 %, and in the manufacturing sector, by 3.1 % [16].

Source: Eurostat (online data codes: (env_ac_aigg_q) and (namq_10_gdp))
Outlook of EU surveys on public perception and priorities
With the onset of the COVID-19 crisis and through the sequel of social, economic and environmental shocks that hit the EU thereafter, an unprecedented package of coordinated EU responses has been put forward and intensively deployed. In June 2021, the Commission inaugurated NextGenerationEU, an EUR 800 billion temporary instrument to support economic recovery and build a greener, more digital and resilient future. At its heart is the Recovery and Resilience Facility, which raises funds to enable Member States to make their economies and societies more sustainable and resilient in the face of challenges such as the global energy market disruption caused by Russia’s invasion of Ukraine.
The main concerns of Europeans in the end of 2023 were the war in Ukraine, immigration, the international situation, inflation and the cost of living, climate change, and the economic situation. Nevertheless, about 44 % of the respondents expect the economic situation in the EU in the coming 12 months to remain the same and 61 % of EU citizens surveyed remain optimistic about the future of EU [17].
In the face of these complex shocks to the EU’s economies and societies, the perception of people towards the EU, its policy actions and the impact it has on their lives becomes even more relevant. In light of the measures the EU put in place to alleviate the impacts of ongoing crises, 70 % of EU citizens believe that actions taken by the EU have an impact on their everyday lives. Most EU citizens would like the European Parliament to play a more important role in defending democracy, human rights and freedom of speech, with 36 % of respondents prioritising the fight against poverty and social exclusion, 34 % public health and 29 % climate change and creation of new jobs. Almost three quarters (73 %) of the EU citizens anticipate a decline in standard of living over the next year, while 37 % already experience difficulties paying bills either sometimes or most of the times [18]. These findings are also confirmed by the Economic Sentiment Indicator on the current economic situation and expectations about the future: after peaking in October 2021 at 118.7, the index declined by 25.4 points and reached its lowest level in October 2022 at 93.3. Thereafter, it remained relatively stable in the EU, reaching 96.2 in March 2024 [19].
Over the year of 2023, the set of policies put in place by the EU and its Member States have helped to overcome several impacts of the recent events. During this period, the EU showed some signs of stabilisation over all three dimensions of sustainability – economic, environmental and social – as exemplified in the steadying of prices and the diversification of energy sources. These trends suggest the EU is slowly recovering from the distress caused by the pandemic and the onset of the Russian invasion of Ukraine, even though the reverberations of these events are still being felt by the EU’s citizens. At the same time, the EU has also reduced its greenhouse gas emissions in light of the intensified effects of global climate change.
Direct access to
More detailed information on EU SDG indicators for monitoring of progress towards the UN Sustainable Development Goals (SDGs), such as indicator relevance, definitions, methodological notes, background and potential linkages can be found in the introduction as well as in Annex II of the publication ’Sustainable development in the European Union — Monitoring report on progress towards the SDGs in an EU context — 2024 edition’.
Further reading on Short Term Crises
- Eurostat (2024), EU international trade in goods — latest developments.
- Eurostat (2024), Reduced levels of EU-Russia trade continue
- Eurostat (2024), Continued drop in EU imports of energy products.
- Eurostat (2024), People under temporary protection stable at 4.2 million
- Eurostat (2024), Oil import dependency at its highest in 2022.
- European Council, Infographic — EU temporary protection for displaced persons.
- Eurostat (2024), Statistics Explained: Temporary protection for persons fleeing Ukraine — monthly statistics.
- Eurostat (2024), Quarterly greenhouse gas emissions in the EU.
- EEA (2021), Impacts of COVID-19 on single-use plastic in Europe’s environment.
- EEA (2023), Europe’s air quality status 2023.
- European Parliament (2023), EP Autumn 2023 Survey: Six months before the 2024 European Elections.
- European Parliament (2023), Standard Eurobarometer 100 - Autumn 2023.
- International Organization for Migration (IOM) (2022). DTM Ukraine — Internal Displacement Report — General Population Survey Round 16 (April 2024). IOM, Ukraine.
Further data sources on Short Term Crises
Notes
- ↑ European Parliament (2023), EP Autumn 2023 Survey: Six months before the 2024 European Elections; European Commission (2024), The EU in 2023 – General report on the activities of the European Union, Publications Office of the European Union.
- ↑ Source: Eurostat (online data codes: (prc_hicp_midx).
- ↑ Eurostat (2023), Living conditions - quarterly statistics.
- ↑ Source: Eurostat (online data code: (ext_st_eu27_2020sitc)); and Eurostat (2024), EU international trade in goods — latest developments.
- ↑ Eurostat (2023), Emergency oil stocks statistics.
- ↑ European Parliament briefing on the Temporary Protection Directive summarises the legal basis and the scope of the Temporary Protection Directive and its implementation for people fleeing Ukraine.
- ↑ European Council (2023), Infographic — EU temporary protection for displaced persons.
- ↑ Source: Eurostat (online code: (migr_asytpsm)) and Eurostat (2024), Temporary protection for persons fleeing Ukraine — monthly statistics.
- ↑ Asylum application refers to a standard system whereby non-EU nationals can seek international protection in one of the Member States. Temporary Protection refers to an exceptional measure put in place to provide immediate and temporary protection in the event of a mass influx, so as to reduce the burden on the existing asylum systems.
- ↑ Source: Eurostat (online code: (migr_asyappctzm)).
- ↑ NASA (2024), NASA Analysis Confirms 2023 as Warmest Year on Record.
- ↑ European Environment Agency (2023), Global and European temperatures; and European Environment Agency (2024), European climate risk assessment: Executive Summary, EEA Report 01/2024, Publications Office of the European Union, Luxembourg.
- ↑ European Union (2020), Global warming and human impacts of heat and cold extremes in the EU, Publications Office of the European Union, Luxembourg.
- ↑ See Eurostat’s dedicated section on emissions of greenhouse gases and air pollutants for an explanation of the different measurement perspectives on air emissions (comprising accounts, inventories and footprints); also see the methodological note on Eurostat’s estimates of quarterly greenhouse gas emissions accounts. For a more detailed analysis of the quarterly GHG emissions data, see Eurostat (2024), Quarterly greenhouse gas emissions in the EU.
- ↑ Source: Eurostat (online code: (namq_10_gdp)).
- ↑ Source: Eurostat (online code: (env_ac_aigg_q)).
- ↑ European Commission (2023), Standard Eurobarometer 100 - Autumn 2023.
- ↑ European Commission (2023), EP Autumn 2023 Survey: Six months before the 2024 European Elections.
- ↑ Eurostat (2024), Eurostatistics – data for short-term economic analysis; and Eurostat (online data codes: (ei_bssi_m_r2)).