Enlargement countries - energy statistics
Data extracted in April 2023.
Planned article update: June 2024.
Highlights
Solid fuels were the main source of primary energy production in 2021 in the Western Balkans and Türkiye, except for Albania and Türkiye, where it was dominated by renewables and biofuels.
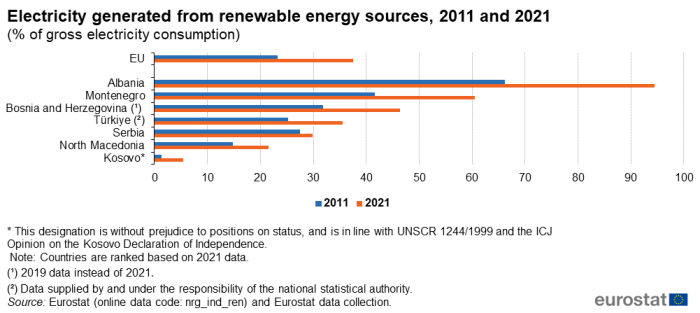
The shares of electricity generated from renewable energy sources were higher in Albania (94.4 %), Montenegro (60.5 %) and Bosnia and Herzegovina (46.4 % – 2019 data) than in the EU (37.5 %) in 2021.
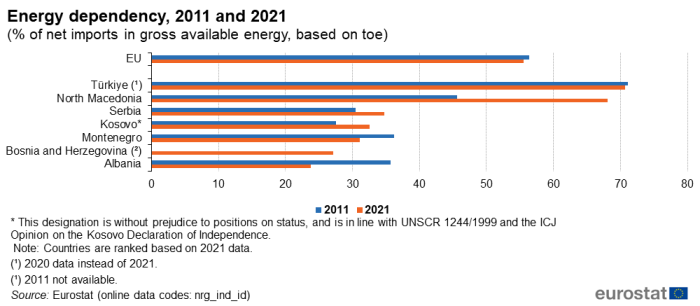
Türkiye (70.6 % – 2020 data) and North Macedonia (68.0 %) had a higher energy dependency rate than the EU (55.5 %) in 2021.
Electricity generated from renewable energy sources, 2011 and 2021 (% of gross electricity consumption)
This article is part of an online publication and provides information on a range of energy statistics for the Western Balkans and Türkiye and compares this with the corresponding data for the European Union (EU). Within this region, Bosnia and Herzegovina, Montenegro, North Macedonia, Albania, Serbia and Türkiye are candidate countries, while Kosovo has the status of potential candidate. Data for Georgia, Moldova and Ukraine, granted candidate status or European perspective by the European Council in June 2022, are not included in this article; Statistics Explained articles on the European Neighbourhood Policy-East countries are available here.
The article presents an overview of main energy indicators, notably primary energy production, trade of primary energy, and energy consumption, as well as information on the use of renewable energy sources for electricity generation.
* This designation is without prejudice to positions on status, and is in line with UNSCR 1244/1999 and the ICJ Opinion on the Kosovo Declaration of Independence.
Full article
Primary production
Energy commodities extracted or captured directly from natural resources are called primary energy sources, while energy commodities which are produced from primary energy sources in transformation plants are called derived products. Primary energy production covers the national production of primary energy sources and takes place when natural resources are exploited, for example, in coal mines, crude oil fields, hydropower plants, or in the fabrication of biofuels. Whenever consumption exceeds primary production, the shortfall needs to be accounted for by imports of primary or derived products.
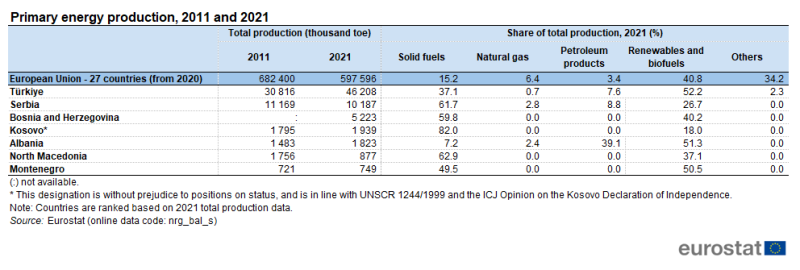
In 2021, the primary energy production of the Western Balkans and Türkiye (excluding Bosnia and Herzegovina) amounted to 61.8 million tonnes of oil equivalent (toe), 29.4 % higher than in 2011 (2011 data not available for Bosnia and Herzegovina).
As presented in Table 1, primary energy production in Türkiye was 46.2 million toe in 2021, by far the largest value recorded among the Western Balkans and Türkiye, ahead of the 10.2 million toe of energy production in Serbia. Bosnia and Herzegovina followed with 5.2 million toe. At the other end of the scale, Montenegro had the lowest primary energy production, with 0.7 million toe, followed by North Macedonia (0.9 million toe), Albania (1.8 million toe) and Kosovo (1.9 million toe). Primary energy production increased substantially between 2011 and 2021 in Türkiye (up by 49.9 %) and in Albania (up by 22.9 %). The level of primary production was relatively stable between 2011 and 2021 with not significant increase in Kosovo (+8.0 %) and in Montenegro (+3.9 %), while North Macedonia recorded a strong decrease (-50.1 %); Serbia also recorded a decrease but to a much lower extent (-8.8 %).
In 2021, the EU's primary energy production amounted to 597.6 million toe, 12.4 % lower than in 2011. Lower levels of primary energy production in the EU may, at least in part, be attributed to resources (such as oil, gas or coal fields) becoming exhausted or uneconomical.
Solid fuels were the main source of primary energy production in most of the Western Balkans and Türkiye
The structure of primary energy production is largely determined by a territory's natural resources but also by its strategic policy decisions which affect the development of specific energy sources, such as the renewable energy sources. Among the Western Balkans and Türkiye, solid fuels were the predominant energy source in 2021. More than three quarters of Kosovo's energy production (82.0 %) was from solid fuels and this was also the main source of primary energy production — accounting for more than half of all primary production — in North Macedonia (62.9 %), Serbia (61.7 %), Bosnia and Herzegovina (59.8 %) and Montenegro (49.5 %). Türkiye's energy production from solid fuels was lower, at 37.1 %; Albania was another exception as solid fuels contributed only 7.2 % of primary production while the contribution of petroleum products was 39.1 %, far higher than in any of the other Western Balkans and Türkiye: 8.8 % in Serbia and 7.6 % in Türkiye (the rest of the Western Balkans do not produce petroleum products). More than half of Türkiye's primary production was from renewables and biofuels (52.2 %), the highest in the region. More than half of Albania's primary energy production came from renewables and biofuels (51.3 %). It was closely followed by Montenegro (50.5 %). Primary energy production from renewables and biofuels was more than a third in Bosnia and Herzegovina (40.2 %) and North Macedonia (37.1 %); while the lowest was in Serbia (26.7 %) and Kosovo (18.0 %).
In 2021, renewable energy sources accounted for 40.8 % of the energy production in the EU, followed by other sources (mostly nuclear), with 34.2 %. By contrast, only 15.2 % of its primary energy production came from solid fuels and 3.4 % from petroleum products.
Renewable sources' contribution to electricity consumption was higher in three of the Western Balkans countries than in the EU
Within the Western Balkans and Türkiye region, the ratio of electricity produced from renewable energy sources to electricity consumption was higher in three countries than that in the EU (37.5 %) in 2021 (see Figure 1). The highest share was recorded by Albania (94.4 %), followed by Montenegro (60.5 %) and Bosnia and Herzegovina (46.4 % - 2019 data). Türkiye's ratio was more than a third (35.6 %), while Serbia's ratio was more than a quarter (29.9 %), followed by North Macedonia (21.5 %). The lowest rate was recorded in Kosovo (5.4 %).
(% of gross electricity consumption)
Source: Eurostat (nrg_ind_ren) and Eurostat data collection.
Between 2011 and 2021, the ratio of electricity produced from renewable energy sources to electricity consumption increased in all Western Balkans and Türkiye. The highest increase was in Albania with 28.3 percentage points (pp). It was followed by Montenegro (18.9 pp), Bosnia and Herzegovina (14.6 pp), Türkiye (10.4 pp), North Macedonia (6.7 pp), Kosovo (4.1 pp) and Serbia (2.4 pp). It should be noted that hydro-power was often the major source of renewable energy used for electricity generation in the Western Balkans and Türkiye, the output of which is dependent on the amount of rainfall, which varies — sometimes greatly — from one year to the next.
EU's electricity produced from renewable energy sources increased by 14.2 pp during the same period, from 23.3 % to 37.5 %.
Energy trade
Western Balkans and Türkiye were generally less dependent on energy imports than the EU
Net imports are calculated as the quantity of imports minus the equivalent quantity of exports. Imports represent all entries into the national territory excluding transit quantities; exports similarly cover all quantities exported from the national territory.
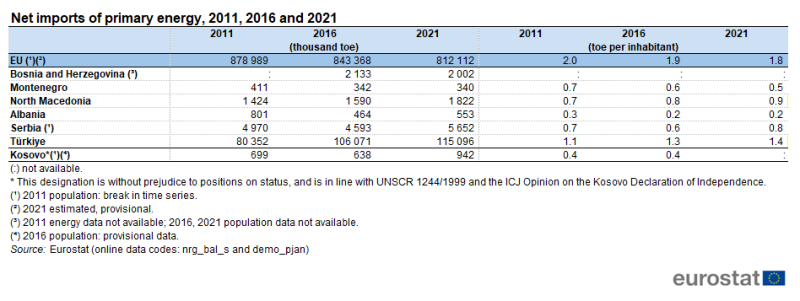
All Western Balkans and Türkiye for which data are available were net importers of energy in 2021, as was the EU. Relative to the population size, Türkiye had the highest net energy imports, at 1.4 toe per inhabitant, which was 0.4 toe per inhabitant less than the EU's net imports (1.8 toe per inhabitant). All the other Western Balkans reported net imports of 0.9 toe per inhabitant or less, in other words, half or less than a half of the level recorded in the EU (see Table 2). North Macedonia recorded 0.9 toe per inhabitant, followed by and Serbia (0.8 toe per inhabitant), Montenegro (0.5 toe per inhabitant) and Kosovo (0.4 toe per inhabitant – 2016 data). The lowest net energy imports were in Albania (0.2 toe per inhabitant). As population data is not available for Bosnia and Herzegovina, the net imports of primary energy per inhabitant cannot be calculated. Between 2011 and 2021, Türkiye and North Macedonia recorded increases of their net imports (0.3 toe per inhabitant and 0.2 toe per inhabitant, respectively); while Albania and Montenegro had a small decrease of 0.1 toe per inhabitant at the same period. Serbia's net imports were quite steady, at 0.7 toe per inhabitant in 2011 and 0.8 toe per inhabitant 2021, with a small increase of 0.1 toe per inhabitant during the period. Population data for Bosnia and Herzegovina is not available and therefore, this indicator could not be calculated; nevertheless, from the available data, the net imports recorded a decrease from 2 133 000 toe in 2016 to 2 002 000 toe in 2021 (no energy data available for 2011). No 2021 population data were available for Kosovo; however, its net imports had the steadiest evolution, at 0.4 toe per inhabitant over the two years presented.
Source: Eurostat (nrg_bal_s) and (demo_pjan)
The energy dependency rate shows the proportion of energy that an economy must import. It is defined as net energy imports divided by gross available energy, expressed as a percentage. A positive dependency rate indicates a net importer of energy while a dependency rate in excess of 100 % indicates that energy products have been stocked. In 2021, only two countries among the Western Balkans and Türkiye recorded energy dependencies of more than 50 %: Türkiye (70.6 % – 2020 data) and North Macedonia (68.0 %). The other Western Balkans recorded rates of around 30 %: Serbia with 34.8 %, Kosovo 32.6 %, Montenegro 31.1 %, Bosnia and Herzegovina 27.2 % and Albania with 23.8 %, (see Figure 2).
(% of net imports in gross available energy, based on toe)
Source: Eurostat (nrg_ind_id)
Between 2011 and 2021, energy dependency rate increased in North Macedonia, Kosovo and Serbia (by 22.4 pp, 5.1 pp, 4.3 pp, respectively), while in Albania, Montenegro and Türkiye it decreased by 11.9 pp, 5.1 pp, and 0.5 pp, respectively.
In the EU, the energy dependency rate decreased from 56.4 % in 2011 to 55.5 % in 2021.
Energy generation
The amount of electrical energy produced by transforming other forms of energy is called gross electricity generation and is expressed in gigawatt hours (GWh). The electricity generation can vary greatly when the main source is hydro-, wind or solar power. In the following description of developments between 2011 and 2021, the 2011 value for each country is regarded as the base value (100 points) to which other years' values are compared.
The gross electricity generation in Türkiye had a relatively steady year-to-year increase between 2011 and 2018, increasing by 32.5 pp over this period. In 2019 it decreased by 0.4 pp, while in 2020 and 2021 it increased by 1.1 pp and 12.2 pp respectively, totalling an increase of 45.4 pp between 2011 and 2021 (see Figure 3).
Kosovo's electricity generation also had an overall ascending trend, despite several decreases. Between 2011 and 2013 it increased by 12.5 pp, followed by a drop of 18.8 pp in 2014. In 2015 it increased by 11.8 pp and between 2015 and 2017 it decreased slowly by 3.5 pp, while it was stable between 2017 and 2018. Between 2018 and 2021 it increased again by 17.3 pp. The increase over the decade was 19.3 pp.
Serbia's electricity generation was relatively constant between 2011 and 2021 (-0.9 pp), with a high value in 2013 (+3.3 points compared with 2011) and a low value in 2014 (-11.8 points compared with 2011).
In Montenegro, electricity generation between 2011 and 2021 recorded an overall increase of 42.2 pp. Between 2011 and 2013 it recorded an increase of 48.5 pp, 2013 being the highest peak (+48.5 pp). Between 2013 and 2017 the trend was rather downward, with a decrease of 55.0 pp, partially recovered in 2018 (+50.0 pp). In 2019, a new drop was recorded compared with 2018 (-14.2 pp), decrease which continued also in 2020 followed by the latest recovery in 2021 (+14.9 pp).
North Macedonia recorded a decrease of its electricity generation by 20.5 pp in 2014 compared with 2011, followed by an increase of 4.0 pp in the following year. Between 2015 and 2018 there were only minor changes recorded. In 2019 it increased by 3.9 pp while in 2020 it decreased by 7.7 pp. The overall gross electricity generation decreased by 18.5 pp between 2011 and 2021.
Albania's electricity generation recorded the highest increase between 2011 and 2021, by 113.9 pp. During this period there were many increases and decreases, the lowest point recorded was in 2011 and the highest value was recorded in 2021. One more peak value was observed in 2018 (+104.1 pp compared with 2011).
There is not enough data available for Bosnia and Herzegovina.
In the EU, the electricity generation decreased slowly between 2011 and 2014 (-2.7 pp) and recovered between 2015 and 2017 to arrive at +0.6 pp compared with 2011. In 2018 it recorded the same value as in 2011, followed by two consecutive decreases. Between 2011 and 2021 it recorded an overall decrease of 1.0 pp.
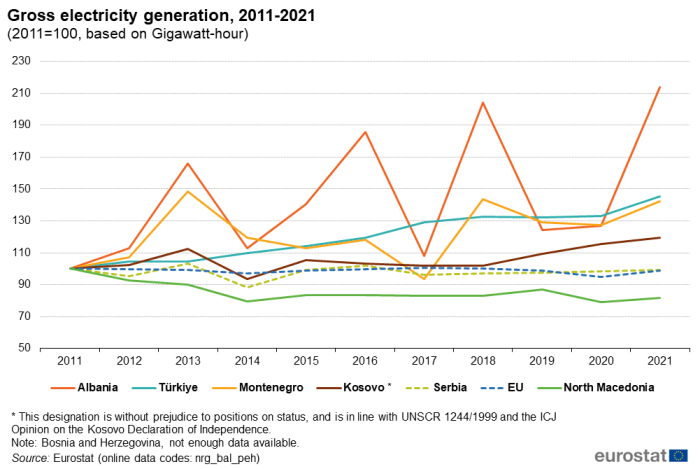
(2011=100, based on Gigawatt-hour)
Source: Eurostat (nrg_bal_peh)
Energy consumption
Gross inland energy consumption is an indicator of the overall energy needs of an economy, these being met by primary production and net imports (with data also reflecting changes in stocks and bunkers). In the following description of developments between 2011 and 2021, the 2011 value for each country is regarded as the base value (100 points) to which other years' values are compared.
In Türkiye, gross inland energy consumption increased between 2011 and 2012 (+4.5 pp). In 2013 a decrease of 3.4 pp was recorded compared with previous year, followed by a continuous increase until 2017 (+33.3 pp compared with 2011). In 2018 there was another decrease of 2.1 pp which was almost recovered by 2019 (+1.8 pp). In 2020 there was another decrease of 1.8 pp; it followed a significative growth of 12.2 pp in 2021. Overall, the increase from 2011 to 2021 was 43.4 pp.
In Kosovo, from 2011 to 2014 gross inland energy consumption decreased by 12.7 pp. It then followed a recovery in 2015 and 2016, bringing the gross inland consumption to its second highest level since 2011 (+6.4 pp in 2016). The increase between 2011 and 2021 was 13.8 pp with its top level in 2021.
Serbia and Albania's gross inland consumption was relatively steady between 2011 and 2021 (-0.5 pp and +2.3 pp, respectively). Nevertheless, the trends over the years were different, as can be seen in Figure 4. Serbia's highest gross inland consumption during the hole period was in 2011, while the lowest was in 2014, at -18.2 pp compared with 2011. Albania's highest point was in 2017 (+5.8 pp compared with 2011) and the lowest in 2012 (-9.9 pp compared with 2011).
Montenegro and North Macedonia both recorded decreases between 2011 and 2021 (-3.6 pp and -14.2 pp, respectively). Montenegro's highest gross inland consumption was in 2011, while the lowest was in 2014, at -14.1 pp. North Macedonia's highest point was in 2011 and the lowest in 2018 (-17.0 pp compared with 2011).
Between 2011 and 2021, the EU's gross inland energy consumption decreased by 6.0 pp.
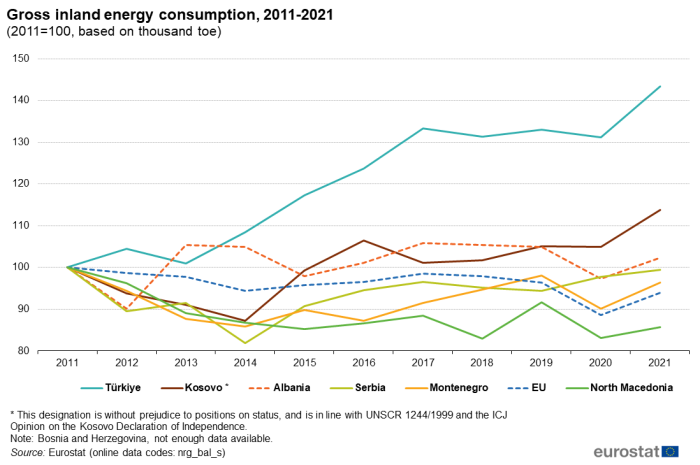
(2011=100, based on thousand toe)
Source: Eurostat (nrg_bal_s)
High energy intensity in the Western Balkans and Türkiye, particularly in Bosnia and Herzegovina, Kosovo and Serbia
Energy intensity is a measure of the efficiency with which an economy consumes energy to produce output, with gross domestic product (GDP) being used as the measure of overall output: it is expressed as units of energy consumed per unit of GDP, the latter in constant prices (or using chain-linked volume data) to remove the effects of inflation. As well as reflecting the efficiency of transforming energy sources (for example to electricity) or converting energy to heat, motion, light and other uses, this measure also depends on a range of factors, such as the structure of an economy, the climate, the standard of living and transportation patterns/preferences, to name but a few.
The energy intensity of the Western Balkans and Türkiye for which data is available for both 2011 and 2021, decreased between these years (see Figure 5). In Kosovo it decreased from 525 kilogram of oil equivalent (kgoe) per thousand EUR in 2011 to 405 kgoe per thousand EUR in 2021, the highest decrease. The next highest decreases over the same period were recorded in North Macedonia (from 380 to 268 kgoe per thousand EUR), Serbia (from 468 to 371 kgoe per thousand EUR) and Montenegro (from 329 to 265 kgoe per thousand EUR). Albania had a much smaller decrease in energy intensity between 2011 and 2020 (no 2021 data) from 233 to 196 kgoe per thousand EUR, while Türkiye had the smallest decrease, from 184 to 163 kgoe per thousand EUR (2020 data instead of 2021). There was no 2011 data reported by Bosnia and Herzegovina, but in 2021 its energy intensity was 420 kgoe per thousand EUR.
EU's energy intensity in 2021 was 110 kgoe per thousand EUR, a decrease from 132 kgoe per thousand EUR in 2011.
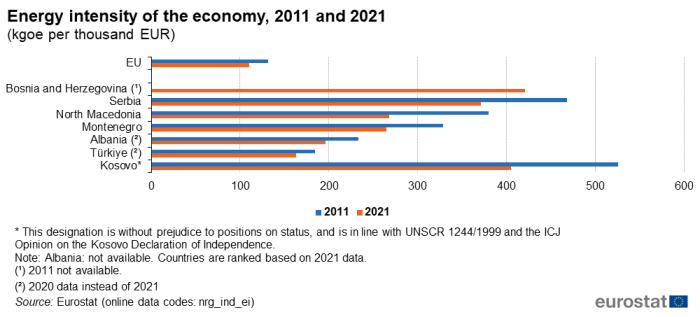
(kgoe per thousand EUR)
Source: Eurostat (nrg_ind_ei)
Higher shares of final energy consumption in transport and households
Final energy consumption is a concept stemming from a bottom-up approach – aggregation of consumption in various sectors of consumption (industry, transport, households, services and others). As such, it often uses different data sources and calculation concepts other than the top-down approach used to calculate gross inland energy consumption, which reflects rather more the supply side.
In 2021, the highest share of final energy consumption in transport was recorded in North Macedonia (37.9 %), followed by Montenegro (36.9 %), Albania (33.7 %), Bosnia and Herzegovina (32.0 %), Kosovo (27.9 %), Serbia (27.0 %) and Türkiye (26.6 %).
The share of final energy consumption in households was the highest in Bosnia and Herzegovina (41.5 %), followed by Kosovo and Serbia (39.3 % and 38.4 %, respectively), Montenegro (32.4 %), Albania and North Macedonia (27.3 % and 26.9 %, respectively), while Türkiye recorded the lowest share (23.3 %).
Türkiye had the highest share of final energy consumption in industry, with 35.6 %. Shares higher than 20 % were also recorded in North Macedonia with 24.4 %, Serbia with 22.8 % and Albania with 22.2 %. The lowest shares were in Bosnia and Herzegovina (16.3 %), Montenegro (17.4 %) and Kosovo (19.7 %).
The share of final energy consumption in other sectors was in general the least in the Western Balkans and Türkiye, ranging from 10.2 % in Bosnia and Herzegovina to 16.9 % in Albania.
In 2021, the share of final energy consumption in the EU was more balanced: transport with 29.2 %, followed closely by households with 27.9 % and industry with 25.6 %. The share of final energy consumption in other sectors accounted for 17.3 %.
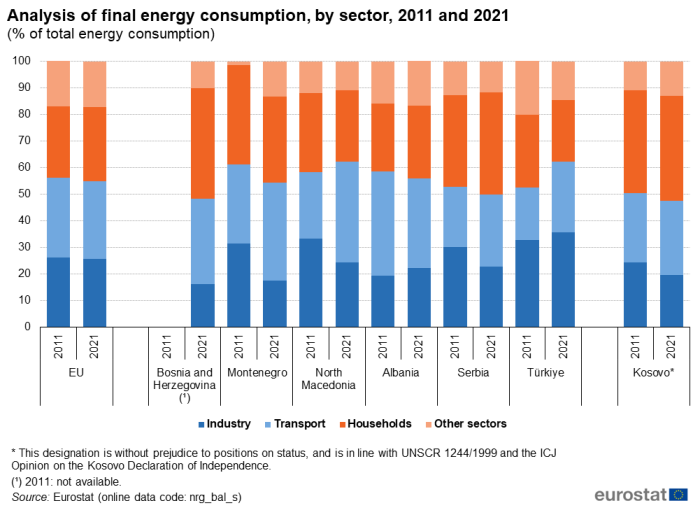
(% of total energy consumption)
Source: Eurostat (nrg_bal_s)
The highest changes in the share of final energy consumption between 2011 and 2021 were recorded in Montenegro where the share in industry went down by 14.1 pp, while the share in other sectors went up by 11.8 pp. In North Macedonia, the share in transport went up by 12.9 pp between 2011 and 2021, while the shares in industry and households went down by 8.9 pp and 2.9 pp, respectively.
Higher shares of renewables in gross final energy consumption in most of the Western Balkans than in the EU
In 2021, Albania, Montenegro, Serbia and Kosovo all had higher shares of renewables in gross final energy consumption than the EU; only North Macedonia had a lower share than the EU. In 2011, all Western Balkans had higher shares than the EU (see Figures 7). No data is available for Türkiye and Bosnia and Herzegovina.
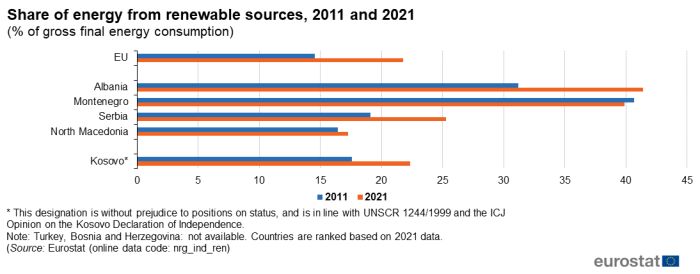
(% of gross final energy consumption)
Source: Eurostat (nrg_ind_ren)
In 2021, Albania had the highest share of renewables in gross final energy consumption from the Western Balkans (41.4 %), an increase of 10.2 pp compared with 2011. Montenegro came second, with a share of 39.9 %, a decrease of 0.8 pp from the level recorded in 2011. Serbia and Kosovo recorded lower shares, but still higher than the EU: 25.3 % (up by 6.2 pp compared with 2011) and 22.4 % (up by 4.8 pp compared with 2011), respectively. North Macedonia's share of renewables in gross final energy consumption in 2011, 16.4 %, was above the EU's share, 14.5 %, but at 17.3 % in 2021 it fell below it (21.8 %).
Source data for tables and graphs
Data sources
Data for the Western Balkans and Türkiye are collected for a wide range of indicators each year through a questionnaire that is sent by Eurostat to Western Balkans and Türkiye. A network of contacts has been established for updating these questionnaires, generally within the national statistical offices, but potentially including representatives of other data-producing organisations (for example, central banks or government ministries). Note that in 2016, it was decided to stop collecting nearly all energy statistics using the questionnaires, instead relying on information that was collected by Eurostat's unit responsible for energy statistics. Alongside Eurostat's regular collection of energy statistics from EU Member States and EFTA countries, the Western Balkans and Türkiye provide energy statistics directly to Eurostat and these data have been used as the basis for the analyses presented in this article. These statistics from Eurostat's regular collection of energy statistics are made available free-of-charge on Eurostat's website.
In order to meet the increasing requirements of policymakers for energy monitoring, Eurostat has developed a coherent and harmonised system of energy statistics. As well as covering EU Member States and EFTA countries these data are also collected from the Western Balkans and Türkiye. Time series are generally available from 1990 onwards. The collection of energy data is based on Regulation (EC) No 1099/2008 of the European Parliament and of the Council of 22 October 2008 on energy statistics and its amendments.
Information concerning the current statistical legislation on energy statistics can be found here.
Data are available for a variety of fuel types, namely solid fuels, crude oil and petroleum products, natural and derived gases, nuclear heat, electricity, waste and renewable energy sources. Basic data on energy quantities are in fuel specific units, such as liquid fuels in thousand tonnes, electricity in kilowatt-hours; these units are converted to common energy units (such as toe to allow the addition or comparison of data for different energy sources). While basic principles and institutional frameworks for producing statistics are already in place, Western Balkans and Türkiye are expected to increase progressively the volume and quality of their data and to transmit these data to Eurostat in the context of the EU enlargement process. EU standards in the field of statistics require the existence of a statistical infrastructure based on principles such as professional independence, impartiality, relevance, confidentiality of individual data and easy access to official statistics; they cover methodology, classifications and standards for production.
Eurostat has the responsibility to monitor that statistical production of the Western Balkans and Türkiye complies with the EU acquis in the field of statistics. To do so, Eurostat supports the national statistical offices and other producers of official statistics through a range of initiatives, such as pilot surveys, training courses, traineeships, study visits, workshops and seminars, and participation in meetings within the European Statistical System (ESS). The ultimate goal is the provision of harmonised, high-quality data that conforms to European and international standards.
Additional information on statistical cooperation with the Western Balkans and Türkiye is provided here.
Tables in this article use the following notation:
| Value in italics | data value is forecasted, provisional or estimated and is therefore likely to change; |
| : | not available. |
Context
Energy has been a key feature on the EU's policy agenda for a number of years, largely as a result of fluctuating energy prices; security of supply; and human induced effects of energy use on climate change, in particular, increased levels of greenhouse gas emissions. The use of renewable energy sources is seen as a key element of the EU's energy policy and should help to improve energy security; support the achievement of a carbon neutral society; and decouple energy costs from oil prices.
Alongside this, EU policy has also supported the development of gas pipeline and electricity transmission networks across the EU, as well as of common rules to increase competition between suppliers and promote consumer choice. Energy crises have underlined the EU's need to work with its neighbours on energy security, including diversification of energy sources, routes and suppliers.
In January 2014, the European Commission put forward a 2030 climate and energy framework with the aim of encouraging private investment in infrastructure and low-carbon technologies. The key targets proposed were to have 40 % less greenhouse gases in 2030 than in 1990 and for the share of renewable energy in consumption to reach at least 27 % by 2030. Alongside the proposed targets were plans to reform the emissions trading system and to consider further amendments to the energy efficiency directive.
The EU's 2050 long-term strategy for reducing greenhouse gas emissions was laid out in November 2018, with the aim of making Europe the world's first climate-neutral continent by 2050 in response to the climate and environmental emergency.
In consequence, the European Commission announced the European Green Deal in December 2019. This is an action plan in support of the 2050 long-term strategy with a further reduction in 2030 greenhouse gas emissions compared with 1990 levels; invest in research and innovation; and preserve Europe's natural environment.
As of 2021, European Union climate legislation to implement these proposals is undergoing detailed development in the EU Council and European Parliament. This package considers the actions required across all sectors, including a reduction of 2030 greenhouse gas emissions compared with 1990 levels of at least 55 %, to be implemented through support for increased energy efficiency and renewable energy. This will enable the EU to move towards a climate-neutral economy and implement its commitments under the Paris Agreement. This process has resulted in a proposal before the European Parliament for a European Strategy for Energy System Integration.
In June 2021, the European climate law was adopted. The climate law is a key element of the European Green Deal. It sets the framework for actions by the EU and the Member States for reducing greenhouse gas emissions by at least 55 % compared with 1990 levels by 2030 and reach climate neutrality in the EU by 2050. The climate law is complemented by the European climate pact and the 2030 climate target plan. This will enable the EU to move towards a climate-neutral economy and implement its commitments under the Paris Agreement.
Another key part of the EU's work towards climate neutrality is the so-called Fit for 55 package. It is the EU's key plan to turn the climate goals into EU law and comprises a set of proposals for revision of existing legislation and new initiatives. In the key area of energy, the EU is taking action on issues such as increased energy efficiency and renewable energy.
Direct access to
Other articles
- Enlargement countries — statistical overview — online publication
- Statistical cooperation — online publication
- Energy statistics - an overview — online publication
- Energy
Publications
- Statistical books/pocketbooks
- Key figures on enlargement countries — 2019 edition
- Key figures on enlargement countries — 2017 edition
- Key figures on the enlargement countries — 2014 edition
- Factsheets
- Basic figures on the candidate countries and potential candidates — Factsheets — 2023 edition
- Basic figures on Western Balkans and Türkiye — Factsheets — 2022 edition
- Statistics for a green future — Western Balkans and Türkiye — Factsheets — 2022 edition
- Basic figures on enlargement countries — Factsheets — 2021 edition
- Leaflets
- Basic figures on enlargement countries — 2020 edition
- Basic figures on enlargement countries — 2019 edition
- Basic figures on enlargement countries — 2018 edition
- Energy and transport statistics for the enlargement countries — 2018 edition
- Basic figures on enlargement countries — 2016 edition
Database
- Energy (nrg), see:
- Energy statistics — quantities (nrg_quant)
- Energy statistics — quantities, annual data (nrg_quanta)
- Energy balances (nrg_bal)
- Simplified energy balances (nrg_bal_s)
- Energy indicators (nrg_ind)
- Share of energy from renewable sources (nrg_ind_ren)
- Energy balances (nrg_bal)
- Energy statistics — quantities, annual data (nrg_quanta)
Dedicated section
Methodology
- Energy statistics - quantities (nrg_quant) (ESMS metadata file — nrg_quant_esms)
- Regulation (EC) No 1099/2008 of 22 October 2008 on energy statistics.
- Summaries of EU legislation: Common system for the production of energy statistics
- Roadmap for moving to a competitive low-carbon economy in 2050 (COM (2011) 112 final)
Summaries of EU legislation:
