Resources and green transformation in European Neighbourhood East countries
Data extracted in February 2024.
Planned article update: March 2025.
Highlights
In 2021, Azerbaijan was the only net exporter of energy among the European Neighbourhood Policy-East countries, with net energy exports of 48 million tonnes of oil equivalent.
Renewable energy accounted for 23.7% of final energy consumption in Georgia in 2022, higher than the EU average of 23.0%. However, the share in Georgia had fallen significantly; it was 35.2% in 2013.
In 2021, Georgia generated 270 kg of municipal waste per person, Azerbaijan 255 kg and Armenia 164 kg. This was far less than the EU average of 532 kg per person.
This article is part of an online publication; it presents recent information for five European Neighbourhood Policy-East (ENP-East) countries, namely, Armenia, Azerbaijan, Georgia, Moldova and Ukraine, compared with the European Union (EU). Georgia, Moldova and Ukraine are also candidate countries, the European Council granting Moldova and Ukraine candidate status on 22 June 2022 and Georgia on 14 December 2023. This article does not contain any data on Belarus, as statistical cooperation with Belarus has been suspended as of March 2022.
Data shown for Georgia exclude the regions of Abkhazia and South Ossetia over which the government of Georgia does not exercise control. The data managed by the National Bureau of Statistics of the Republic of Moldova does not include data from Transnistria over which the government of the Republic of Moldova does not exercise control. Since 2014, data for Ukraine generally exclude the illegally annexed Autonomous Republic of Crimea and the City of Sevastopol and the territories which are not under control of the Ukrainian government. Data on Ukraine for the year 2022 is limited due to exemption under the martial law from mandatory data submission to the State Statistics Service of Ukraine, effective as of 3 March 2022, following Russia's war of aggression against Ukraine.
The article presents a range of resources and green transformation indicators such as greenhouse gas emissions, annual freshwater use, primary energy production, net import of energy and gross inland energy consumption.
Full article
Greenhouse gas emissions
Greenhouse gas emissions refer to the release of gases into the Earth's atmosphere that trap heat, contributing to the greenhouse effect and global warming. It focuses on the quantification and measurement of gases that contribute to the greenhouse effect by trapping heat in the Earth's atmosphere. This definition encompasses the identification, collection, analysis, and reporting of data on the concentration and sources of greenhouse gases (GHGs) such as carbon dioxide (CO2), methane (CH4), nitrous oxide (N2O), and fluorinated gases.
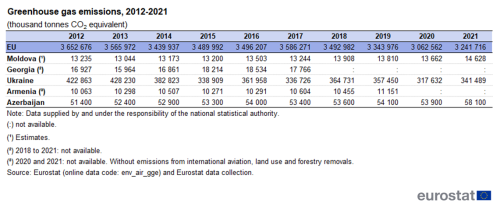
Table 1 shows the amount of greenhouse gas emissions, in thousand tonnes equivalent CO2, over the period 2012-2021.
Ukraine's emissions have varied over the years. In 2013 it reached a peak of 428 230 thousand tonnes, followed by fluctuations in subsequent years. In 2020 it reached a low point, 317 632 thousand tonnes, followed by an increase in 2021 to reach 341 489 thousand tonnes.
Azerbaijan's emissions have shown a slight increase over the decade, moving from 51 400 thousand tonnes in 2012 to 58 100 thousand tonnes in 2021.
Data for Georgia shows a consistent range of emissions from 2012 to 2017, after which data is not available.
Moldova's emissions have shown a gradual increase from 13 235 thousand tonnes in 2012 to 14 628 thousand tonnes in 2021. Meanwhile, Armenia's figures are somewhat consistent, with slight fluctuations and an increase in reported data to 11 151 thousand tonnes in 2019, the most recent data available.
Between 2012 and 2021, the European Union (EU) saw a general decline in greenhouse gas emissions. Over the period, the emissions peaked in 2012 at 3 652 676 thousand tonnes and saw a decrease to 3 241 716 thousand tonnes by 2021, while the lowest point was recorded in 2020 (3 062 562 thousand tonnes) due to the COVID-19 pandemic which caused a decline in traffic and emissions. The overall trend since 1990 suggests a commitment to reducing greenhouse gas output, which aligns with various EU environmental policies and initiatives aimed at combatting climate change.
These statistics highlight the varied efforts and trajectories of different countries in managing and reporting greenhouse gas emissions. They underscore the complexities and challenges nations face in achieving emission reduction targets, including geopolitical factors, economic development priorities, and resource availability.
(thousand tonnes CO2 equivalent)
Source: Eurostat (env_air_gge) and Eurostat data collection.
Annual freshwater use
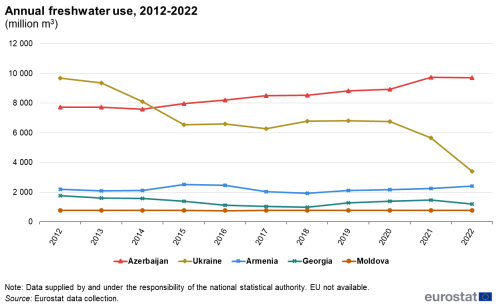
Figure 1 compares annual freshwater use data from 2012 to 2022, in million cubic metres (m3). Annual freshwater use is a measure of how much freshwater is used in a year by end users like households, services, agriculture, and industry, for purposes such as domestic use, irrigation, or industrial processing.
Azerbaijan's freshwater usage has been on an overall increasing trend from 7 740 million m3 in 2012, reaching a peak at 9 752 million m3 in 2021 before a slight decrease to 9 714 million m3 in 2022. This pattern suggests a rising demand over the decade.
Ukraine shows a significant decrease in freshwater use over the ten-year period, starting at 9 678 million m3 in 2012 and dropping to 3 397 million m3 in 2022. This dramatic decline in particular in 2022 may reflect the effects of Russia's war of aggression against Ukraine.
Armenia's freshwater consumption shows some fluctuation but overall, an upward trend from 2 187 million m3 in 2012 to 2 422 million m3 in 2022.
Georgia's water use fluctuated considerably, with a notable decrease to 997 million m3 in 2018, before a rebounding in the subsequent years, reaching 1 476 million m3 in 2021. However, it decreased again to 1 197 million m3 in 2022.
Moldova's freshwater use is relatively stable, with minor fluctuations around the 780 million m3 mark throughout the decade, indicating a consistent demand for water usage with very small annual variations.
Municipal waste generated
Figure 2 presents the evolution of the municipal waste generated across the European Union (EU), Georgia, Azerbaijan, and Armenia over a ten-year period (from 2012 to 2021), in kilogramme per capita (kg/capita). Data for Moldova and Ukraine are not available.
Georgia's data begins in 2015, and from that year until 2021, there has been an increase from 208 kg/capita to 270 kg/capita, with a small drop in 2020. This trend suggests growing waste generation, which could be associated with economic growth or changes in consumption patterns.
Azerbaijan shows an overall increasing trend in municipal waste generated per person, starting at 178 kg/capita in 2012, dipping to 143 kg/capita in 2014, and then rising significantly to 255 kg/capita by 2021. This growth could reflect an increase in consumption or potentially improvements in waste collection by municipalities.
In Armenia, data are missing for 2013 and 2014, but from the available data, a fluctuation in waste generation can be seen. The amount of waste generated increased from 125 kg/capita in 2012 to 164 kg/capita in 2021, with a peak in 2020 at 194 kg/capita.
For the EU, there is a clear upward trend in waste generation per capita, starting at 488 kg/capita in 2012 and rising steadily to 532 kg/capita by 2021. This indicates that, on average, each person in the EU is generating more waste over time.
The provided data from Eurostat, particularly where estimates are involved, demonstrate differing and dynamic patterns of waste generation. These patterns are likely influenced by a variety of factors, including economic development, population density, urbanisation, and public policy regarding waste management and reduction strategies.
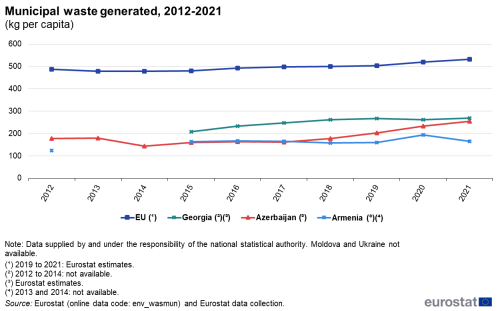
(kg per capita)
Source: Eurostat (env_wasmun) and Eurostat data collection.
Primary production by sources
Energy commodities extracted or captured directly from natural resources are called primary energy sources, while energy commodities which are transformed from primary energy sources are called derived products. Primary energy sources cover the extraction of coal and other solid fuels; exploitation of oil and natural gas fields; production by nuclear and hydroelectric power plants; and renewables. The primary production of crude oil is defined as the quantity of fuel extracted or produced within national boundaries, including offshore production. Primary production of natural gas is defined as the quantity of dry gas, measured after purification and extraction of natural gas liquids and sulphur. Energy transformed from one form to another, such as electricity or heat generation in thermal power plants, is not considered as primary production of energy. Energy is often measured in tonnes of oil equivalent (toe).
The level of primary energy production may fluctuate considerably from one year to the next from changes in energy demand, reflecting, for example, economic fortunes and the number of heating days; from changes in energy prices, which are affected by international market supply and demand; and the weather, particularly for hydroelectric power. Developments in primary energy production may also reflect new energy sources and existing energy resources becoming depleted or being replaced.
Figure 3 shows that in Azerbaijan, oil and petroleum products, at 50.6 % and natural gas, at 49.1 %, provided almost all national primary production in 2022. In Ukraine, nuclear energy provided 35.1 %, natural gas 27.8 % and coal and other solid fuels 22.2 % of primary production in 2020 (no data available for 2022).
The other three ENP-East countries had limited primary energy production – production shares should be viewed in this context. In Georgia, production was mainly focused on hydroelectric power (91.2 % in 2021, no data available for 2022). Moldova had a high contribution from renewables and biofuels in 2021 (99.4 %). In Armenia, the largest share of production in 2021 (2022 not available) was from nuclear power (60.4 %).
The structure of primary energy production in the EU is relatively varied, reflecting the availability of fossil fuel deposits and the potential for hydro power, as well as policies concerning the production of nuclear energy and energy from renewable sources. In 2022, the major sources of primary energy in the EU were renewables and biofuels (43.2 %) and nuclear power (27.6 %). Solid fuels accounted for 16.4 % of the primary energy production, while natural gas accounted for 6.2 % and oil and petroleum products for 3.3 %.
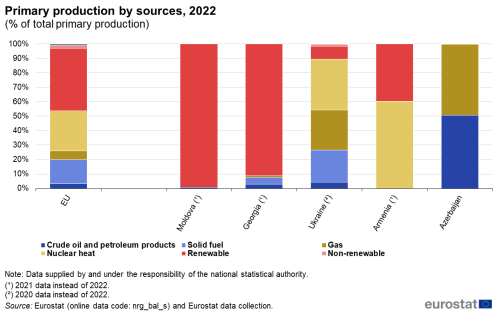
(% of total primary production)
Source: Eurostat (nrg_bal_s) and Eurostat data collection.
Net import of energy
Net imports are calculated as the quantity of energy imports minus the equivalent quantity of exports. Imports represent all entries into the national territory, excluding transit quantities (notably via gas and oil pipelines); exports similarly cover all quantities exported from the national territory. Negative numbers indicate net exports.
Figure 4 presents data on the net import of energy in thousand tonnes of oil equivalent (toe). Ukraine's figures, while incomplete for 2021, indicate a fluctuating but generally stable level of energy imports, with a slight decrease observed in 2020. The numbers declined from a high of 38 499 thousand toe in 2012, dropping to 29 487 thousand toe in 2020.
Georgia's net energy imports have gradually increased over the years, from 2 824 thousand toe in 2013 to 4 133 thousand toe in 2021, reflecting a growing energy demand.
Armenia's available data from 2015 to 2020 also show an increasing trend in net energy imports, rising from 2 212 thousand toe to 2 710 thousand toe in 2020.
Moldova's energy import figures show a slight upward trend over the decade, from 1 928 thousand toe in 2012 to 2 306 thousand toe in 2021, suggesting a modest increase in energy import dependency.
Azerbaijan stands out with negative figures, indicating that it is a net exporter of energy. The numbers show a large net export capacity, with an increase in net exports from -45 776 thousand toe in 2012 to -48 246 thousand toe in 2021, underlying Azerbaijan's significant role as an energy-supplying country.
The EU has seen fluctuations in its net energy imports over the decade, with a high in 2019 at 908 227 thousand toe and then decreasing to 811 622 thousand toe in 2021. The figures suggest the EU's heavy reliance on energy imports, although a notable decrease occurred in 2020, which could be partially due to a downturn in energy demand during the COVID-19 pandemic. The large difference in size between the EU and the ENP-East countries makes it difficult to compare their net energy imports. Overall, the EU's net energy inputs in 2022 was around 27 times higher than that of Ukraine. However, within the EU, net energy imports varied considerably across countries, reflecting differences in energy generation, energy intensity and size.
These statistics provide insights into the energy dependency and trade balance of each region, highlighting the varied energy landscapes and economic dependencies on energy trade. The data reflect each country's energy policy, resource endowment and economic interactions with global energy markets.
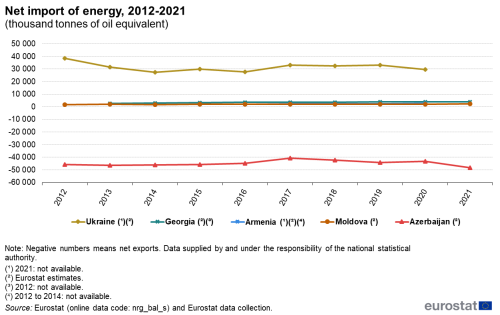
(thousand tonnes of oil equivalent)
Source: Eurostat (nrg_bal_s) and Eurostat data collection.
Gross inland energy consumption
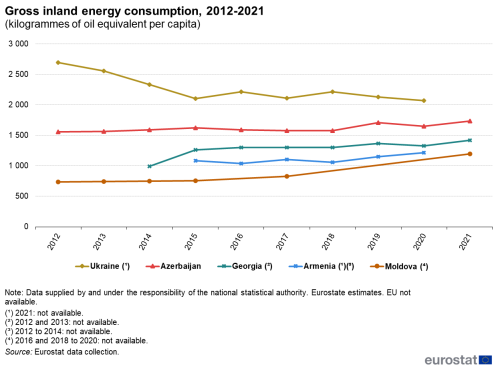
Figure 5 presents data on energy consumption per capita, in kilogrammes of oil equivalent (kgoe) per capita.
Ukraine's energy consumption per capita decreased from 2 695 kgoe/capita in 2012 to 2 070 kgoe/capita in 2020 (latest year for which data is available), which could reflect improvements in energy efficiency, changes in the economic structure, or impacts from energy policies.
Azerbaijan's consumption has been relatively constant between 2012 and 2018, showing an upward trend in recent years. In 2012 it recorded 1 558 kgoe/capita, while in 2021 it went up to 1 736 kgoe/capita.
Data for Georgia starts in 2014, with consumption increasing from 990 kgoe/capita to 1 418 kgoe/capita by 2021, suggesting a rise in domestic energy consumption possibly aligned with economic development and higher living standards.
Armenia shows a general increase in energy consumption from 1 085 kgoe/capita in 2015 (first year for which data is available) to 1 215 kgoe/capita in 2020 (data not available for 2021), with some fluctuations in between, indicating growing energy needs.
Moldova's figures, while incomplete, indicate a rising trend in energy consumption from 737 kgoe/capita in 2012 to 1 199 kgoe/capita in 2021, possibly reflecting increased economic activity and energy use.
The data reveal varying trends in energy consumption across these countries, influenced by factors like economic development, energy efficiency measures, changes in population dynamics, and shifts in energy policy. The increases in energy consumption in certain countries may also reflect their stages of economic development and growth in energy demand.
Renewable energy in gross final energy consumption
Figure 6 illustrates the proportion of renewable energy used as a percentage of total energy consumption.
Georgia started with a high percentage of renewables at 35.2 % of total energy consumption in 2013 (data for 2012 is not available). There was a notable decline to 23.0 % in 2020, with a slight increase to 23.7 % in 2022.
Moldova's share of renewables has also fluctuated, starting at 24.3 % in 2012, peaking at 27.8 % in 2017, and then decreasing to 21.5 % in 2022.
Armenia's data, available from 2015, shows an initial increase from 10.8 % to 13.2 % in 2016, followed by a decrease to 8.4 % in 2020, and then an increase again to 11.3 %. Ukraine has demonstrated a steady increase in the share of renewable energy, from 3.2 % in 2012 to 9.2 % in 2020 (latest year for which data is available), suggesting a gradual transition towards renewable sources.
Azerbaijan shows a slight decrease in the proportion of renewables from 2.7 % in 2012 to 1.3 % in 2022, which is relatively low compared to the other regions and might be due to its large fossil fuel reserves.
The EU shows a progressive increase in the share of renewables in energy consumption, from 16.0 % in 2012 to 23.0 % in 2022, reflecting a consistent shift towards more sustainable energy sources.
These figures provide an overview of how each region is progressing with the integration of renewable energy into their total energy mix, with varying degrees of success and adoption rates. The trends reflect national energy policies, resource availability, and commitment to renewable energy targets.
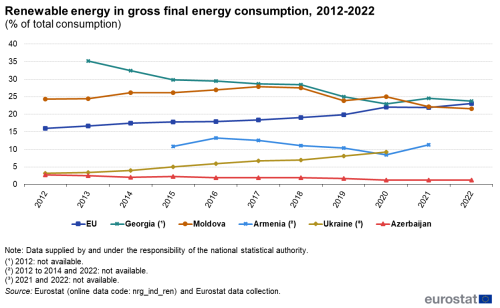
(% of total consumption)
Source: Eurostat (nrg_ind_ren) and Eurostat data collection.
Energy productivity
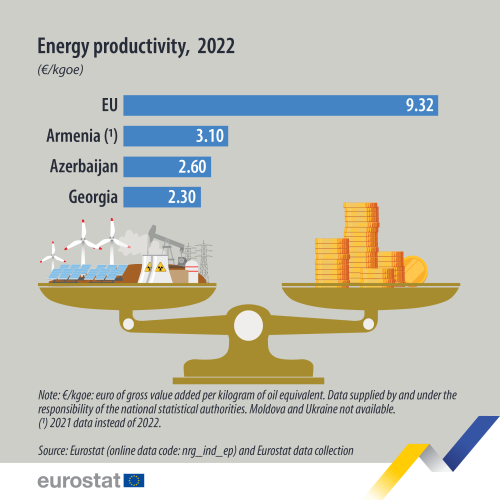
Figure 7 presents the energy productivity, expressed in euros of gross value added (GVA) per kilogramme of oil equivalent (kgoe), for the EU, Armenia, Azerbaijan, and Georgia over several years. Data for Moldova and Ukraine are not available.
Energy productivity is an economic indicator that measures the amount of economic output achieved per unit of energy consumption, and higher values indicate more efficient use of energy in creating economic value.
For Armenia, there is a general upward trend from 2.9 €/kgoe in 2015 to 3.6 €/kgoe in 2019, followed by a consistent figure of 3.1 €/kgoe for 2020 and 2021. Data for other years is not available, which limits the ability to observe long-term trends.
Azerbaijan's energy productivity remains relatively flat, with a slight decrease from 3.0 €/kgoe in 2013 to 2.6 €/kgoe by 2022, indicating little change in the relationship between energy consumption and economic output.
Georgia experienced a decrease in energy productivity from 3.1 €/kgoe in 2013 to 1.8 €/kgoe in 2021, before increasing to 2.3 €/kgoe in 2022. The decline could suggest an increase in energy consumption that outpaces economic growth or shifts in the economy to less energy-efficient sectors.
The EU shows a steady increase in energy productivity, from 7.2 €/kgoe in 2012 to 9.3 €/kgoe in 2022, suggesting continuous improvements in energy efficiency or a shift towards higher value-added activities that require less energy per unit of output.
The presented data reflects the energy efficiency and economic structures of these economies, and changes in productivity levels can be influenced by many factors, including technological advancements, shifts in the industrial base, and energy policy.
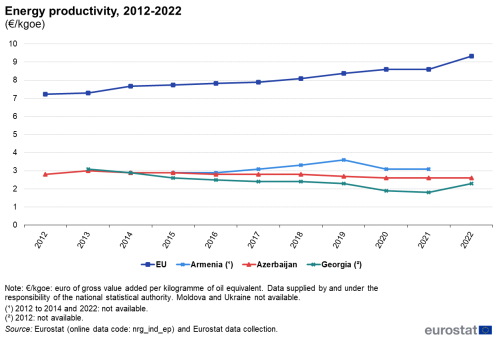
(€/kgoe)
Source: Eurostat (nrg_in_ep) and Eurostat data collection.
Source data for tables and graphs
Data sources
The data for ENP-East countries are supplied by and under the responsibility of the national statistical authorities of each country on a voluntary basis. The data that are presented in this article result from an annual data collection cycle that has been established by Eurostat. These statistics are available free-of-charge on Eurostat’s website, together with a range of different indicators covering most socio-economic areas.
Energy
For EU statistics, the main legislation covering the collection of statistics in relation to energy quantities is Regulation (EC) No 1099/2008 of the European Parliament and of the Council of 22 October 2008 on energy statistics. Since its adoption, it has been amended several times and a consolidated version is available. A summary of the relevant legislation is also available on Eurostat's website, under 'Legislation' on the dedicated section for Energy statistics.
Environment
Eurostat, in close partnership with the European Environment Agency (EEA), provides environmental statistics, accounts and indicators supporting the development, implementation, monitoring and evaluation of the EU's environmental policies, strategies and initiatives. Data on greenhouse gas emissions as reported under the United Nations framework convention on climate change (UNFCCC) are collected by the EEA. Eurostat collects official statistics in relation to a broad selection of subject areas, for example, waste, water, material flows and environmental protection expenditure.
The Kyoto Protocol, an environmental agreement adopted by many of the parties to the UNFCCC in 1997 to curb global warming, covers six greenhouse gases: carbon dioxide (CO2), methane (CH4) and nitrous oxide (N2O), which are non-fluorinated gases, and hydrofluorocarbons (HFCs), perfluorocarbons (PFCs) and sulphur hexafluoride (SF6), which are fluorinated gases. Converting them to carbon dioxide equivalents makes it possible to compare them and to determine their individual and total contributions to global warming. A new agreement on greenhouse gas emissions was reached in Paris in late 2015; this provides the basis for emissions mitigation and adaptation from 2020 onwards.
Eurostat's data on waste is collected from EU Member States on the basis of Regulation (2150/2002/EC) on waste statistics and is published every two years in line with common methodological recommendations. Landfill is the deposit of waste into or onto land; it includes specially engineered landfill sites and temporary storage of over one year on permanent sites. The definition covers both landfill in internal sites, in other words, where a generator of waste is carrying out its own waste disposal at the place of generation and in external sites.
The collection of water statistics within the EU is based on information demands linked to the Directive 2000/60/EC Water Framework Directive (WFD). Eurostat and the OECD jointly administer a questionnaire on inland waters among EU Member States, candidate countries and potential candidates. Data collection is voluntary although there is an initiative to establish a legal framework for the collection of water statistics.
A large amount of data and other information on water is accessible via WISE, the water information system for Europe, which is hosted by the European Environment Agency (EEA) in Copenhagen.
Tables in this article use the following notation:
| Value in italics | data value is forecast, provisional or estimated and is therefore likely to change; |
| : | not available, confidential or unreliable value. |
Context
The EU's long-term strategy for reducing greenhouse gas emissions was laid out in November 2018, with the aim of making Europe the world's first climate-neutral continent by 2050. In December 2019, the European Commission presented the European Green Deal, set out in Communication COM(2019) 640 final. The European Green Deal is a growth strategy that aims to transform the EU into a fair and prosperous society, with a modern, resource-efficient and competitive economy where there are no net emissions of greenhouse gases in 2050 and where economic growth is decoupled from resource use. The Green Deal is an integral part of this Commission's strategy to implement the United Nation's 2030 Agenda and the Sustainable Development Goals.
In June 2021, the European Climate Law, Regulation (EU) 2021/1119, was adopted. The European Climate Law make the goal set out in the European Green Deal to become climate-neutral by 2050 a legal obligation for the EU and its Member States. It sets the framework for actions to reduce greenhouse gas emissions by at least 55 % levels by 2030, compared with 1990 levels, and reach climate neutrality in the EU by 2050. The Climate Law is complemented by the European Climate Pact and the 2030 Climate Target Plan, enabling the EU to move towards a climate-neutral economy and implement its commitments under the Paris Agreement.
In order to deliver the European Green Deal and reduce the EU's greenhouse gas emissions by 55 % by 2030, a legally binding milestone laid down in the European Climate Law, the European Commission proposed the 'Fit for 55' package in June 2021. The 'Fit for 55' package is the EU's key plan to turn the climate goals into EU law and comprises a set of proposals for revision of existing legislation and new initiatives in a wide range of areas. By October 2023, the final legislation of the 'Fit for 55' package had been adopted.
On 2 July 2021, the European Commission and the EU High Representative for Foreign Affairs and Security Policy presented the Eastern Partnership: a Renewed Agenda for cooperation with the EU's Eastern partners. This agenda is based on the five long-term objectives, with resilience at its core, as defined for the future of the Eastern Partnership (EaP) in the Joint Communication Eastern Partnership policy beyond 2020: Reinforcing Resilience – an Eastern Partnership that delivers for all in March 2020. It is further elaborated in the Joint Staff Working Document Recovery, resilience and reform: post 2020 Eastern Partnership priorities, amongst others defining the 'Top Ten Targets for 2025'. The Eastern Partnership's agenda for recovery, resilience and reform is underpinned by an 'Economic and Investment Plan for the Eastern Partnership (EaP): Investing in resilient and competitive economies and societies' (Annex I of the Joint Staff Working Document). More detailed overviews are given in a Factsheet on the Eastern Partnership Joint Communication, presenting the policy objectives and the specific priorities, as well as in a Factsheet on EU-Eastern Neighbourhood flagship projects 2023-2024.
The Joint Declaration of the Eastern Partnership Summit 'Recovery, Resilience and Reform' of 15 December 2021 reaffirmed the strong commitment to a strategic, ambitious and forward-looking Eastern Partnership.
At the Eastern Partnership Foreign Affairs Ministerial meeting of 11 December 2023, the EU, member states and partners declared that they will step up their efforts to implement the Eastern Partnership's agenda for recovery, resilience and reform, as well as tackling challenges related to the ongoing consequences of the Russian war of aggression against Ukraine for the entire region.
In cooperation with its ENP partners, Eurostat has the responsibility 'to promote and implement the use of European and internationally recognised standards and methodology for the production of statistics, necessary for designing and monitoring policies in areas'. Eurostat manages and coordinates EU efforts to increase the capacity of the ENP countries to develop, produce and disseminate good-quality data according to European and international standards. Additional information on the policy context of the ENP is provided on the website of Directorate-General European Neighbourhood Policy and Enlargement Negotiations (DG NEAR).
Direct access to
- All articles on non-EU countries
- European_Neighbourhood_Policy_countries_-_statistical_overview — online publication
- Statistical cooperation — online publication
- Energy_statistics_-_an_overview
- Climate_change_-_driving_forces
- Environment_statistics_introduced
Books
Factsheets
- Basic figures on the European Neighbourhood Policy-East countries — 2023 edition
- Statistics for a green future — factsheets on European Neighbourhood Policy-East countries — 2022 edition
- Basic figures on the European Neighbourhood Policy-East countries — 2022 edition
- Basic figures on the European Neighbourhood Policy-East countries — 2021 edition
Leaflets
- Basic figures on the European Neighbourhood Policy — East countries — 2020 edition
- Basic figures on the European Neighbourhood Policy — East countries — 2020 edition
- Basic figures on the European Neighbourhood Policy — East countries — 2019 edition
- Basic figures on the European Neighbourhood Policy — East countries — 2018 edition
- Basic figures on the European Neighbourhood Policy — East countries — 2016 edition
- Basic figures on the European Neighbourhood Policy — East countries — 2015 edition
- Basic figures on the European Neighbourhood Policy — East countries — 2014 edition
- Climate change (cli), see:
- Greenhouse gas emissions (cli_gge)
- Waste (env_was), see:
- Waste streams (env_wasst)
- Municipal waste by waste management operation (env_wasmun)
- Waste streams (env_wasst)
- Environment (env), see:
- Water (env_wat)
- Eastern European Neighbourhood Policy countries (ENP-East) (ESMS metadata file — enpe_esms)
- Greenhouse gas emissions by source sector (source: EEA) (ESMS metadata file — env_air_gge)
- Energy statistics — supply, transformation and consumption (ESMS metadata file — nrg_quant)
- Municipal waste by waste management operations (ESMS metadata file — env_wasmun)
- Water statistics on national level (env_nwat) (ESMS metadata file — env_nwat)
- European External Action Service — European Neighbourhood Policy
- Joint Communication JOIN(2020) 7 final: Eastern Partnership policy beyond 2020: Reinforcing Resilience - an Eastern Partnership that delivers for all (18 March 2020)
- Joint Staff Working Document SWD(2021) 186 final: Recovery, resilience and reform: post 2020 Eastern Partnership priorities (2 July 2021)
- Joint Declaration of the Eastern Partnership Summit: 'Recovery, Resilience and Reform' (15 December 2021)
