EU represented 15.2% of world’s GDP in 2021

The International Comparison Program (ICP) showed that, in 2021, the EU's gross domestic product (GDP) represented 15.2% of world GDP when expressed in purchasing power standards (PPS).
The largest economy in the world in 2021 was China with about 18.9% of world GDP. The United States was the second largest, with 15.5% of world GDP. The EU was in third place, with 15.2%.
Source dataset: International Comparison Program 2021 and Eurostat calculation
Among the 20 countries in the world with a share larger than 1% of the world GDP expressed in PPS, there were 5 EU countries: Germany (3.4%), France (2.4%), Italy (1.9%), Spain (1.4%) and Poland (1.0%). They collectively contributed about 10.1% to world GDP.
This information comes from data published today by the Global Office of the International Comparison Program (ICP) at the World Bank, and are the results of the 2021 round of the ICP. The ICP is a worldwide statistical partnership to collect comparative price data and compile detailed expenditure values of countries’ GDP, estimating purchasing power parities (PPPs) for the world’s economies. Eurostat is a partner in the ICP and provided the required data for 36 European countries. This article presents a handful of findings from a more detailed Statistics Explained article.
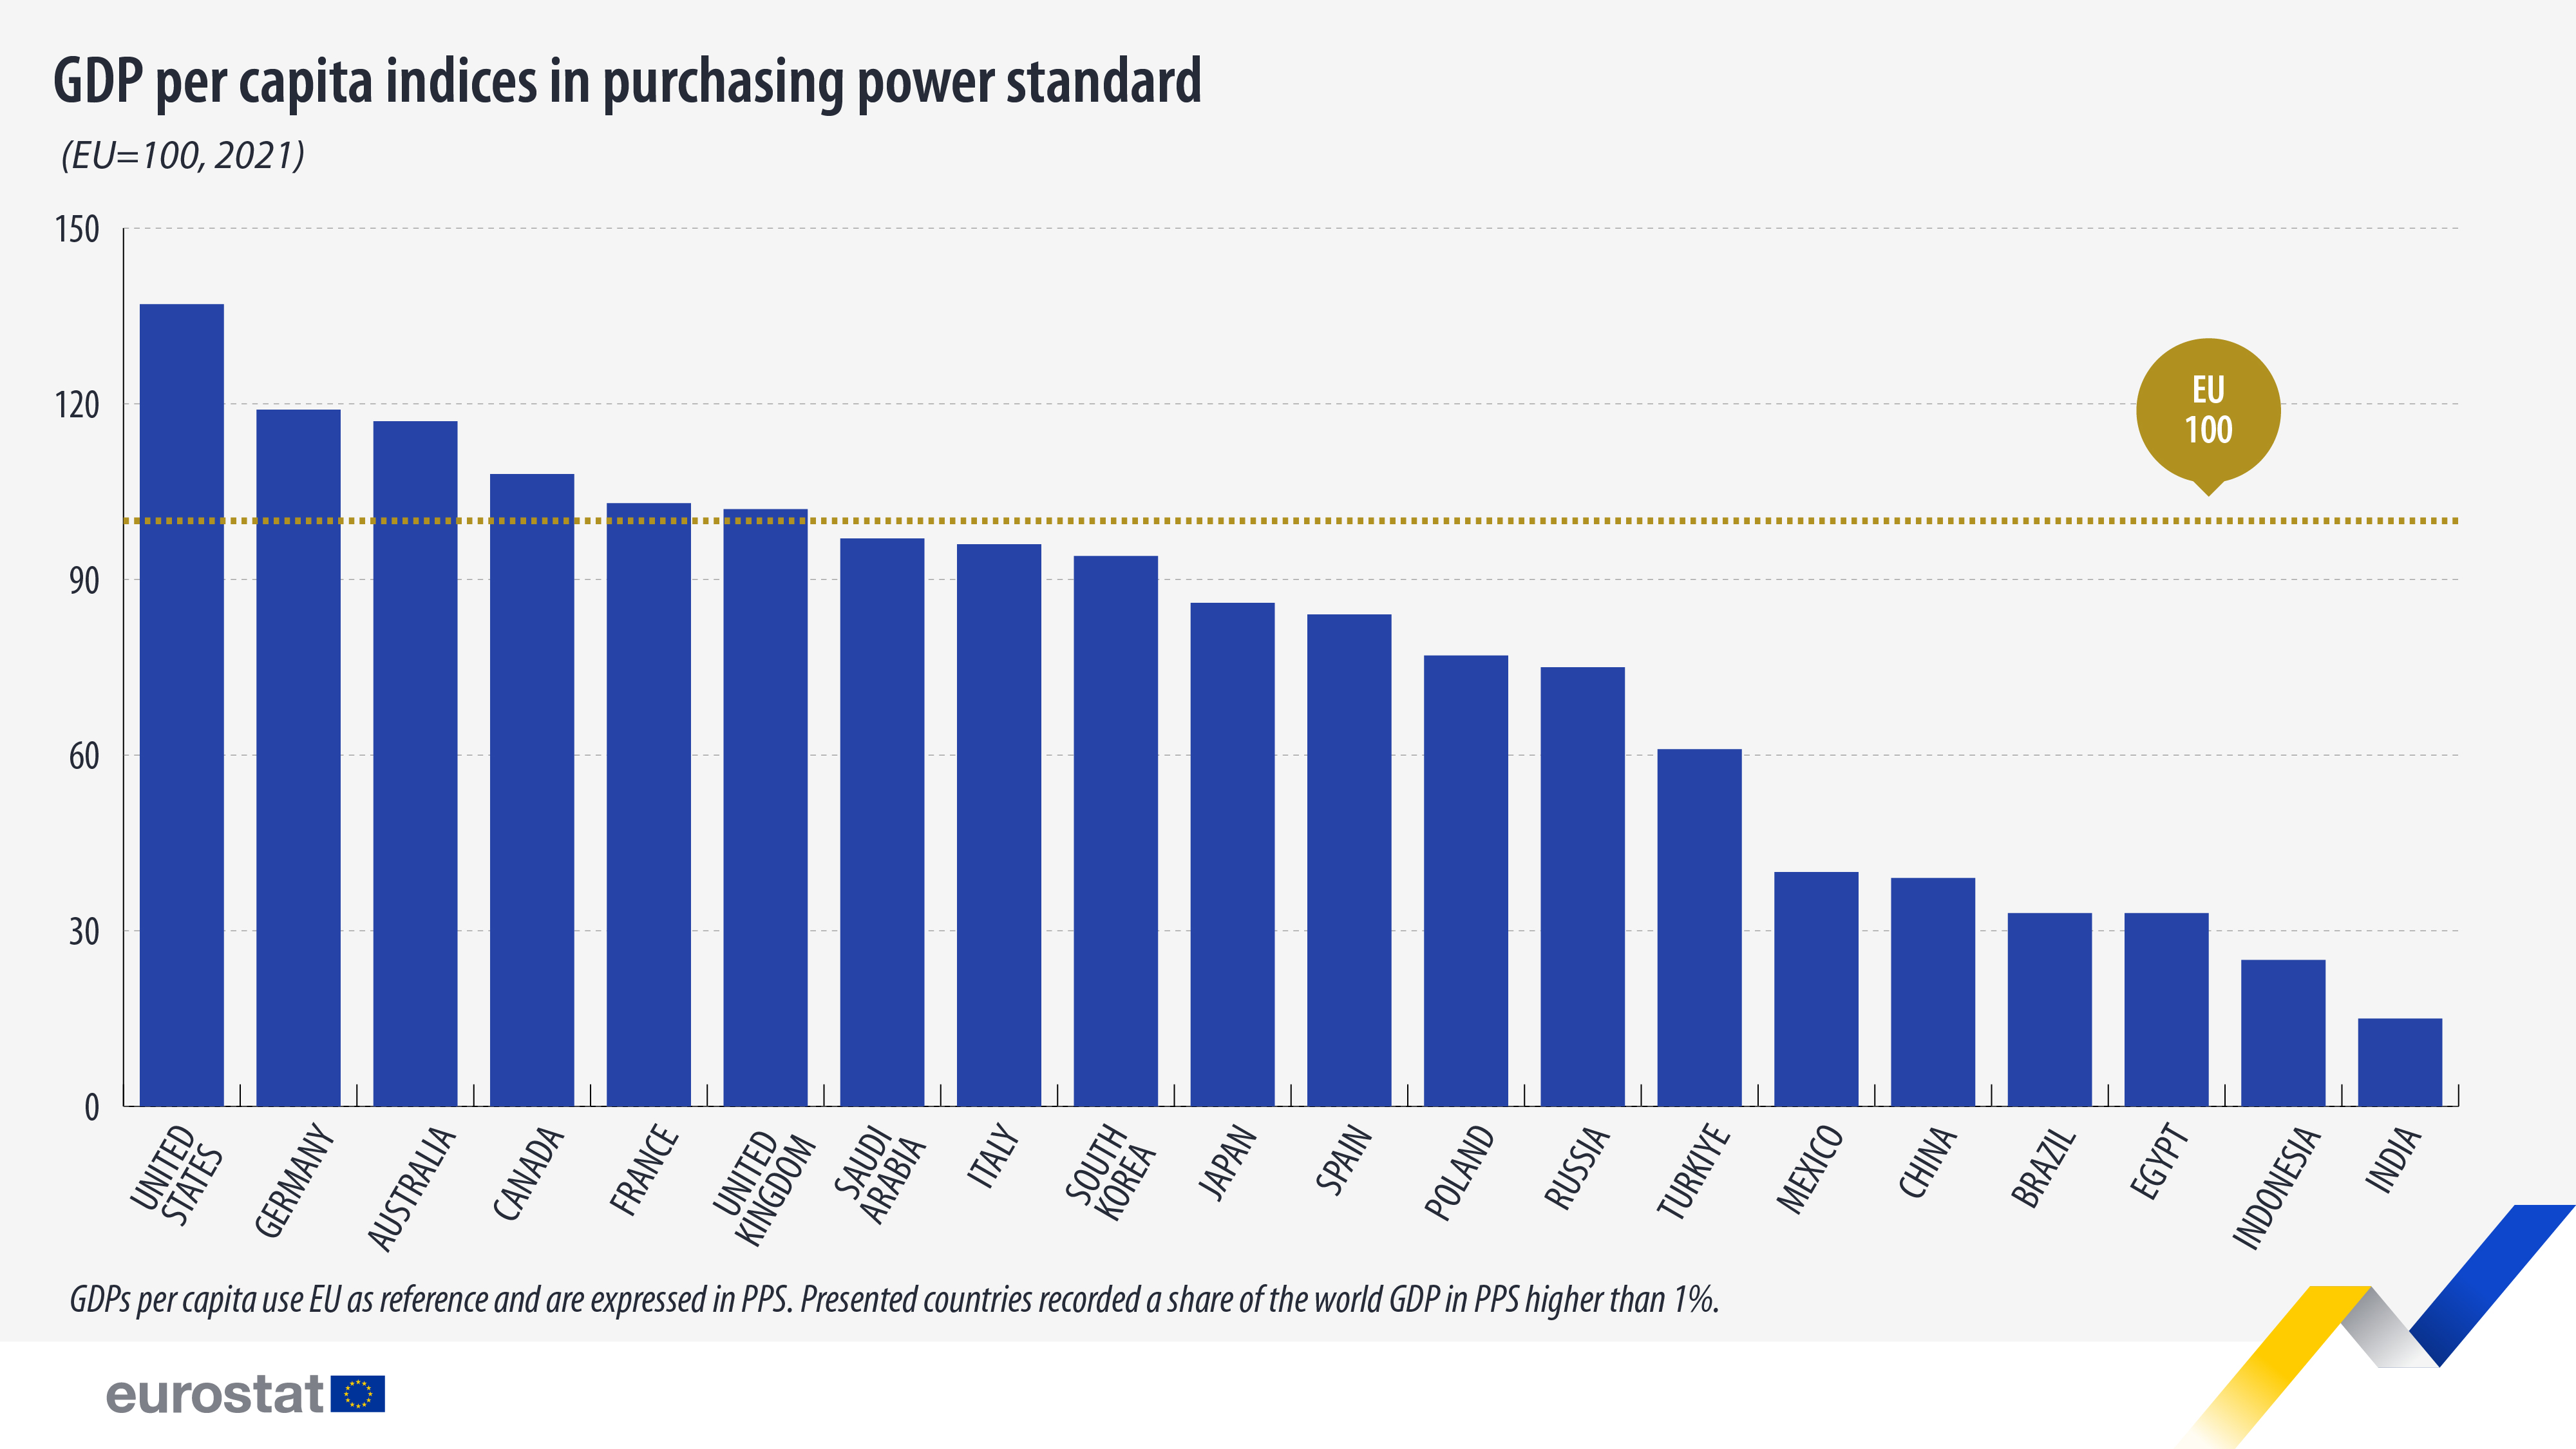
Looking at GDP per capita for the world's 20 largest economies in 2021, only 6 countries were above the EU average: the United States, Germany, Australia, Canada, France and the United Kingdom. While the Chinese economy was the largest in terms of GDP in PPS, GDP per capita was only 39% of the EU average.
There was a nine-fold difference between the highest and the lowest GDP per capita among the world’s 20 largest economies (the United States at 137% of the EU average compared with India at 15% of the EU average).
Source dataset: International Comparison Program 2021 and Eurostat calculation
For more information
- World Bank International Comparison Program website
- Statistics Explained article on purchasing power parities in Europe and the world
- Statistics Explained article on GDP per capita, consumption per capita and price level indices
- European Statistics Code of Practice
Methodological notes
- PPS is an artificial currency unit that eliminates price level differences between countries. Thus, 1 PPS buys the same volume of goods and services in all countries. This unit allows meaningful volume comparisons of economic indicators across countries. Aggregates expressed in PPS are derived by dividing aggregates in current prices and national currency by the respective purchasing power parities (PPPs). The level of uncertainty associated with the basic price and national accounts data, and the methods used for compiling PPPs imply that differences between countries that have results within a close range should not be over-interpreted.
- GDP per capita indices presented in this article use European Union as reference and are expressed in purchasing power standards (PPS).
- Eurostat is a partner in the ICP and provided the required data for 27 EU countries, Iceland, Norway, Switzerland, Montenegro, North Macedonia, Albania, Serbia, Türkiye as well as Bosnia and Herzegovina. In addition, Eurostat supported the participation of Georgia and Ukraine in the ICP. Eurostat works closely together with the Organisation for Economic Co-operation and Development (OECD) in a joint PPP program. The OECD provided the data for the non-European OECD countries.
If you have any queries, please visit our contact us page.


