EU trade in high-tech products up in 2022

In 2022, the EU imported €482 billion worth of high-tech products from extra-EU countries (+22% compared with 2021). Exports to these countries reached €446 billion (+16% compared with 2021).
More than half of imports from China and the United States
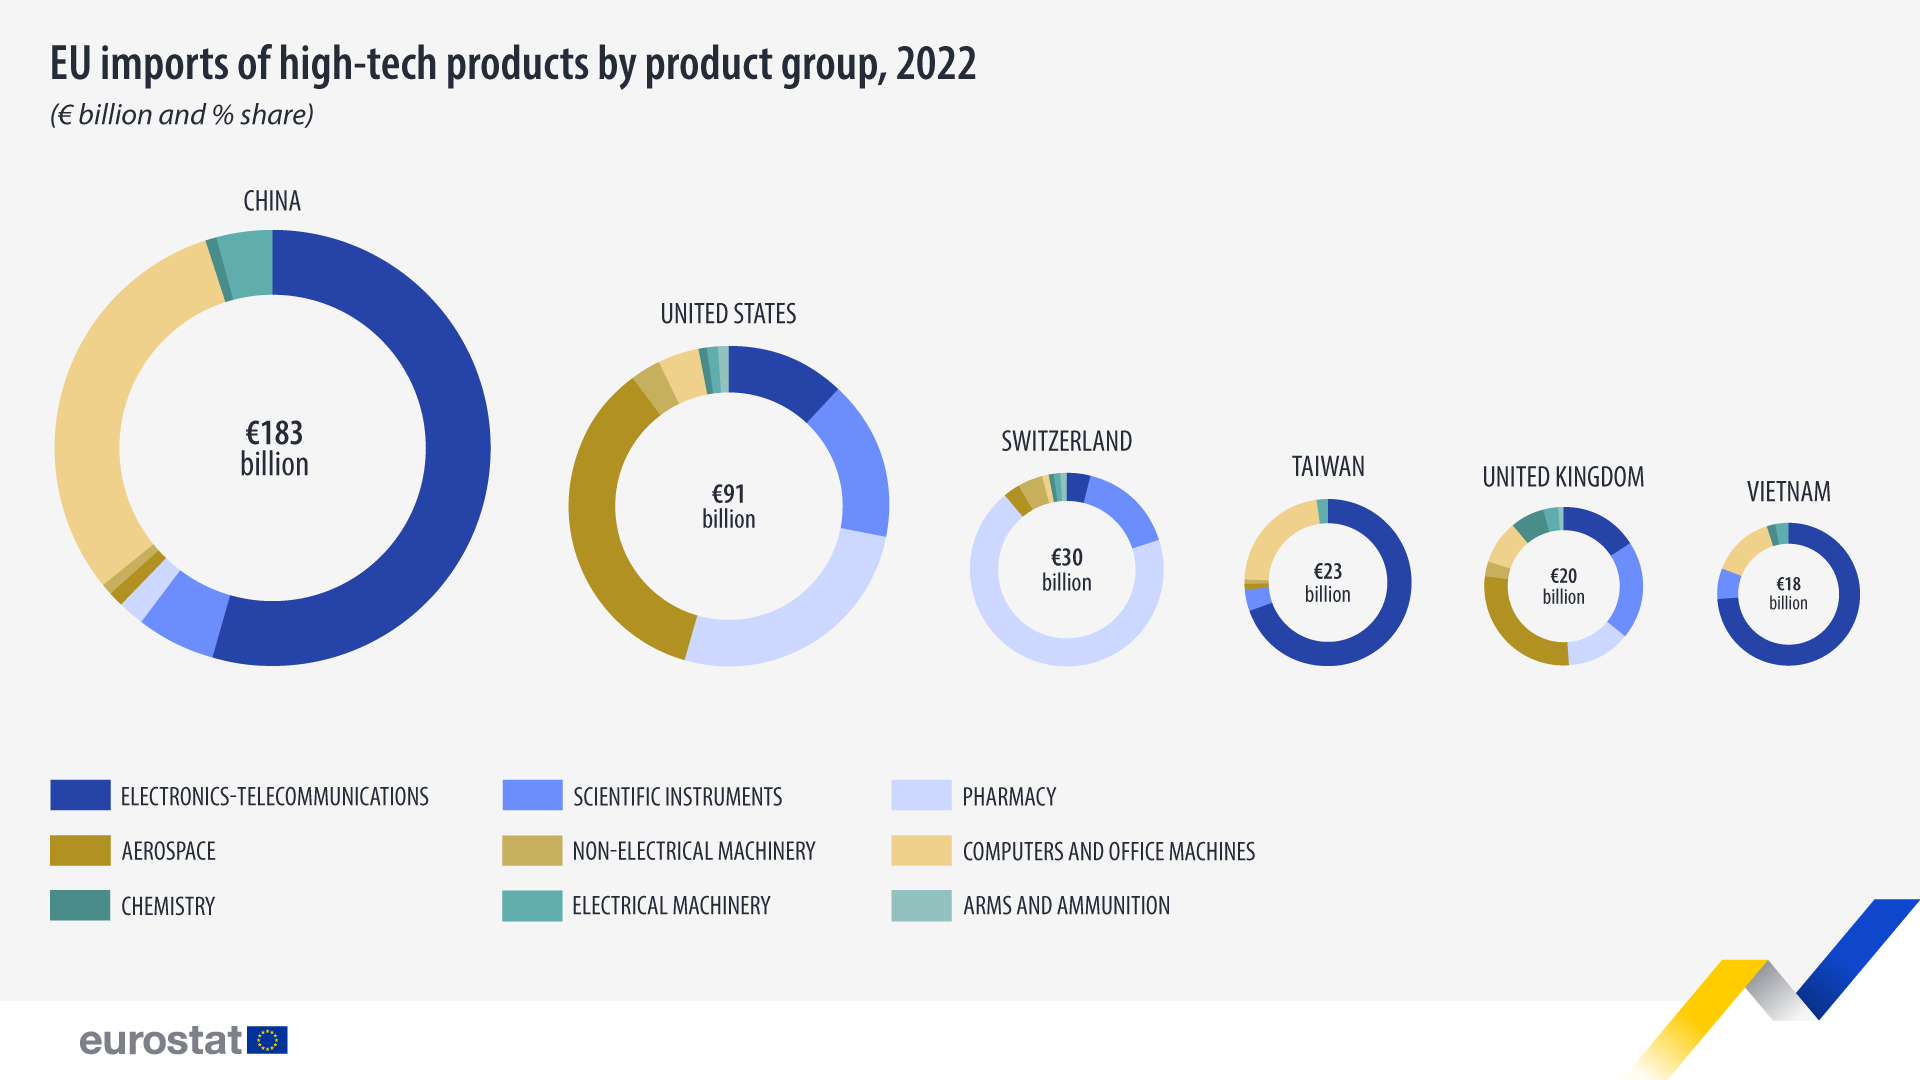
In 2022, over half of the EU’s high-tech imports from non-EU countries came from China (38%; €183 billion) and the United States (19%; €91 billion), with other top partners being Switzerland (6%; €30 billion), Taiwan (5%; €23 billion) and the United Kingdom and Vietnam (each 4%; €20 and €18 billion, respectively).
The most significant category of high-tech products imported from non-EU countries was electronics-telecommunications (€202 billion).
Source dataset: DS-018995; aggregated data
For three of the top six high-tech import partners, the largest imported category was electronics-telecommunications: Vietnam (74% of high-tech imports from Vietnam; €13 billion), Taiwan (69%; €16 billion) and China (55%; €101 billion).
For Switzerland, the largest category was pharmacy (68% of high-tech imports from Switzerland; €20 billion). For the United States (35%; €32 billion) and the United Kingdom (28%; €6 billion), it was aerospace.
Pharmacy was the largest category in exports
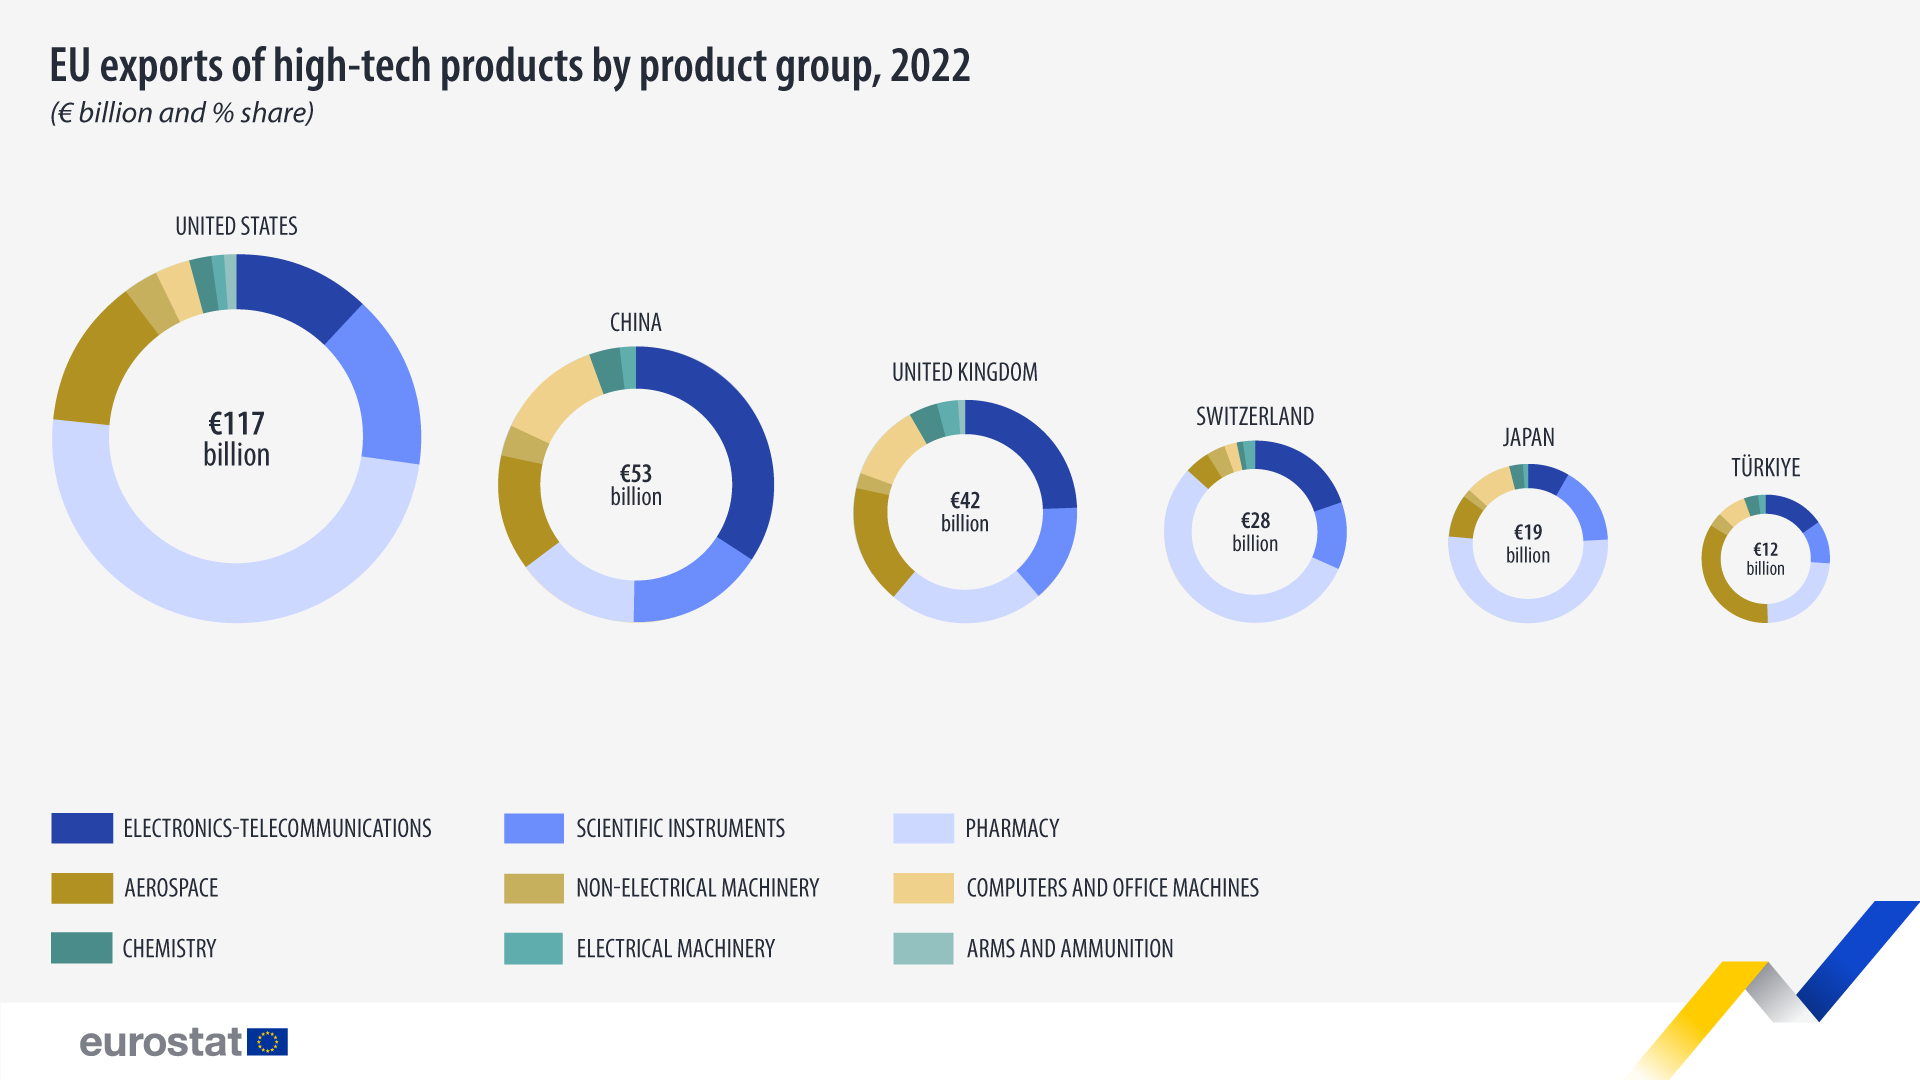
For high-tech exports to non-EU countries, the United States was the top trading partner in 2022 (26%; €118 billion), with China second (12%; €53 billion). These countries were followed by the United Kingdom (9%; €42 billion), Switzerland (6%; €28 billion), Japan (4%; €19 billion) and Türkiye (3%; €12 billion).
The most significant category of high-tech products exported to non-EU countries was pharmacy (€145 billion).
Source dataset: DS-018995; aggregated data
Pharmacy was the largest exported category for three of the top six high-tech export partners: Japan (56% of high-tech exports to Japan; €11 billion), Switzerland (50%; €14 billion) and the United States (49%; €57 billion).
The largest category for China (38% of high-tech exports to China; €20 billion) and the United Kingdom (24%; €10 billion) was electronics-telecommunication. For Türkiye, it was aerospace (38%; €5 billion).
For seven categories, the United States was the largest export destination for the EU. Different top partners were registered for electronics-telecommunications (China) and computers and office machines (the United Kingdom).
For more information
- Statistics Explained article on international trade and production of high-tech products
- Thematic section on international trade in goods
- Database on international trade in goods
- Statistics 4 Beginners on trade
Methodological notes
- Data used the high-tech aggregation by SITC Rev.4.
- As of January 2021 onwards, data on trade with the United Kingdom is based on a mixed concept. In application of the Withdrawal Agreement Protocol on Ireland/Northern Ireland, for trade with Northern Ireland, the statistical concepts applicable are the same as those for trade between Member States. On the other hand, for trade with the United Kingdom (excluding Northern Ireland), the same statistical concepts are applicable as for trade with any other extra-EU partner country. For these reasons, data on trade with the United Kingdom are not fully comparable with data on trade with other extra-EU trade partners, and for reference periods before and after the end of 2020.
If you have any queries, please visit our contact us page.


