|
|
||||||||||||||||||||||||||||||||||||||||||||||||||||||||||||||||||||||||||||||||||||||||||||||||||||||
| For any question on data and metadata, please contact: Eurostat user support |
|
|||
| 1.1. Contact organisation | Eurostat, the statistical office of the European Union. |
||
| 1.2. Contact organisation unit | E2: Environmental statistics and accounts; sustainable development |
||
| 1.5. Contact mail address | 2920 Luxembourg, LUXEMBOURG |
||
|
|||
| 2.1. Metadata last certified | 11 December 2024 | ||
| 2.2. Metadata last posted | 11 December 2024 | ||
| 2.3. Metadata last update | 11 December 2024 | ||
|
|||||||||||||||
| 3.1. Data description | |||||||||||||||
This metadata refers to three datasets based on the data collection on air emissions accounts (AEA): 1. Air emissions accounts by NACE Rev. 2 activity [env_ac_ainah_r2] This data set reports the emissions of greenhouse gases and air pollutants broken down by 64 industries (classified by NACE Rev. 2) plus households. Concepts and principles are the same as in national accounts. Complete data starts from reference year 2008. 2. Air emissions intensities by NACE Rev. 2 activity [env_ac_aeint_r2] This data set presents intensity-ratios relating AEA emissions (see previous) to economic parameters (value added, production output) for 64 industries (classified by NACE Rev. 2). 3. Air emissions accounts totals bridging to emission inventory totals [env_ac_aibrid_r2] This data set includes so-called bridging items showing the differences between the national totals as derived from two internationally established approaches/methods for reporting emissions of greenhouse gases and air pollutants:
The two methodologies are based on slightly different concepts and principles and the totals at national and EU level correspondingly differ. The bridging items explicitly present these differences. 4. Air emissions accounts related to road transport by NACE Rev. 2 activity (env_ac_ainah_rd) This voluntary data set includes emissions of CO2, NOx, PM2.5, PM10 and NMVOC from road transport broken down by 64 industries (classified by NACE Rev. 2) plus households. 5. Air emissions accounts related to road transport - totals bridging to emission inventory totals (env_ac_aibrid_rd) This data set includes so-called bridging items related to road transport showing the differences between the national totals as derived from two internationally established approaches/methods for reporting emissions of greenhouse gases and air pollutants. See also point 3. |
|||||||||||||||
| 3.2. Classification system | |||||||||||||||
The dataset air emissions accounts by NACE Rev. 2 activity [env_ac_ainah_r2] has five dimensions:
The data set air emissions intensities by NACE Rev. 2 activity [env_ac_aeint_r2] has six dimensions:
The data set air emissions accounts totals bridging to emission inventory totals [env_ac_aibrid_r2] has 5 dimensions:
The data set Air emissions accounts related to road transport by NACE Rev. 2 activity [env_ac_ainah_rd] has 5 dimensions:
The data set Air emissions accounts related to road transport - totals bridging to emission inventory totals [env_ac_aibrid_rd] has 5 dimensions:
|
|||||||||||||||
| 3.3. Coverage - sector | |||||||||||||||
Greenhouse gases and air pollutants emitted by the entire national economy are covered. |
|||||||||||||||
| 3.4. Statistical concepts and definitions | |||||||||||||||
Air Emissions Accounts record the flows of residual gaseous and particulate materials emitted by resident units and flowing into the atmosphere. Residual gaseous and particulate materials are the physical flows of gaseous or particulate materials (‘air emissions’). Air emissions accounts record emissions arising from the activities of all resident units (=economic activities), regardless of where these emissions actually occur geographically. Air emissions accounts have the same system boundaries as ESA and are also based on the residence principle. Natural flows of residual gaseous and particulate materials are excluded e.g. volcanos, forest fires. Also excluded are air emissions arising from land use, land use changes and forestry as well as any indirect emissions. The concepts and definitions used in the Air Emissions Accounts are set out in the SEEA CF 2012, see annex. Annexes: Methodology (including SEEA CF 2012) |
|||||||||||||||
| 3.5. Statistical unit | |||||||||||||||
Data refer to emissions by resident economic units in the sense of SEEA CF 2012 and National Accounts (ESA), including households. |
|||||||||||||||
| 3.6. Statistical population | |||||||||||||||
The national economy is as defined in SEEA CF 2012 and National Accounts (ESA), i.e. all economic activities undertaken by resident units. |
|||||||||||||||
| 3.7. Reference area | |||||||||||||||
The reference area is the economic territory as defined in SEEA CF 2012 and National Accounts (ESA). A unit is said to be a resident unit of a country when it has a centre of economic interest in the economic territory of that country, that is, when it engages for an extended period (1 year or more) in economic activities in that territory. By following this residence principle, the Air Emission Accounts record emissions from resident units' activities, regardless where they occur. This is the main conceptual difference to emission inventories for greenhouse gases (UNFCCC) and air pollutants (CLRTAP). |
|||||||||||||||
| 3.8. Coverage - Time | |||||||||||||||
Data are annual. In NACE rev. 2 breakdown complete time series are available since 2008. For some countries longer time series are available. For greenhouse gases (GHG) Eurostat estimates AEA for one additional year beyond the mandatory reporting (year n-1, being n the year of the AEA data collection) for EU Member States and the aggregated EU. For the detailed methodology and results see the Note on Eurostat's procedure for early estimates of greenhouse gases (GHG) and the Assessment of early estimates for reference year 2020 in Annex. Annexes: Eurostat's procedure for early estimates of greenhouse gases (GHG) AEA - Assessment of early estimates for reference year 2020 |
|||||||||||||||
| 3.9. Base period | |||||||||||||||
Not applicable. |
|||||||||||||||
|
|||
The air emissions [env_ac_ainah_r2], [env_ac_ainah_rd]and the bridging items [env_ac_aibrid_r2], [env_ac_aibrid_rd] are presented in tonnes and thousand tonnes, as well as grams per capita and kilograms per capita. Air emissions intensities [env_ac_aeint_r2] are presented in grams per euro and kilograms per euro. |
|||
|
|||
The data refer to the calendar year. |
|||
|
|||
| 6.1. Institutional Mandate - legal acts and other agreements | |||
AEA are legally covered by Regulation (EC) No. 691/2011 on European environmental economic accounts (EEEA). EEEA currently include six modules (air emissions accounts, environmentally related taxes by economic activity, economy-wide material flow accounts, environmental protection expenditure accounts, environmental goods and services sector accounts, and physical energy flow accounts). The EEEA are fully in accordance with internationally agreed concepts and definitions set out in the system of environmental economic accounting 2012 – central framework (SEEA CF 2012, see annex). The SEEA CF is a multi-purpose conceptual framework to report the interactions between the environment and the economy. EEEA present environmental information in a way that is fully compatible with National Accounts. |
|||
| 6.2. Institutional Mandate - data sharing | |||
Not applicable. |
|||
|
|||
| 7.1. Confidentiality - policy | |||
Regulation (EC) No 223/2009 on European statistics (recital 24 and Article 20(4)) of 11 March 2009 (OJ L 87, p. 164), stipulates the need to establish common principles and guidelines ensuring the confidentiality of data used for the production of European statistics and the access to those confidential data with due account for technical developments and the requirements of users in a democratic society. |
|||
| 7.2. Confidentiality - data treatment | |||
Confidential data are flagged "confidential" and not published. Aggregates of confidential data respect Eurostat confidentiality rules. |
|||
|
|||
| 8.1. Release calendar | |||
Data are published as planned in the release calendar of Eurostat: Please visit this webiste. |
|||
| 8.2. Release calendar access | |||
Data are published as planned in the release calendar of Eurostat: Please visit this website. |
|||
| 8.3. Release policy - user access | |||
In line with the Community legal framework and the European Statistics Code of Practice Eurostat disseminates European statistics on Eurostat's website (see item 10 - 'Accessibility and clarity') respecting professional independence and in an objective, professional and transparent manner in which all users are treated equitably. The detailed arrangements are governed by the Eurostat protocol on impartial access to Eurostat data for users. Data are disseminated simultaneously to all interested parties through a database update and on Eurostat's website. |
|||
|
|||
Data are disseminated annually. |
|||
|
|||
| 10.1. Dissemination format - News release | |||
The data are accompanied by a news item. |
|||
| 10.2. Dissemination format - Publications | |||
Statistics Explained articles: |
|||
| 10.3. Dissemination format - online database | |||
The online database is available free of charge. |
|||
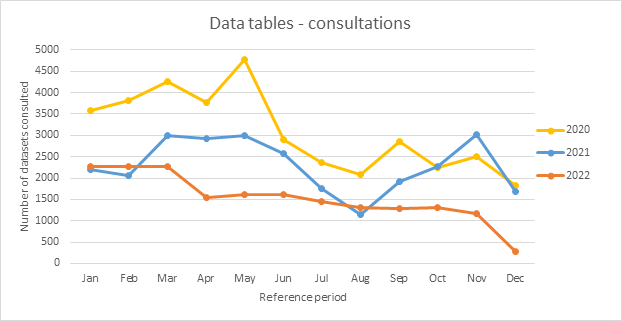
| 10.3.1. Data tables - consultations | |||
Consultations of Eurostat online database 'EUROBASE' – data sets This quality performance indicator presents the number of consultations of online data sets taking into account the following parameters:
|
|||
| 10.4. Dissemination format - microdata access | |||
Not applicable. |
|||
| 10.5. Dissemination format - other | |||
Not applicable. |
|||
| 10.5.1. Metadata - consultations | |||
Consultations of Eurostat online database 'EUROBASE' - metadata This quality performance indicator presents the number of consultations of online metadata taking into account the following parameters:
|
|||
| 10.6. Documentation on methodology | |||
Information is available on Eurostat's website.
|
|||
| 10.6.1. Metadata completeness - rate | |||
Metadata completeness - rate This quality performance indicator presents the ‘ratio of completeness’ by country. It is defined as the number of metadata elements provided by countries in relation to the total number of metadata elements applicable. The following parameters are taken into account:
The total number of metadata elements applicable include the following:
Metadata completeness rate is 100%. |
|||
| 10.7. Quality management - documentation | |||
Member States provide quality reports, according to Regulation 691/2011, article 7. |
|||

|
|||
| 11.1. Quality assurance | |||
To ensure quality of the data Eurostat implements the following procedures/guidelines:
|
|||
| 11.2. Quality management - assessment | |||
Quality management is good. Validation procedures, estimation of missing statistical data (gap-filling) and quality reporting are in place. The Environmental Accounts Working Group, encompassing representatives of all Member States, Eurostat and other stakeholders, discusses quality improvements. Because Air Emission Accounts are a relatively recent data collection (started in 2013 according to Regulation 691/2011) improvements in the next years are realistic. Areas for improvement include reporting of bridging items, coverage of certain pollutants and industries, etc. |
|||
|
|||||||||||||||||||||||||||||||||||||||||||||||||||||||||||||||||||||||||||||||||||||||||||||||||||||||||||||||||||||||||||||||||||||||||||||||||||||||||||||||||||||||||||||||||||||||||||||||||||||||||||||||||||||||||||||||||||||||||||||||||||||||||||||||||||||||||||||||||||||||||||||||||||||||||||||||||||||||||||||||
| 12.1. Relevance - User Needs | |||||||||||||||||||||||||||||||||||||||||||||||||||||||||||||||||||||||||||||||||||||||||||||||||||||||||||||||||||||||||||||||||||||||||||||||||||||||||||||||||||||||||||||||||||||||||||||||||||||||||||||||||||||||||||||||||||||||||||||||||||||||||||||||||||||||||||||||||||||||||||||||||||||||||||||||||||||||||||||||
Air emissions are relevant for monitoring the interaction between the economy and the environment, in particular in a context of global climate change. Air emission accounts data are also used in modelling, including carbon footprint. The relevance of air emission accounts is enhanced by using a conceptual framework consistent with National Accounts, which allows, e.g. to put in relation with estimates of production, value added, employment, GDP, etc. The users include policy makers in environmental ministries, environmental organisations, students and interested citizens.
|
|||||||||||||||||||||||||||||||||||||||||||||||||||||||||||||||||||||||||||||||||||||||||||||||||||||||||||||||||||||||||||||||||||||||||||||||||||||||||||||||||||||||||||||||||||||||||||||||||||||||||||||||||||||||||||||||||||||||||||||||||||||||||||||||||||||||||||||||||||||||||||||||||||||||||||||||||||||||||||||||
| 12.2. Relevance - User Satisfaction | |||||||||||||||||||||||||||||||||||||||||||||||||||||||||||||||||||||||||||||||||||||||||||||||||||||||||||||||||||||||||||||||||||||||||||||||||||||||||||||||||||||||||||||||||||||||||||||||||||||||||||||||||||||||||||||||||||||||||||||||||||||||||||||||||||||||||||||||||||||||||||||||||||||||||||||||||||||||||||||||
There are no systematic studies of user satisfaction. Eurostat has regular hearings with European policymakers and contacts with the research community and other stakeholders to monitor the relevance of the statistics produced and identify new priorities. |
|||||||||||||||||||||||||||||||||||||||||||||||||||||||||||||||||||||||||||||||||||||||||||||||||||||||||||||||||||||||||||||||||||||||||||||||||||||||||||||||||||||||||||||||||||||||||||||||||||||||||||||||||||||||||||||||||||||||||||||||||||||||||||||||||||||||||||||||||||||||||||||||||||||||||||||||||||||||||||||||
| 12.3. Completeness | |||||||||||||||||||||||||||||||||||||||||||||||||||||||||||||||||||||||||||||||||||||||||||||||||||||||||||||||||||||||||||||||||||||||||||||||||||||||||||||||||||||||||||||||||||||||||||||||||||||||||||||||||||||||||||||||||||||||||||||||||||||||||||||||||||||||||||||||||||||||||||||||||||||||||||||||||||||||||||||||
Data are complete, meaning they encompass all the sectors of the economy. Data for all Member States are available, as well as some EFTA countries and EU candidate countries. In case of missing data (pollutants, years, NACE sectors), Eurostat estimates the missing information for 13 pollutants and for years starting with 2008. Data sets related to road transport emisisons are voluntary. |
|||||||||||||||||||||||||||||||||||||||||||||||||||||||||||||||||||||||||||||||||||||||||||||||||||||||||||||||||||||||||||||||||||||||||||||||||||||||||||||||||||||||||||||||||||||||||||||||||||||||||||||||||||||||||||||||||||||||||||||||||||||||||||||||||||||||||||||||||||||||||||||||||||||||||||||||||||||||||||||||
| 12.3.1. Data completeness - rate | |||||||||||||||||||||||||||||||||||||||||||||||||||||||||||||||||||||||||||||||||||||||||||||||||||||||||||||||||||||||||||||||||||||||||||||||||||||||||||||||||||||||||||||||||||||||||||||||||||||||||||||||||||||||||||||||||||||||||||||||||||||||||||||||||||||||||||||||||||||||||||||||||||||||||||||||||||||||||||||||
Data completeness rate, in % This quality performance indicator presents data completeness rates by geographical entity taking into account the following parameters:
|
|||||||||||||||||||||||||||||||||||||||||||||||||||||||||||||||||||||||||||||||||||||||||||||||||||||||||||||||||||||||||||||||||||||||||||||||||||||||||||||||||||||||||||||||||||||||||||||||||||||||||||||||||||||||||||||||||||||||||||||||||||||||||||||||||||||||||||||||||||||||||||||||||||||||||||||||||||||||||||||||
|
|||
| 13.1. Accuracy - overall | |||
The overall accuracy is considered to be good. |
|||
| 13.2. Sampling error | |||
Not applicable to statistical accounts. |
|||
| 13.2.1. Sampling error - indicators | |||
Not applicable because data are not based on a sample survey. |
|||
| 13.3. Non-sampling error | |||
Not applicable to statistical accounts. |
|||
| 13.3.1. Coverage error | |||
Not applicable. |
|||
| 13.3.1.1. Over-coverage - rate | |||
Not applicable. |
|||
| 13.3.1.2. Common units - proportion | |||
Not applicable. |
|||
| 13.3.2. Measurement error | |||
Not applicable. |
|||
| 13.3.3. Non response error | |||
Not applicable. |
|||
| 13.3.3.1. Unit non-response - rate | |||
Not applicable. |
|||
| 13.3.3.2. Item non-response - rate | |||
Not applicable. |
|||
| 13.3.4. Processing error | |||
Not applicable. |
|||
| 13.3.5. Model assumption error | |||
Not applicable. |
|||
|
||||||||||||||||||||||||||||||||||||||||||||||||||||||||||||||||||||||||||||||||||||||||||||||||||||||||||||||||||||||||||||||||||||||||||||||||||||||||||||||||||||||||||||||||||||||||||||||||||||||||||||||||||||||||||||||||||||||||||||||||
| 14.1. Timeliness | ||||||||||||||||||||||||||||||||||||||||||||||||||||||||||||||||||||||||||||||||||||||||||||||||||||||||||||||||||||||||||||||||||||||||||||||||||||||||||||||||||||||||||||||||||||||||||||||||||||||||||||||||||||||||||||||||||||||||||||||||
Every year Member States transmit data to Eurostat about the previous reference year by 30 September i.e., with a timeliness of T+21 months. After validation Eurostat publishes the data around December (i.e. T+24m). |
||||||||||||||||||||||||||||||||||||||||||||||||||||||||||||||||||||||||||||||||||||||||||||||||||||||||||||||||||||||||||||||||||||||||||||||||||||||||||||||||||||||||||||||||||||||||||||||||||||||||||||||||||||||||||||||||||||||||||||||||
| 14.1.1. Time lag - first result | ||||||||||||||||||||||||||||||||||||||||||||||||||||||||||||||||||||||||||||||||||||||||||||||||||||||||||||||||||||||||||||||||||||||||||||||||||||||||||||||||||||||||||||||||||||||||||||||||||||||||||||||||||||||||||||||||||||||||||||||||
Not applicable. |
||||||||||||||||||||||||||||||||||||||||||||||||||||||||||||||||||||||||||||||||||||||||||||||||||||||||||||||||||||||||||||||||||||||||||||||||||||||||||||||||||||||||||||||||||||||||||||||||||||||||||||||||||||||||||||||||||||||||||||||||
| 14.1.2. Time lag - final result | ||||||||||||||||||||||||||||||||||||||||||||||||||||||||||||||||||||||||||||||||||||||||||||||||||||||||||||||||||||||||||||||||||||||||||||||||||||||||||||||||||||||||||||||||||||||||||||||||||||||||||||||||||||||||||||||||||||||||||||||||
Not applicable. |
||||||||||||||||||||||||||||||||||||||||||||||||||||||||||||||||||||||||||||||||||||||||||||||||||||||||||||||||||||||||||||||||||||||||||||||||||||||||||||||||||||||||||||||||||||||||||||||||||||||||||||||||||||||||||||||||||||||||||||||||
| 14.2. Punctuality | ||||||||||||||||||||||||||||||||||||||||||||||||||||||||||||||||||||||||||||||||||||||||||||||||||||||||||||||||||||||||||||||||||||||||||||||||||||||||||||||||||||||||||||||||||||||||||||||||||||||||||||||||||||||||||||||||||||||||||||||||
Deadline of data delivery is 30 September. |
||||||||||||||||||||||||||||||||||||||||||||||||||||||||||||||||||||||||||||||||||||||||||||||||||||||||||||||||||||||||||||||||||||||||||||||||||||||||||||||||||||||||||||||||||||||||||||||||||||||||||||||||||||||||||||||||||||||||||||||||
| 14.2.1. Punctuality - delivery and publication | ||||||||||||||||||||||||||||||||||||||||||||||||||||||||||||||||||||||||||||||||||||||||||||||||||||||||||||||||||||||||||||||||||||||||||||||||||||||||||||||||||||||||||||||||||||||||||||||||||||||||||||||||||||||||||||||||||||||||||||||||
Punctuality of data delivery by country and Eurostat data dissemination This quality performance indicator presents several metrics related to the punctuality of data delivery and publication taking into account the following parameters:
|
||||||||||||||||||||||||||||||||||||||||||||||||||||||||||||||||||||||||||||||||||||||||||||||||||||||||||||||||||||||||||||||||||||||||||||||||||||||||||||||||||||||||||||||||||||||||||||||||||||||||||||||||||||||||||||||||||||||||||||||||
|
|||||||||||||||||||||||||||||||||||||||||||||
| 15.1. Comparability - geographical | |||||||||||||||||||||||||||||||||||||||||||||
The comparability across countries is good due to clear statistical concepts and definitions. |
|||||||||||||||||||||||||||||||||||||||||||||
| 15.1.1. Asymmetry for mirror flow statistics - coefficient | |||||||||||||||||||||||||||||||||||||||||||||
Not applicable. |
|||||||||||||||||||||||||||||||||||||||||||||
| 15.2. Comparability - over time | |||||||||||||||||||||||||||||||||||||||||||||
The comparability over time is good due to clear statistical concepts and definitions. |
|||||||||||||||||||||||||||||||||||||||||||||
| 15.2.1. Length of comparable time series | |||||||||||||||||||||||||||||||||||||||||||||
Length of comparable time series This quality performance indicator presents the number of ‘breaks in time series’ taking into account the following parameters:
Comparing two most recent data collection cycles: the number of b)-flag has increased between the 2022 and 2023 data collection cycles due to the changes in methodology, especially related to the figures for Italy.
|
|||||||||||||||||||||||||||||||||||||||||||||
| 15.3. Coherence - cross domain | |||||||||||||||||||||||||||||||||||||||||||||
The data are coherent with principles, definitions and concepts in National Accounts (ESA - European System of Accounts) and Environmental Accounting (SEEA - System of Environmental-Economic Accounting). It is important that air emissions accounts (AEA) and physical energy flow accounts (PEFA) employ the same groupings of elementary economic units (NACE Rev. 2 activities) as the ESA supply and use tables. This coherence is important with regards to integrated analyses – e.g. applying Leontief-type input-output analysis. As an overarching general rule AEA and PEFA must apply exactly the same demarcation of productive activities (NACE Rev. 2 activities) as employed for the compilation of the monetary supply and use tables delivered to Eurostat under the ESA transmission programme. Compilers of AEA and PEFA are advised to contact and align with compilers of ESA supply and use tables with the aim to ensure highest coherence between AEA, PEFA and ESA supply and use tables. However, it has to be noted that this coherence is not always fully provided. |
|||||||||||||||||||||||||||||||||||||||||||||
| 15.3.1. Coherence - sub annual and annual statistics | |||||||||||||||||||||||||||||||||||||||||||||
Not applicable; reported AEA data are only annual. |
|||||||||||||||||||||||||||||||||||||||||||||
| 15.3.2. Coherence - National Accounts | |||||||||||||||||||||||||||||||||||||||||||||
The reported AEA data is consistent with ESA. |
|||||||||||||||||||||||||||||||||||||||||||||
| 15.4. Coherence - internal | |||||||||||||||||||||||||||||||||||||||||||||
The internal coherence is very high, ensured by the accounting framework. |
|||||||||||||||||||||||||||||||||||||||||||||

|
|||
Depending on the level of automatisation the costs and burden range from 5 to 40 person-days per country and 40 person-days for Eurostat. |
|||
|
|||||||||||||||||||||||||||||||||||||||||||||||||||||||||||||||||||||||||||||||||||||||||||||||||||||||||||||||||||||||||||||||||||||||||||||||||||||||||||||||||||||||||||||||||||||||||||||||||||||||||||||||||||||||||||||||||||||||||||||||||||||||||||||||||||||||||||||||||||||||||||||||||||||||||||||||||||||||||||||||||||||||||||||||||||||||||||||||||||||||||||||||||||||||||||||||||||||||||||||||||||||||||||||||||||||||||||||||||||
| 17.1. Data revision - policy | |||||||||||||||||||||||||||||||||||||||||||||||||||||||||||||||||||||||||||||||||||||||||||||||||||||||||||||||||||||||||||||||||||||||||||||||||||||||||||||||||||||||||||||||||||||||||||||||||||||||||||||||||||||||||||||||||||||||||||||||||||||||||||||||||||||||||||||||||||||||||||||||||||||||||||||||||||||||||||||||||||||||||||||||||||||||||||||||||||||||||||||||||||||||||||||||||||||||||||||||||||||||||||||||||||||||||||||||||||
To further specify the general Eurostat revision policy, the following revision policy has been established: Every year Eurostat publishes the complete time series, which may lead to revisions of data previously published. Data are not revised in between annual releases. During first months after the first data release revisions may be possible. The datasets are frozen afterwards, usually in March. |
|||||||||||||||||||||||||||||||||||||||||||||||||||||||||||||||||||||||||||||||||||||||||||||||||||||||||||||||||||||||||||||||||||||||||||||||||||||||||||||||||||||||||||||||||||||||||||||||||||||||||||||||||||||||||||||||||||||||||||||||||||||||||||||||||||||||||||||||||||||||||||||||||||||||||||||||||||||||||||||||||||||||||||||||||||||||||||||||||||||||||||||||||||||||||||||||||||||||||||||||||||||||||||||||||||||||||||||||||||
| 17.2. Data revision - practice | |||||||||||||||||||||||||||||||||||||||||||||||||||||||||||||||||||||||||||||||||||||||||||||||||||||||||||||||||||||||||||||||||||||||||||||||||||||||||||||||||||||||||||||||||||||||||||||||||||||||||||||||||||||||||||||||||||||||||||||||||||||||||||||||||||||||||||||||||||||||||||||||||||||||||||||||||||||||||||||||||||||||||||||||||||||||||||||||||||||||||||||||||||||||||||||||||||||||||||||||||||||||||||||||||||||||||||||||||||
Every year the AEA questionnaire requests the entire time series. If air emission data are revised by countries, it is done for the complete time series. Reported errors are assessed for seriousness to determine whether they should trigger a correction of already disseminated data. Reported errors are corrected in the disseminated data as soon as the correct data have been validated. New data are only used to update disseminated data if provided according to the provision schedule set by Eurostat, or in the case of reported errors. |
|||||||||||||||||||||||||||||||||||||||||||||||||||||||||||||||||||||||||||||||||||||||||||||||||||||||||||||||||||||||||||||||||||||||||||||||||||||||||||||||||||||||||||||||||||||||||||||||||||||||||||||||||||||||||||||||||||||||||||||||||||||||||||||||||||||||||||||||||||||||||||||||||||||||||||||||||||||||||||||||||||||||||||||||||||||||||||||||||||||||||||||||||||||||||||||||||||||||||||||||||||||||||||||||||||||||||||||||||||
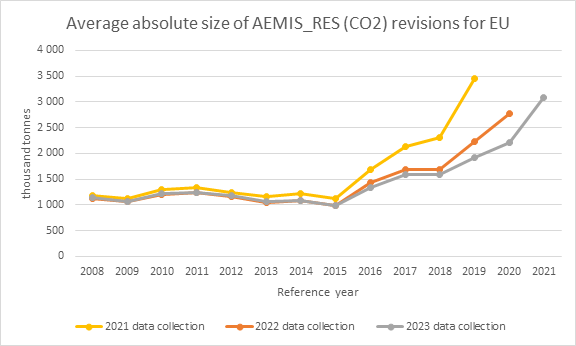
| 17.2.1. Data revision - average size | |||||||||||||||||||||||||||||||||||||||||||||||||||||||||||||||||||||||||||||||||||||||||||||||||||||||||||||||||||||||||||||||||||||||||||||||||||||||||||||||||||||||||||||||||||||||||||||||||||||||||||||||||||||||||||||||||||||||||||||||||||||||||||||||||||||||||||||||||||||||||||||||||||||||||||||||||||||||||||||||||||||||||||||||||||||||||||||||||||||||||||||||||||||||||||||||||||||||||||||||||||||||||||||||||||||||||||||||||||
Average absolute size of 'AEMIS_RES' revisions by country and year This quality performance indicator presents the average size of revisions for one important AEA indicator, namely 'AEMIS_RES'. The following parameters are taken into account:
Remarks:
Comparing three most recent data collection cycles: The data collection cycle 2023 shows less average absolute revisions of AEMIS_RES for CO2 than the previous data collection cycles.
|
|||||||||||||||||||||||||||||||||||||||||||||||||||||||||||||||||||||||||||||||||||||||||||||||||||||||||||||||||||||||||||||||||||||||||||||||||||||||||||||||||||||||||||||||||||||||||||||||||||||||||||||||||||||||||||||||||||||||||||||||||||||||||||||||||||||||||||||||||||||||||||||||||||||||||||||||||||||||||||||||||||||||||||||||||||||||||||||||||||||||||||||||||||||||||||||||||||||||||||||||||||||||||||||||||||||||||||||||||||
|
|||
| 18.1. Source data | |||
The main data sources are national emission inventories (UNFCCC/CLRTAP) and energy statistics/balances. |
|||
| 18.2. Frequency of data collection | |||
Data are collected annually. |
|||
| 18.3. Data collection | |||
AEA data collection is regulated by Regulation (EC) No. 691/2011 on European environmental economic accounts. |
|||
| 18.4. Data validation | |||
Data are extensively checked via comprehensive validation procedure using IT. The validation rules can be found here: Validation rules for air emissions accounts 2023 data collection. More about data validation can be found at this webiste (Data validation) and in point 11.1. |
|||
| 18.5. Data compilation | |||
Eurostat estimates missing data for 13 pollutants (CO2, CH4, N2O, HFC, PFC, NF3_SF6, NOx, SOx, NH3, NMVOC, CO, PM10 and PM2.5) starting from year 2008 in order to compile EU aggregates. EU aggregates are derived bottom-up by summing up country values. For greenhouse gases (GHG) Eurostat estimates AEA for one additional year beyond the mandatory reporting (year n-1, being n the year of the AEA data collection) for EU Member States and the aggregated EU. For the detailed methodology see the Note on Eurostat's procedure for early estimates of greenhouse gases (GHG) in Annex. |
|||
| 18.5.1. Imputation - rate | |||
Not applicable. |
|||
| 18.6. Adjustment | |||
Not applicable. |
|||
| 18.6.1. Seasonal adjustment | |||
Not applicable. |
|||
|
|||
Not applicable. |
|||
|
|||
|
|||
| Methodology (including SEEA CF 2012) Eurostat's procedure for early estimates of greenhouse gases (GHG) AEA - Assessment of early estimates for reference year 2020 |
|||
|
|||