Construction Download chapter 4 of Key figures on European business in PDF format

Previous theme Next Section

Structure

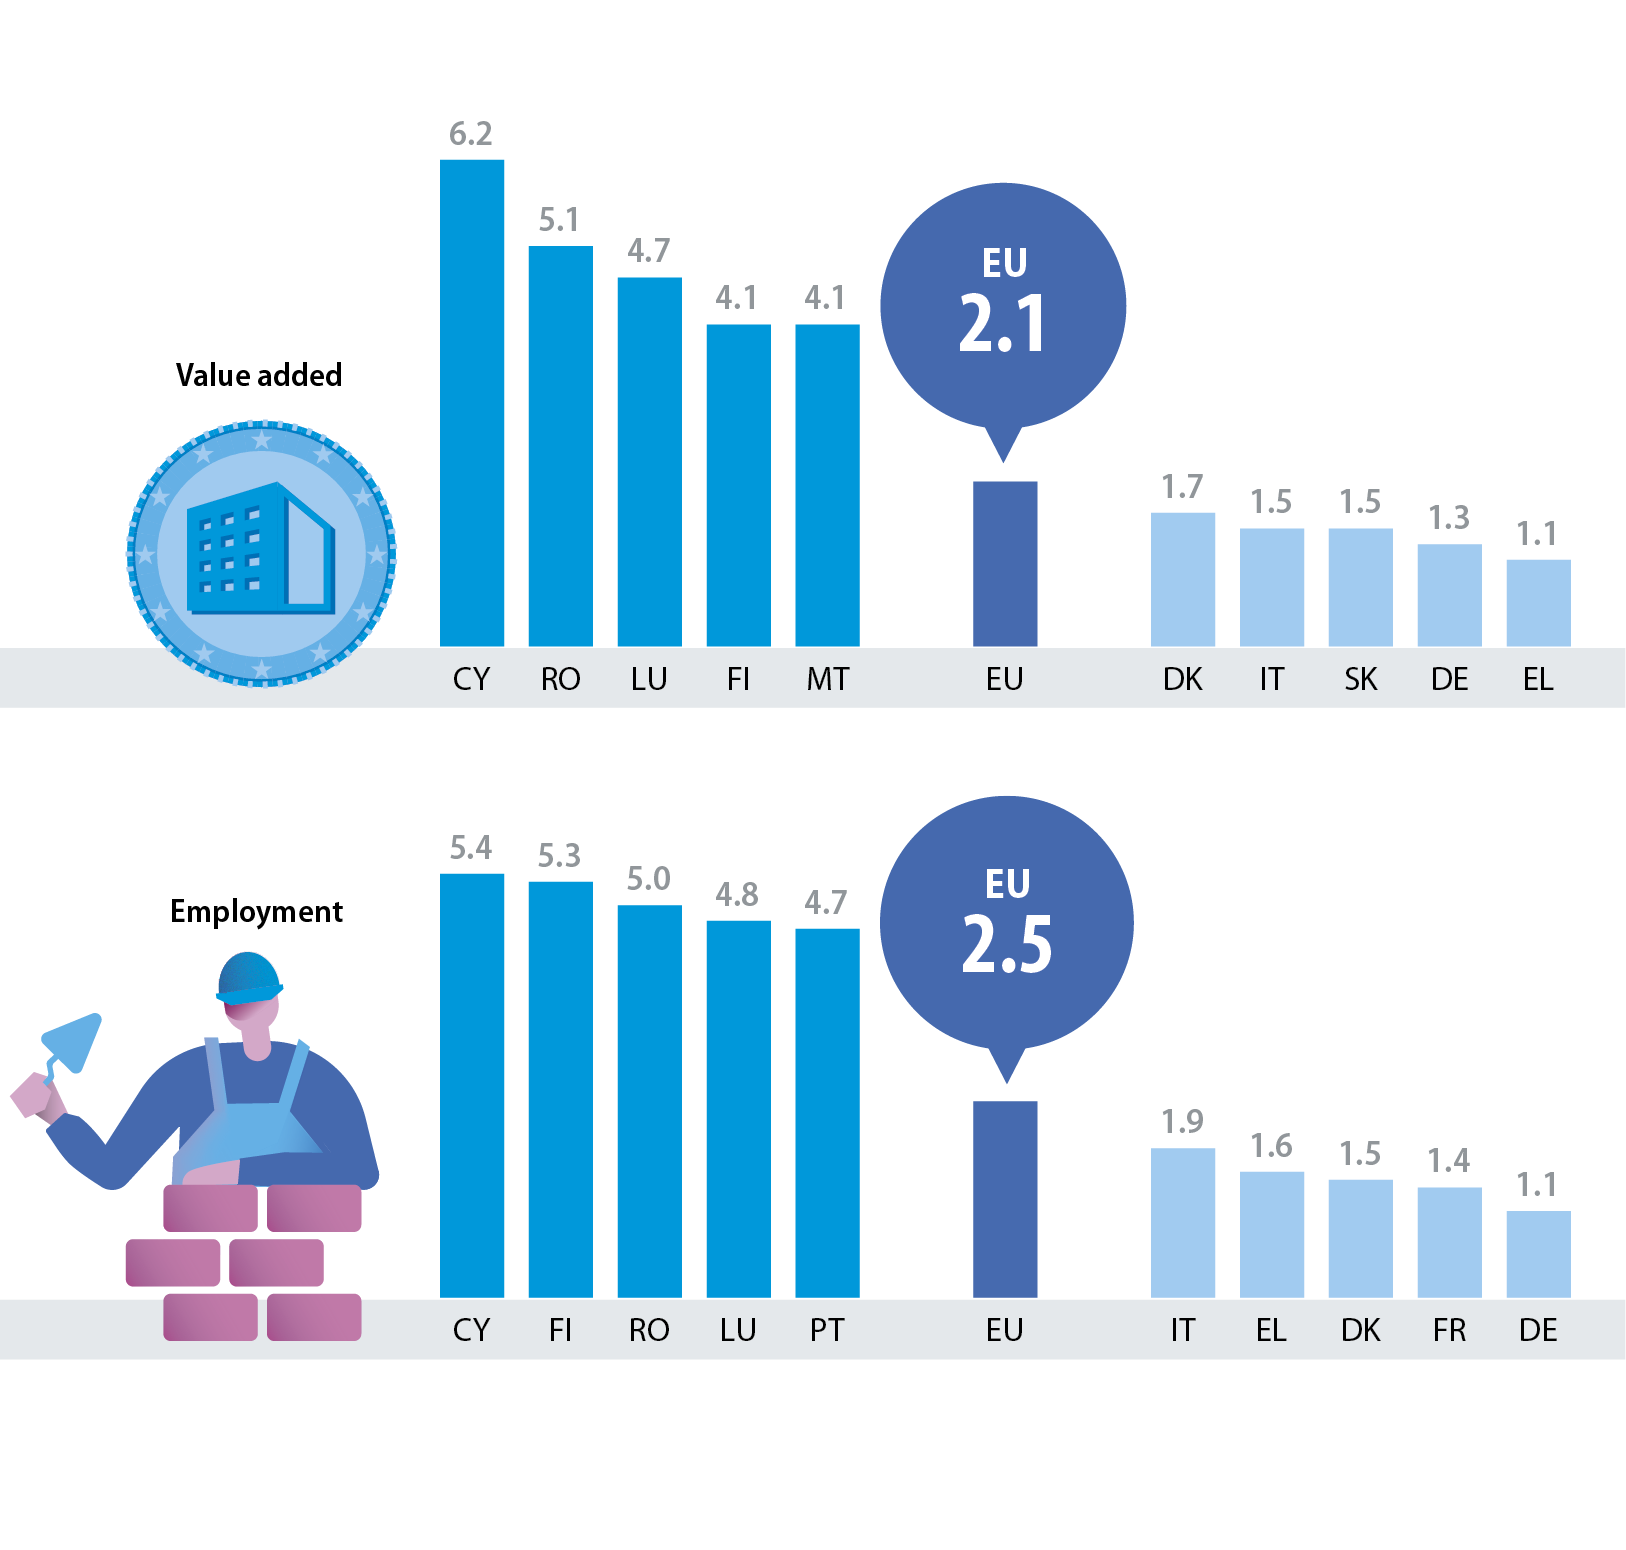
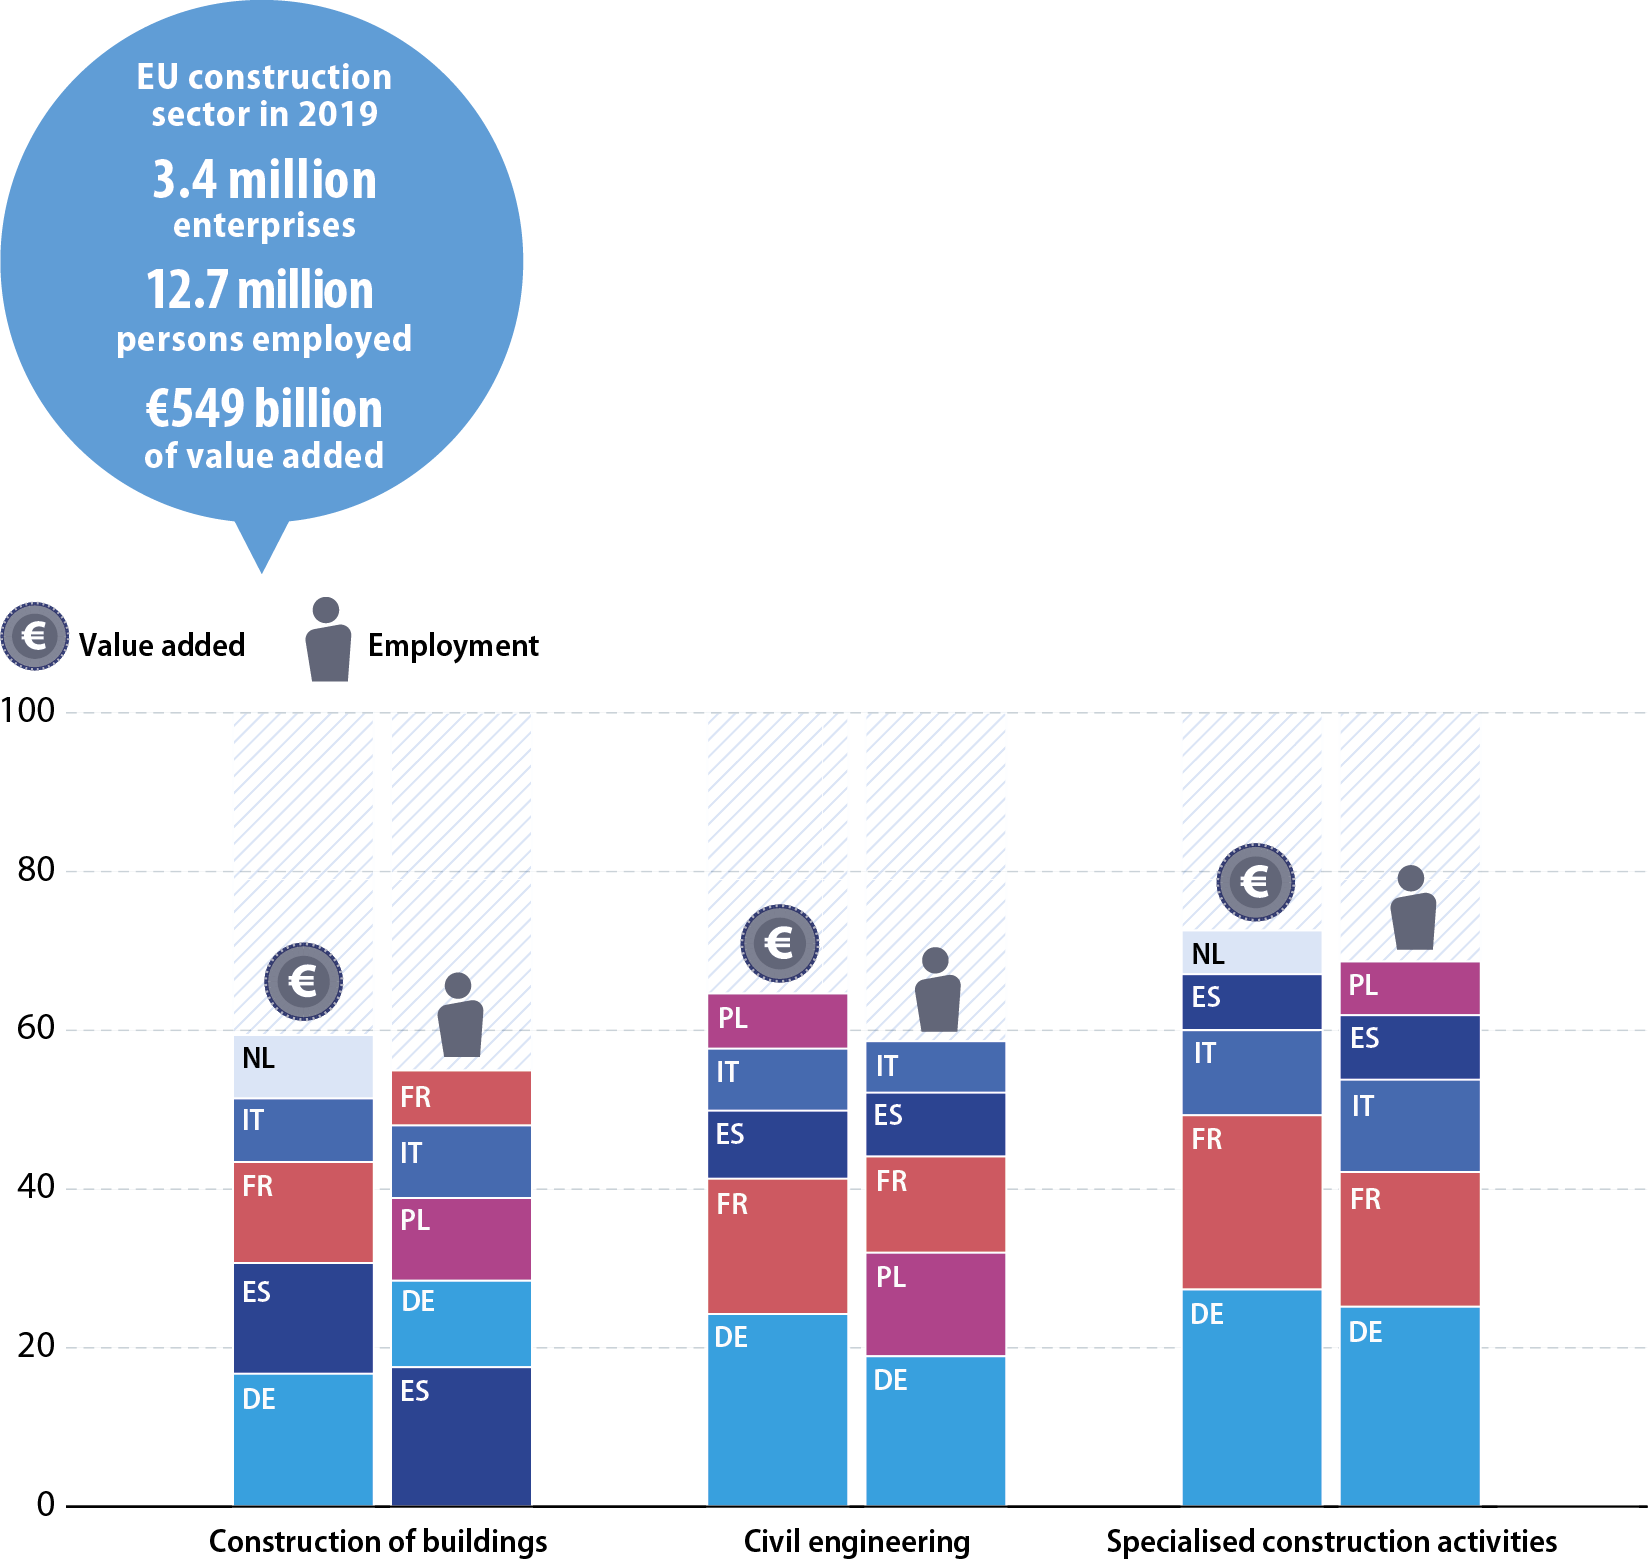
Construction activities include the construction of buildings, civil engineering and specialised construction activities. Across the EU, by far the largest of these three divisions was specialised construction activities: in 2019, these activities accounted for nearly three fifths (59.0 %) of construction value added and for an even higher share of construction employment (63.3 %).

Concentration of construction activity – top five EU Member States (%, share of EU employment and value added for each activity, 2019)
IN 2019 EU construction sector accounted for 3.4 million enterprises; 12.7 million persons employed; €549 billion of value added. Share of EU Member States within EU value added or employment, in percent. National data for the EU Member States. Annual data for 2019. Construction NACE divisions. Double stacked bar chart.

Source: Eurostat (online data code: sbs_na_con_r2)

In all three of the construction divisions, the four largest EU Member States in value added terms were Germany, France, Italy and Spain; the Netherlands was fifth largest in the construction of buildings and in specialised construction activities while Poland was fifth largest in civil engineering. In 2019, Germany had the largest value added for the three construction divisions; France had the second largest value added for civil engineering and specialised construction activities, whereas Spain had the second largest value added for the construction of buildings.

In terms of employment, the five largest EU Member States in all three construction divisions were Germany, Spain, France, Poland and Italy. While Germany was the largest employer for civil engineering and for specialised construction activities, Spain had the largest workforce for the construction of buildings.

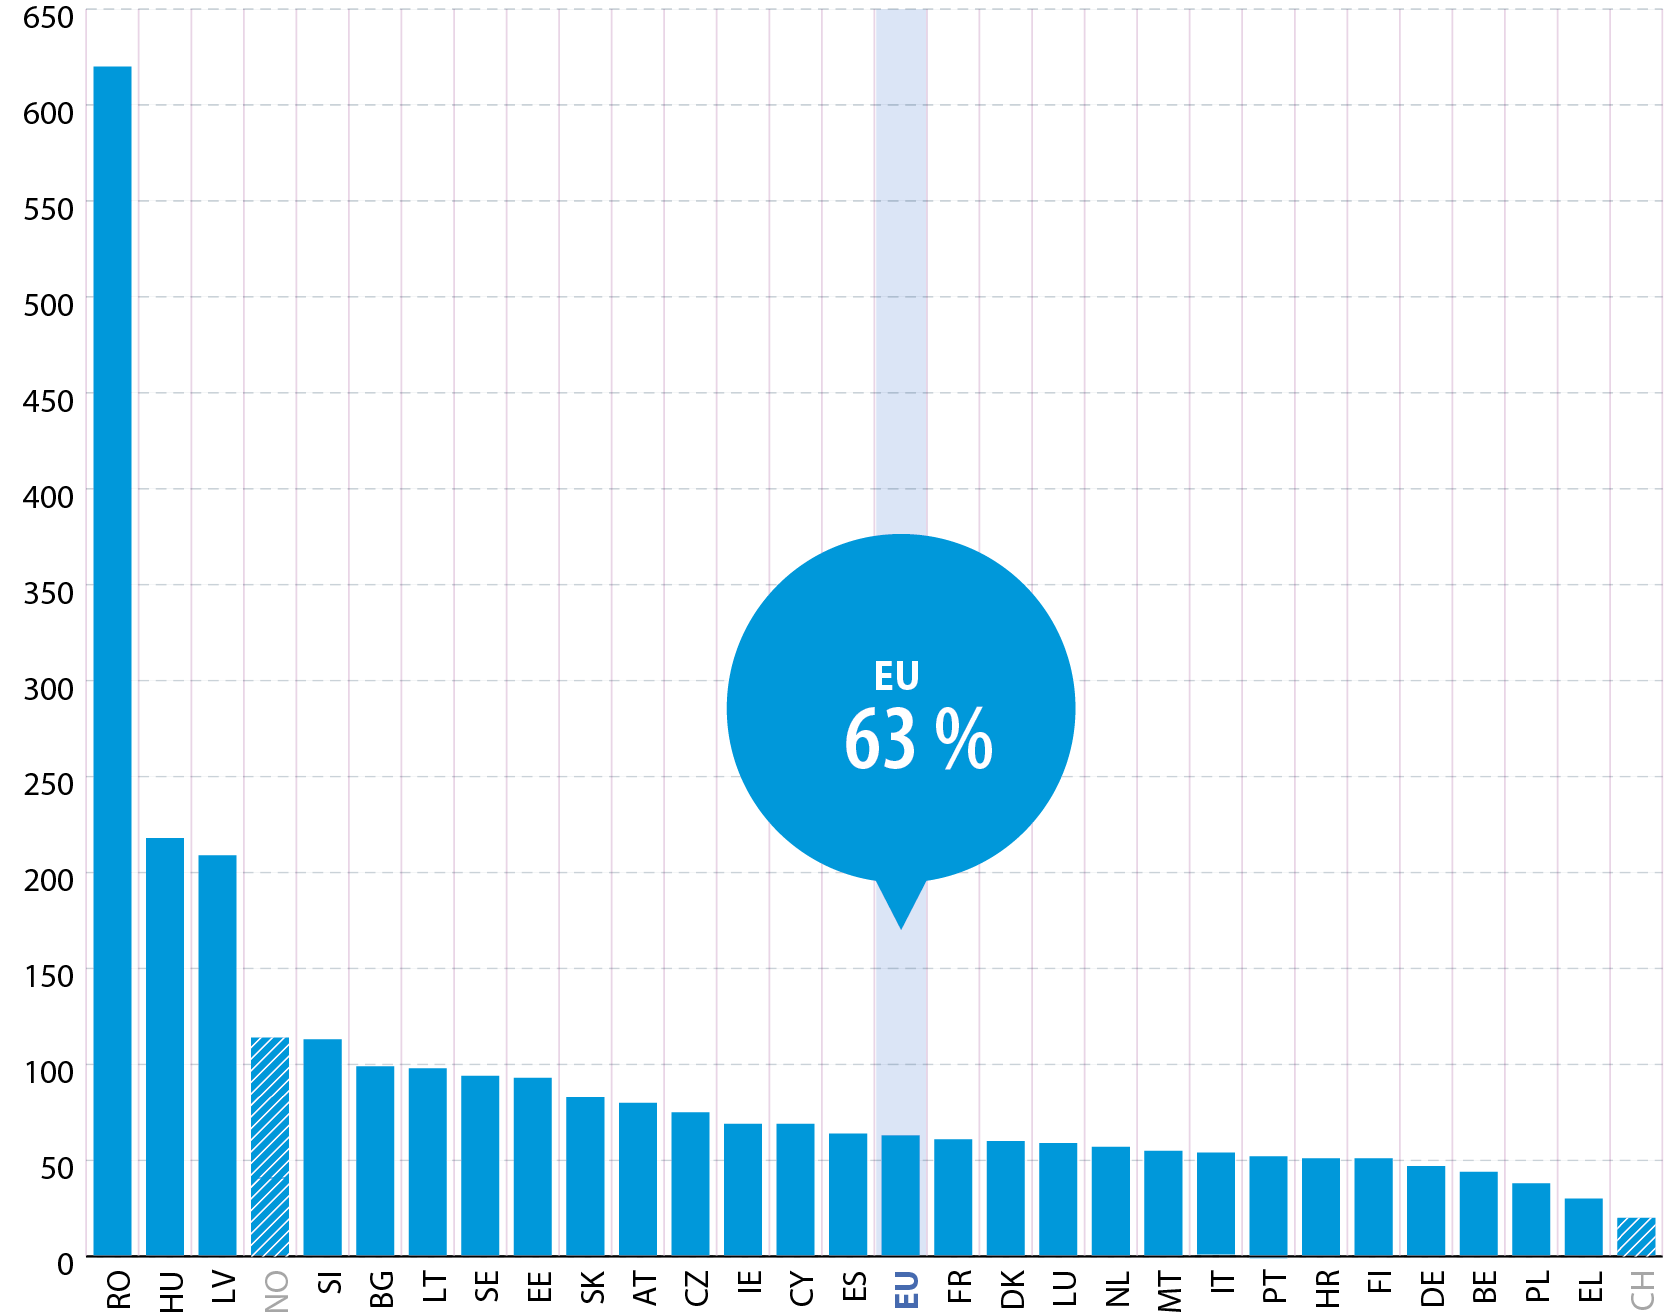
Value added specialisation – top five EU Member States (%, share of construction value added, 2019)

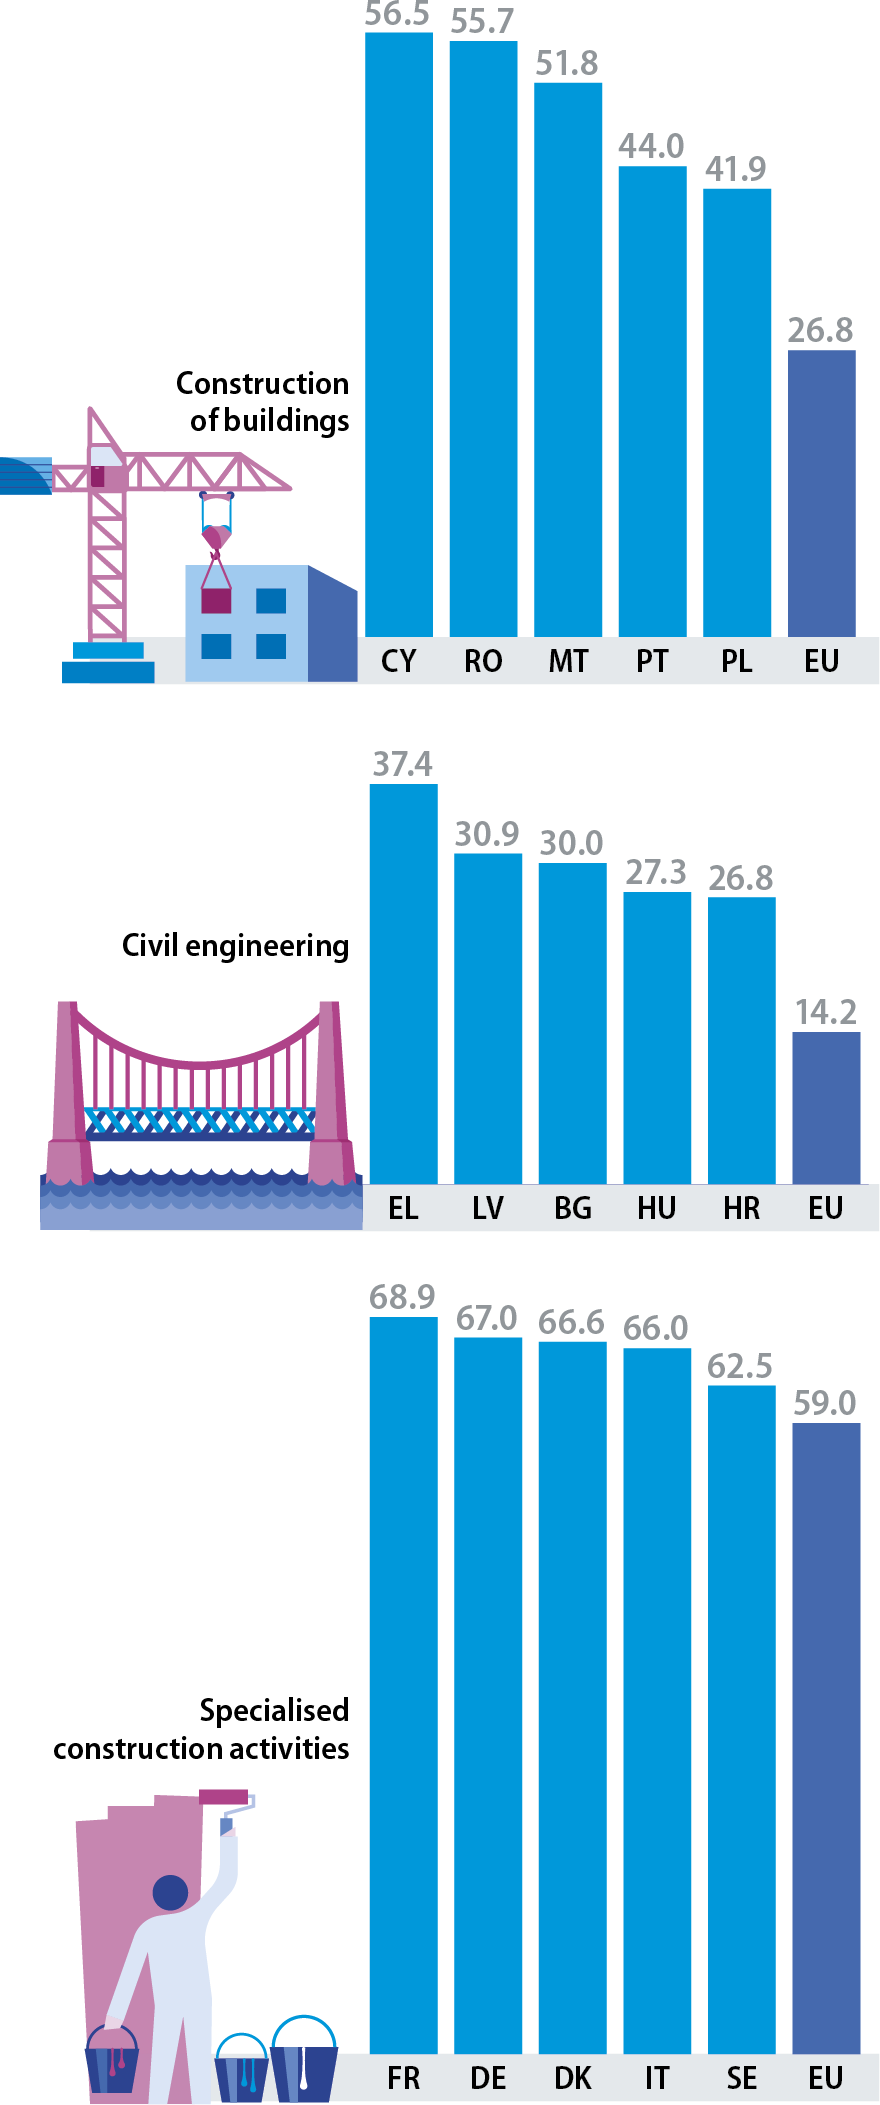
A lot of construction is done by enterprises serving a relatively small geographical market, with little international trade compared with many industrial activities. There are nevertheless quite large specialisations in the three construction divisions.

In 2019, over half of construction value added in Cyprus, Romania and Malta resulted from the construction of buildings, approximately double the average for the EU (26.8 %). In Greece, civil engineering contributed more than a third of the construction total and in Latvia and Bulgaria the share was around 30.0 %, also more than double the average for the EU (14.2 %). It was commonplace for specialised construction activities to account for more than half of construction value added: the EU average was 59.0 % and this share was around two thirds in Italy, Denmark, Germany and France.

Note: data are shown for the three NACE Rev. 2 construction divisions.

Source: Eurostat (online data code: sbs_na_con_r2)

Value added shares of activities within the cosntruction total, in percent. Data for the EU and national data for the EU Member States. Annual data for 2019. Constuction NACE divisions. Three column charts.
Average personnel costs within construction divisions (€ thousand per employee, 2019)
Average personnel costs, in thousand euro per employee. Data for the EU and national data for the EU Member States and EFTA countries. Annual data for 2019. Construction NACE divisions. Three column charts.

Note: IS, 2018.

Source: Eurostat (online data code: sbs_na_con_r2)

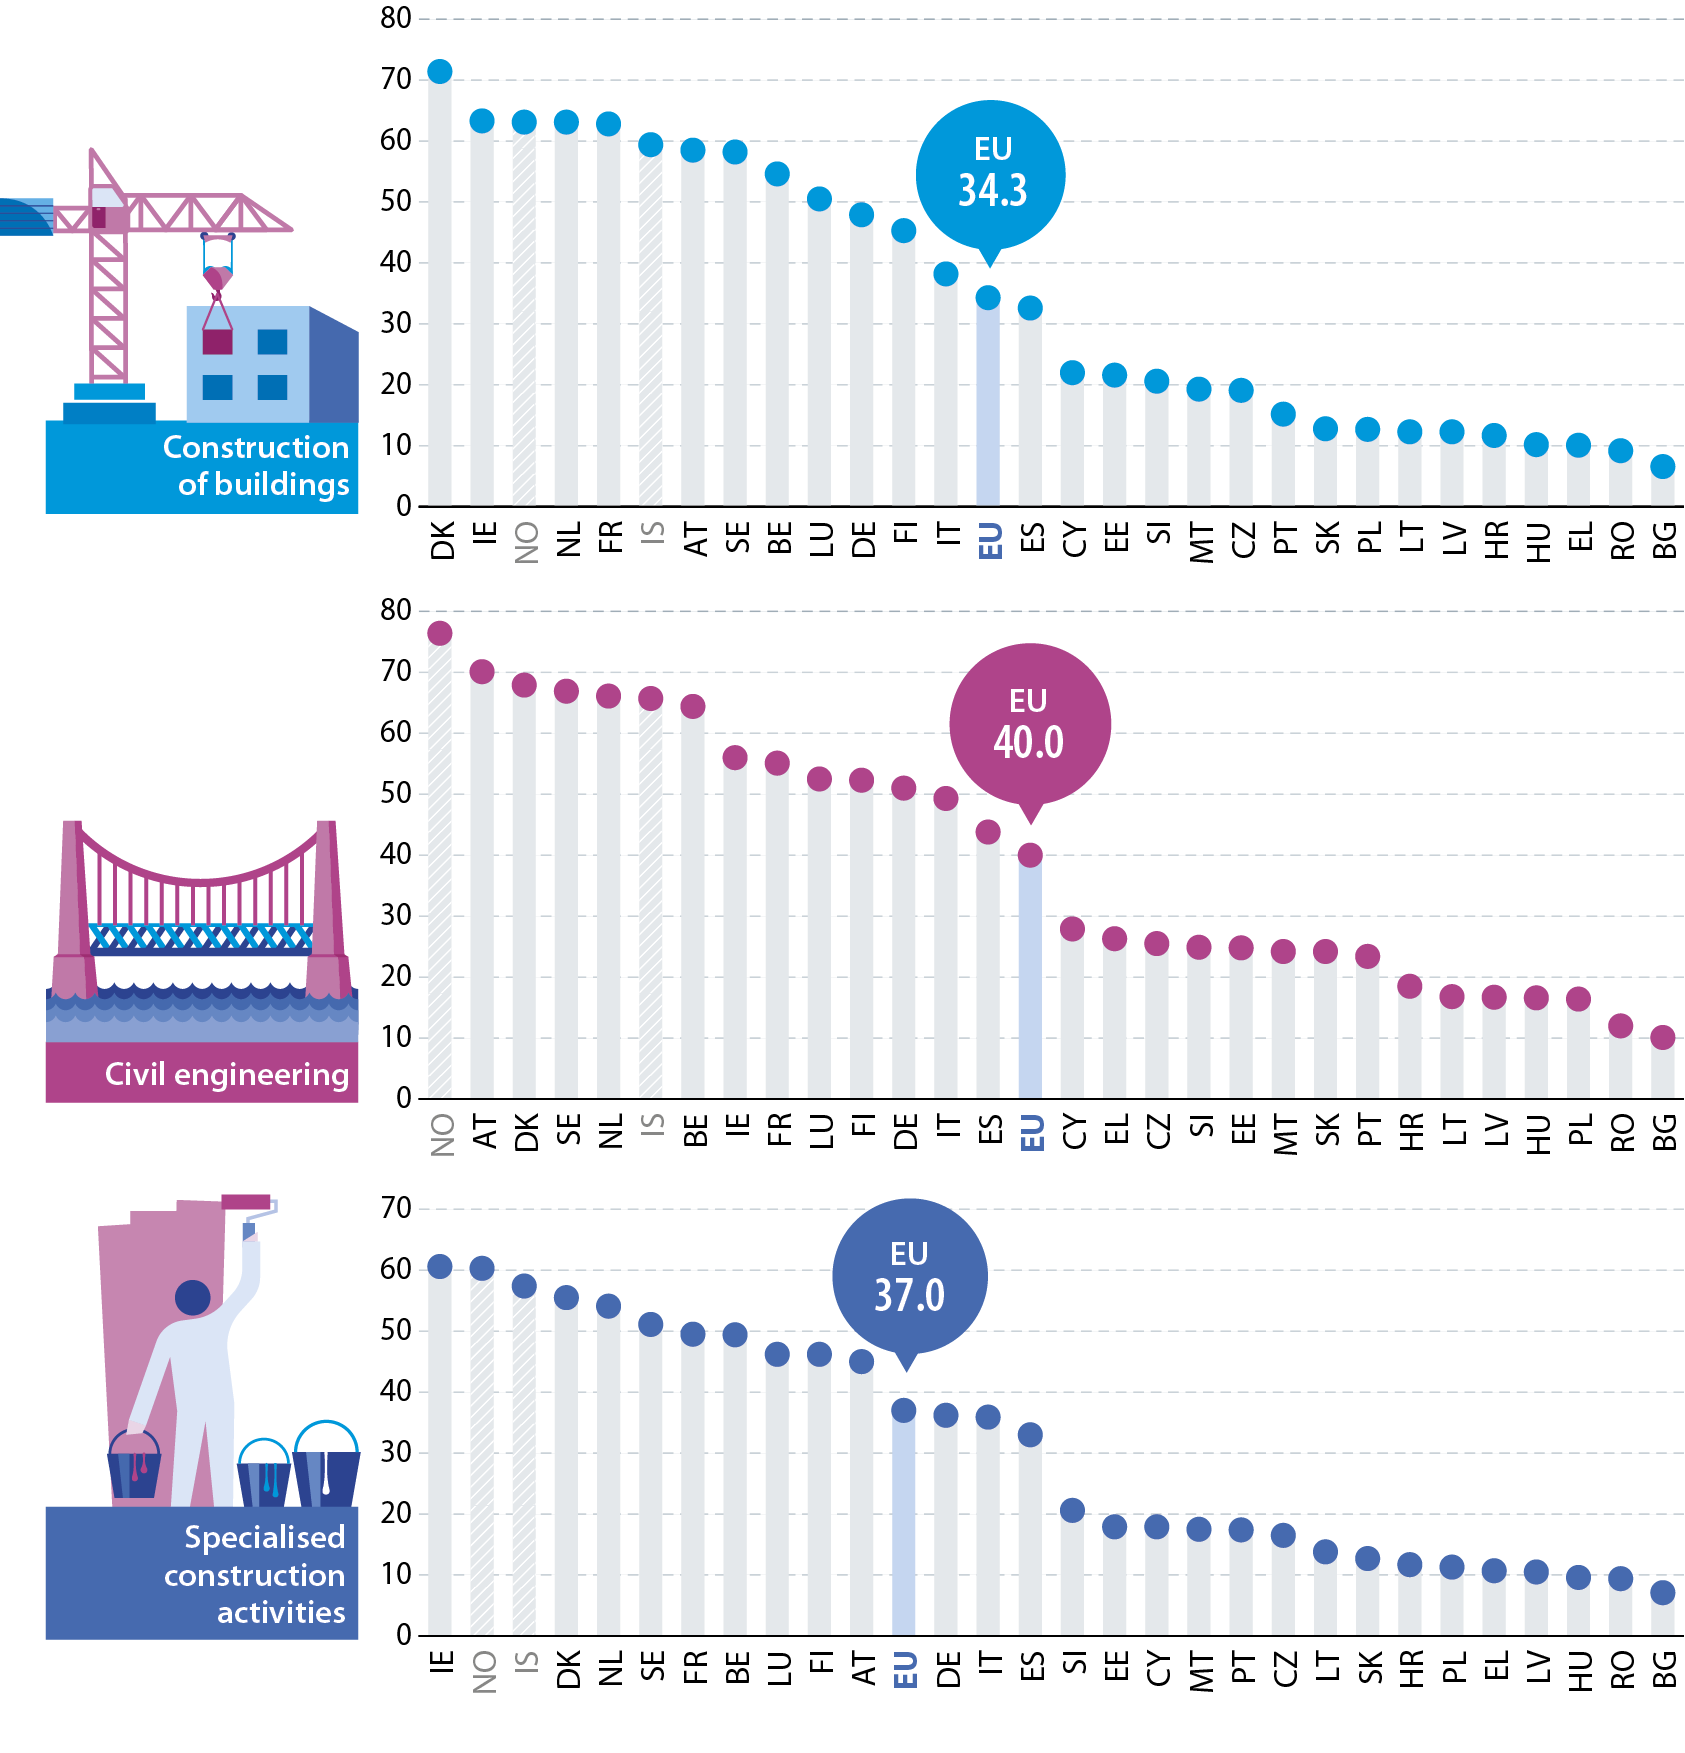
In 2019, average personnel costs across the three divisions of the EU’s construction sector ranged from a high of €40 000 per employee for civil engineering down to €34 300 per employee for the construction of buildings.

In the EU, average personnel costs were lower for the construction of buildings than for the other two construction divisions. However, this situation was only observed in seven EU Member States. In a majority of Member States, the lowest average personnel costs were recorded for specialised construction activities (which dominate the construction sector in the largest Member States). In Ireland, the lowest average personnel costs were for civil engineering, while in Croatia and Slovenia the joint lowest average personnel costs were recorded for specialised construction activities and the construction of buildings.

Previous Section Next Section

Developments

Construction production index (2000 = 100, EU, 2000–2021)
Production index. Data for the EU. Annual data for 2000 to 2021. Construction total, building and civil engineering. Line graph. In 2021, the construction production index was 2% higher than it had been in 2000.

Source: Eurostat (online data code: sts_copr_a)

The construction production index reflects real terms (deflated) output developments for the construction activity. Construction output in the EU was relatively stable between 2000 and 2004 and then expanded up until 2007. In 2008, the impact of the global financial and economic crisis was felt; there was a decline in output recorded most years from 2008 to 2013. Despite some recovery thereafter, construction output in 2019 was still 8.3 % lower than it had been in 2007. In 2020, output fell 5.0 %, reflecting the impact of the COVID-19 pandemic. This fall was comparable in percentage terms with the falls recorded in 2009, 2010 and 2012. In 2021, output rebounded, increasing 5.7 % to a level slightly above that observed before the pandemic (in 2019).

The developments for building and civil engineering were quite similar, peaking in 2007, reaching a low point in 2013 and recovering only partially before turning down again in 2020 and back up in 2021. In 2021, building and civil engineering output were 7.7 % and 6.8 % below their respective 2007 peaks.

Overall change in the construction production index (%, 2000–2021)
Overall change in the production index, in percent. Data for the EU and national data for the EU Member States and EFTA countries. Annual data for 2000 to 2021. Construction total. Column chart.

Source: Eurostat (online data code: sts_copr_a)

Although the EU’s construction output was almost unchanged between 2000 and 2021 (down overall 2 %), developments varied greatly between the EU Member States. Greece’s construction output in 2021 was 85 % below its 2000 level, while there were also considerable contractions recorded in Portugal (down 66 %), Spain (down 43 %) and Ireland (down 42 %). At the other end of the scale, construction output in Sweden, Latvia, Bulgaria, Romania and Lithuania more than doubled between 2000 and 2021, while in Estonia it more than tripled and in Malta more than quadrupled (up 330 %).

Overall change in construction costs for new residential buildings (%, 2000–2021)
Overall change in the construction costs index, in percent. Data for the EU and national data for the EU Member States and EFTA countries. Annual data for 2000 to 2021. New residential buildings. Column chart.

Note: the construction costs index for new residential buildings excludes residencies for communities. BG: 2003-2021. BE, DE, IE, FR, HR, LU, MT, PL, SK and CH: 2000-2020.

Source: Eurostat (online data code: sts_copi_a)

The costs index is available for the construction of new residential buildings (excluding residences for communities). Between 2000 and 2021, construction costs for this type of building work increased 63 % within the EU. Cost increases were particularly large in Romania, where they were more than seven times as high in 2021 as they had been in 2000 (up 620 %); costs more than trebled in Hungary (up 218 %) and Latvia (up 209 %). The lowest increases for construction costs of new residential buildings were observed in Greece (up 30 %) and Poland (up 38 % between 2000 and 2020).

Previous Section Next Section

Focus on building construction

Construction of buildings – top five and bottom five EU Member States (%, share of value added and the number of persons employed in the non-financial business economy, 2019)
Value added and employment shares of the construction of buildings within the non-financial business economy, in percent. Data for the EU and national data for the EU Member States. Annual data for 2019. Construction of buildings. Two column charts.

Note: the construction of buildings covers NACE Rev. 2 Division 41.

Source: Eurostat (online data code: sbs_na_sca_r2)

The construction of buildings contributed with 2.1 % of value added in the EU’s non-financial business economy in 2019 and employed 2.5 % of the workforce. Compared with the EU average, this activity accounted for more than double the non-financial business economy share in value added terms in Cyprus, Romania and Luxembourg and for double or more the share in employment terms in Cyprus, Finland and Romania. These relatively high shares reflect a number of factors driving demand (such as overall population growth and tourism-related construction activity), as well as characteristics of the organisation of the construction sector between builders and specialists.

Building permit index (2000 = 100, EU, 2000–2021)
Building permit index. Data for the EU. Annual data for 2000 to 2021. One-dwelling buildings and two- and more dwelling buildings. Line graph. In 2021, the building permit index in the EU was 57% higher than it had been in 2000 for one-dwelling buildings and 53% higher for two- and more dwelling buildings.

Note: a building permit is an authorisation to start work on a building project; the index is based on the number of dwellings for which a permit has been granted.

Source: Eurostat (online data code: sts_copr_a)

The index of building permits reflects the number of permits granted and therefore provides a measure of expected demand for building activity in the near future. The index is available for two types of buildings: one-dwelling residential buildings and residential buildings with two or more dwellings (but not residential buildings for communities). Across the EU, permits for both types of dwellings fell strongly from peaks in 2006 to relative lows in 2013 (for residential buildings with two or more dwellings) and 2014 (for one-dwelling residential buildings). Despite some recovery thereafter – interrupted in 2020 by the start of the COVID-19 pandemic – the index for one-dwelling residential buildings in 2021 was around half its 2006 peak level while the index for residential buildings with two or more dwellings was around one third its 2006 peak level.

Previous Section Next theme

Latest developments

Monthly data for 2020 and to a lesser extent 2021 show the impact of the COVID-19 pandemic on construction. The most recent data for 2022 may be impacted by a wider range of issues, for example aftereffects of the COVID-19 crisis on supply chains and early impacts from the Russian military aggression against Ukraine and the related sanctions.

Construction production indices (%, change compared with the previous month, EU, January 2019–April 2022)
Monthly change in the production index, in percent. Data for the EU. Montly data for January 2019 to April 2022. Construction total, building and civil engineering. Line graph. In March and April 2020, the construction production index for the EU fell, strongly, reflecting the impact of the COVID-19 crisis. It recovered strongly in May and to a lesser extent in Jene. Its monthly development thereafter was similar to that before the pandemic.

Source: Eurostat (online data code: sts_copr_m)

The impact of the first wave of the COVID-19 pandemic and its accompanying restrictions can be seen by studying the change in the level of output in early 2020: construction output across the EU in April 2020 was 26 % lower than in February 2020. Output growth of 32 % between April and August 2020 brought construction output in August 2020 to a level that was 2 % less than it had been in February. Since then, output has been quite stable, with somewhat stronger growth recorded in March 2021 (up 3.7 %) and January 2022 (up 3.2 %). By April 2022, construction output was 1.8 % higher than before the pandemic; for building construction, the level was 3.1 % higher; for civil engineering, it was 3.3 % lower.

Previous Section Next theme
Go to the top of the page