Distributive trades Download chapter 5 of Key figures on European business in PDF format

Previous theme Next section

Structure

Distributive trades cover motor, wholesale and retail trades. Wholesale trade was the largest of these three divisions in value added terms, with 49.7 % of the distributive trades total in 2019 compared with 38.1 % for retail trade. In employment terms, the situation was reversed, with retail trade contributing 55.3 % compared with 32.6 % for wholesale trade.
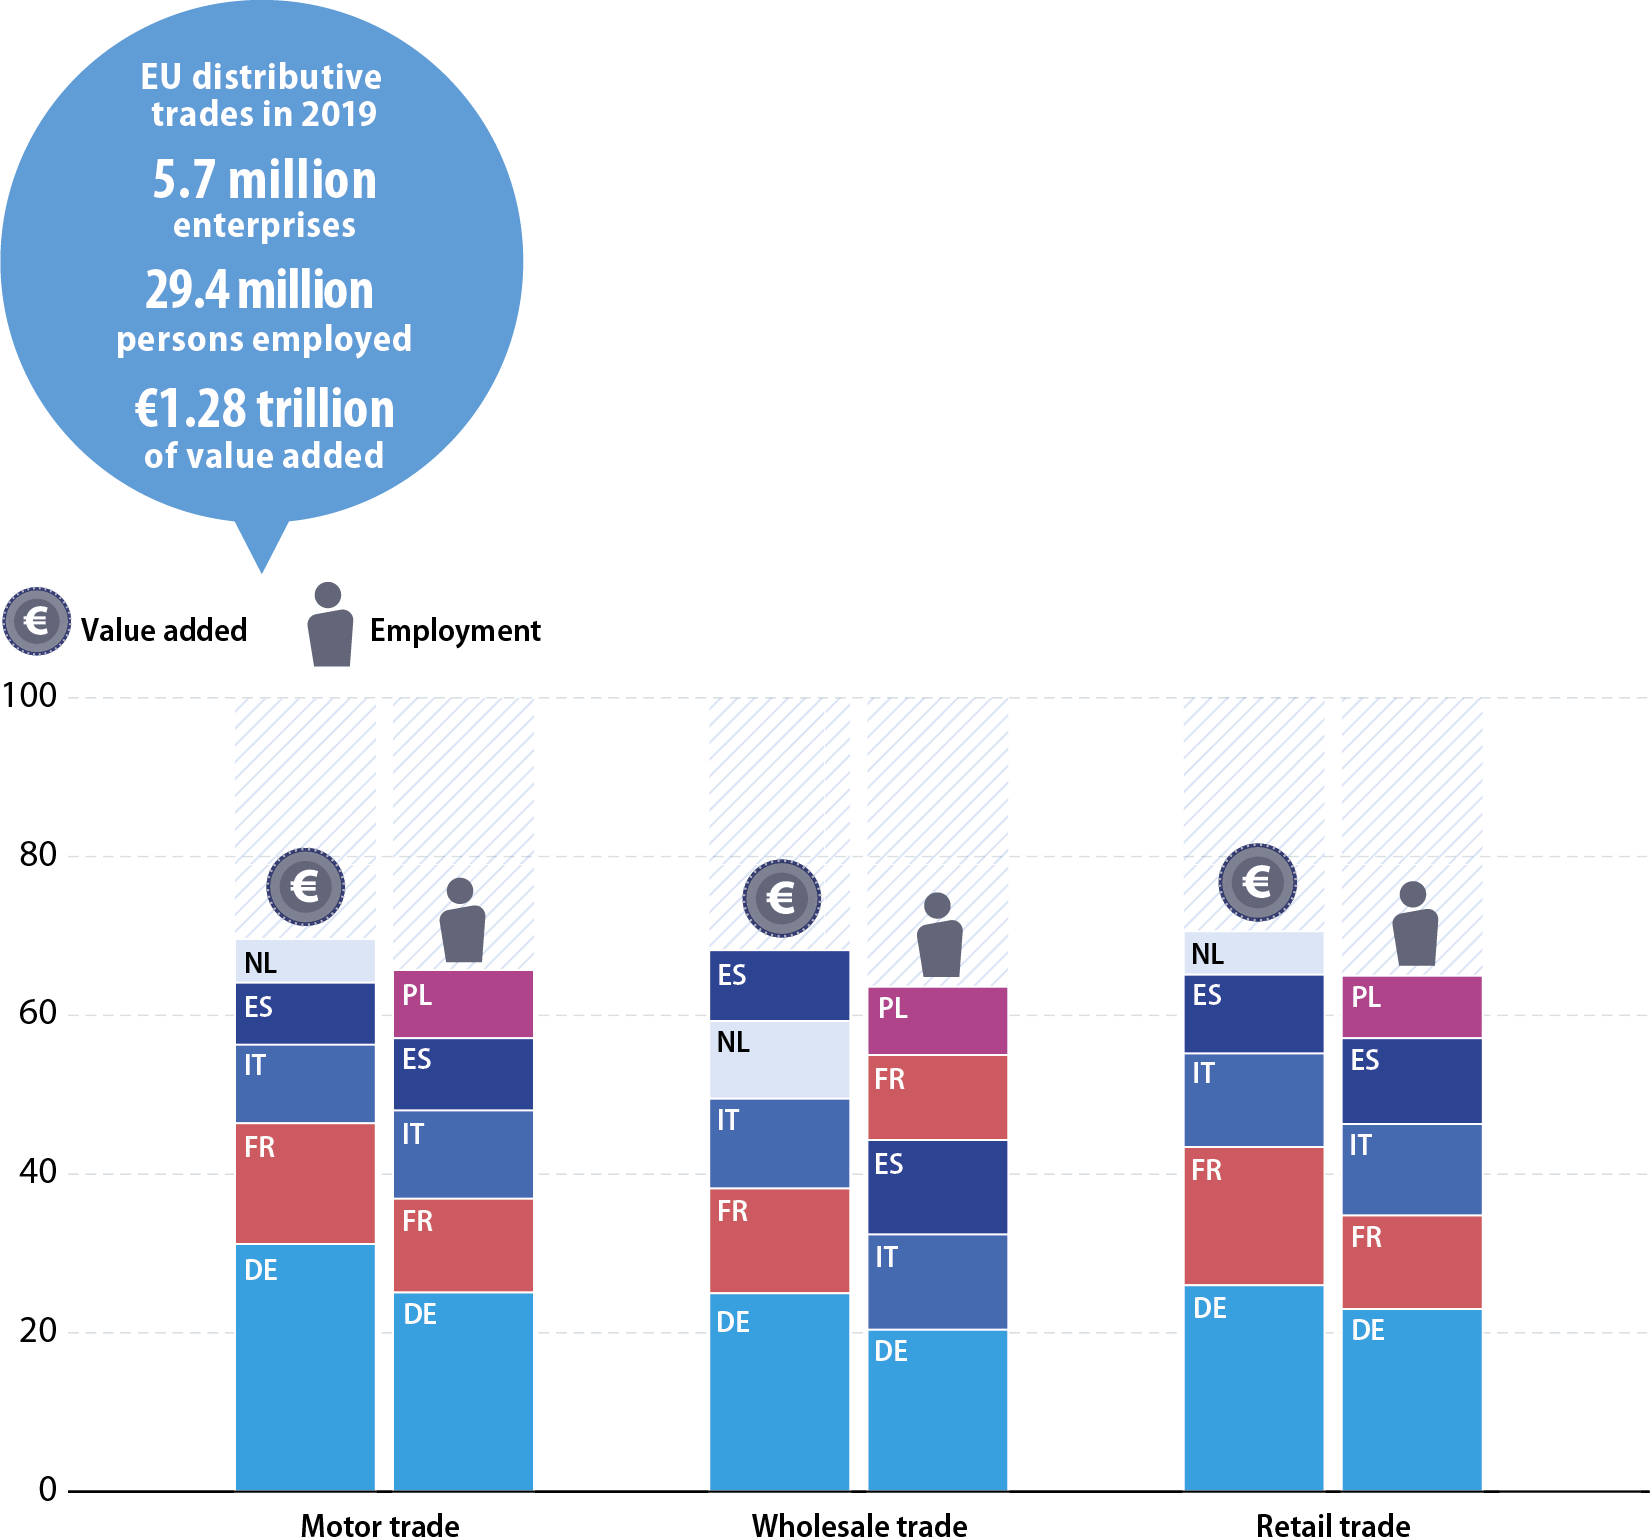
Concentration of distributive trades activity – top five EU Member States (%, share of EU employment and value added for each activity, 2019)
in 2019, distributive trades accounted for 5.7 million enterprises; 29.4 million persons employed; €1.28 trillion of value added. Share of EU Member States within EU value added or emplyment, in percent. National data for the EU Member States. Annual data for 2019. Distributive trades NACE divisions. Double stacked bar chart.

Source: Eurostat (online data code: sbs_na_dt_r2)

Germany had the largest share of EU value added in all three distributive trades divisions in 2019, followed by France and Italy. For motor trade and for retail trade, Spain had the fourth largest share followed by the Netherlands, while this order was reversed for wholesale trade. In employment terms, the main difference was that Poland was the fifth largest EU Member State (whereas the Netherlands was not in the top five). In addition, the ranking was somewhat different for wholesale trade, as France’s level of employment in this activity was smaller than the employment levels of Italy and of Spain.

Value added specialisation – top five EU Member States (%, share of distributive trades value added, 2019)

Given the essential, local nature of many distributive trade activities, there tends to be less geographical specialisation than observed for many industrial or other service activities. For example, 15.6 % of distributive trades value added in Finland was recorded in motor trades in 2019, more than in any other EU Member State, but this was not much higher than the EU average (12.2 %).

Luxembourg (64.7 %) and the Netherlands (63.9 %) were the top two EU Member States in terms of the contribution made by wholesale trade to distributive trades’ value added in 2019, underlying their specialisation in distribution, transport and logistics; they were closely followed by Ireland (63.4 %). Cyprus (47.3 %), Malta (47.2 %) and Croatia (47.1 %) – three Member States that host large numbers of tourists each year – recorded the highest contributions of retail trade to distributive trades’ value added.

Note: data are shown for the three NACE Rev. 2 distributive trades divisions.

Source: Eurostat (online data code: sbs_na_dt_r2)
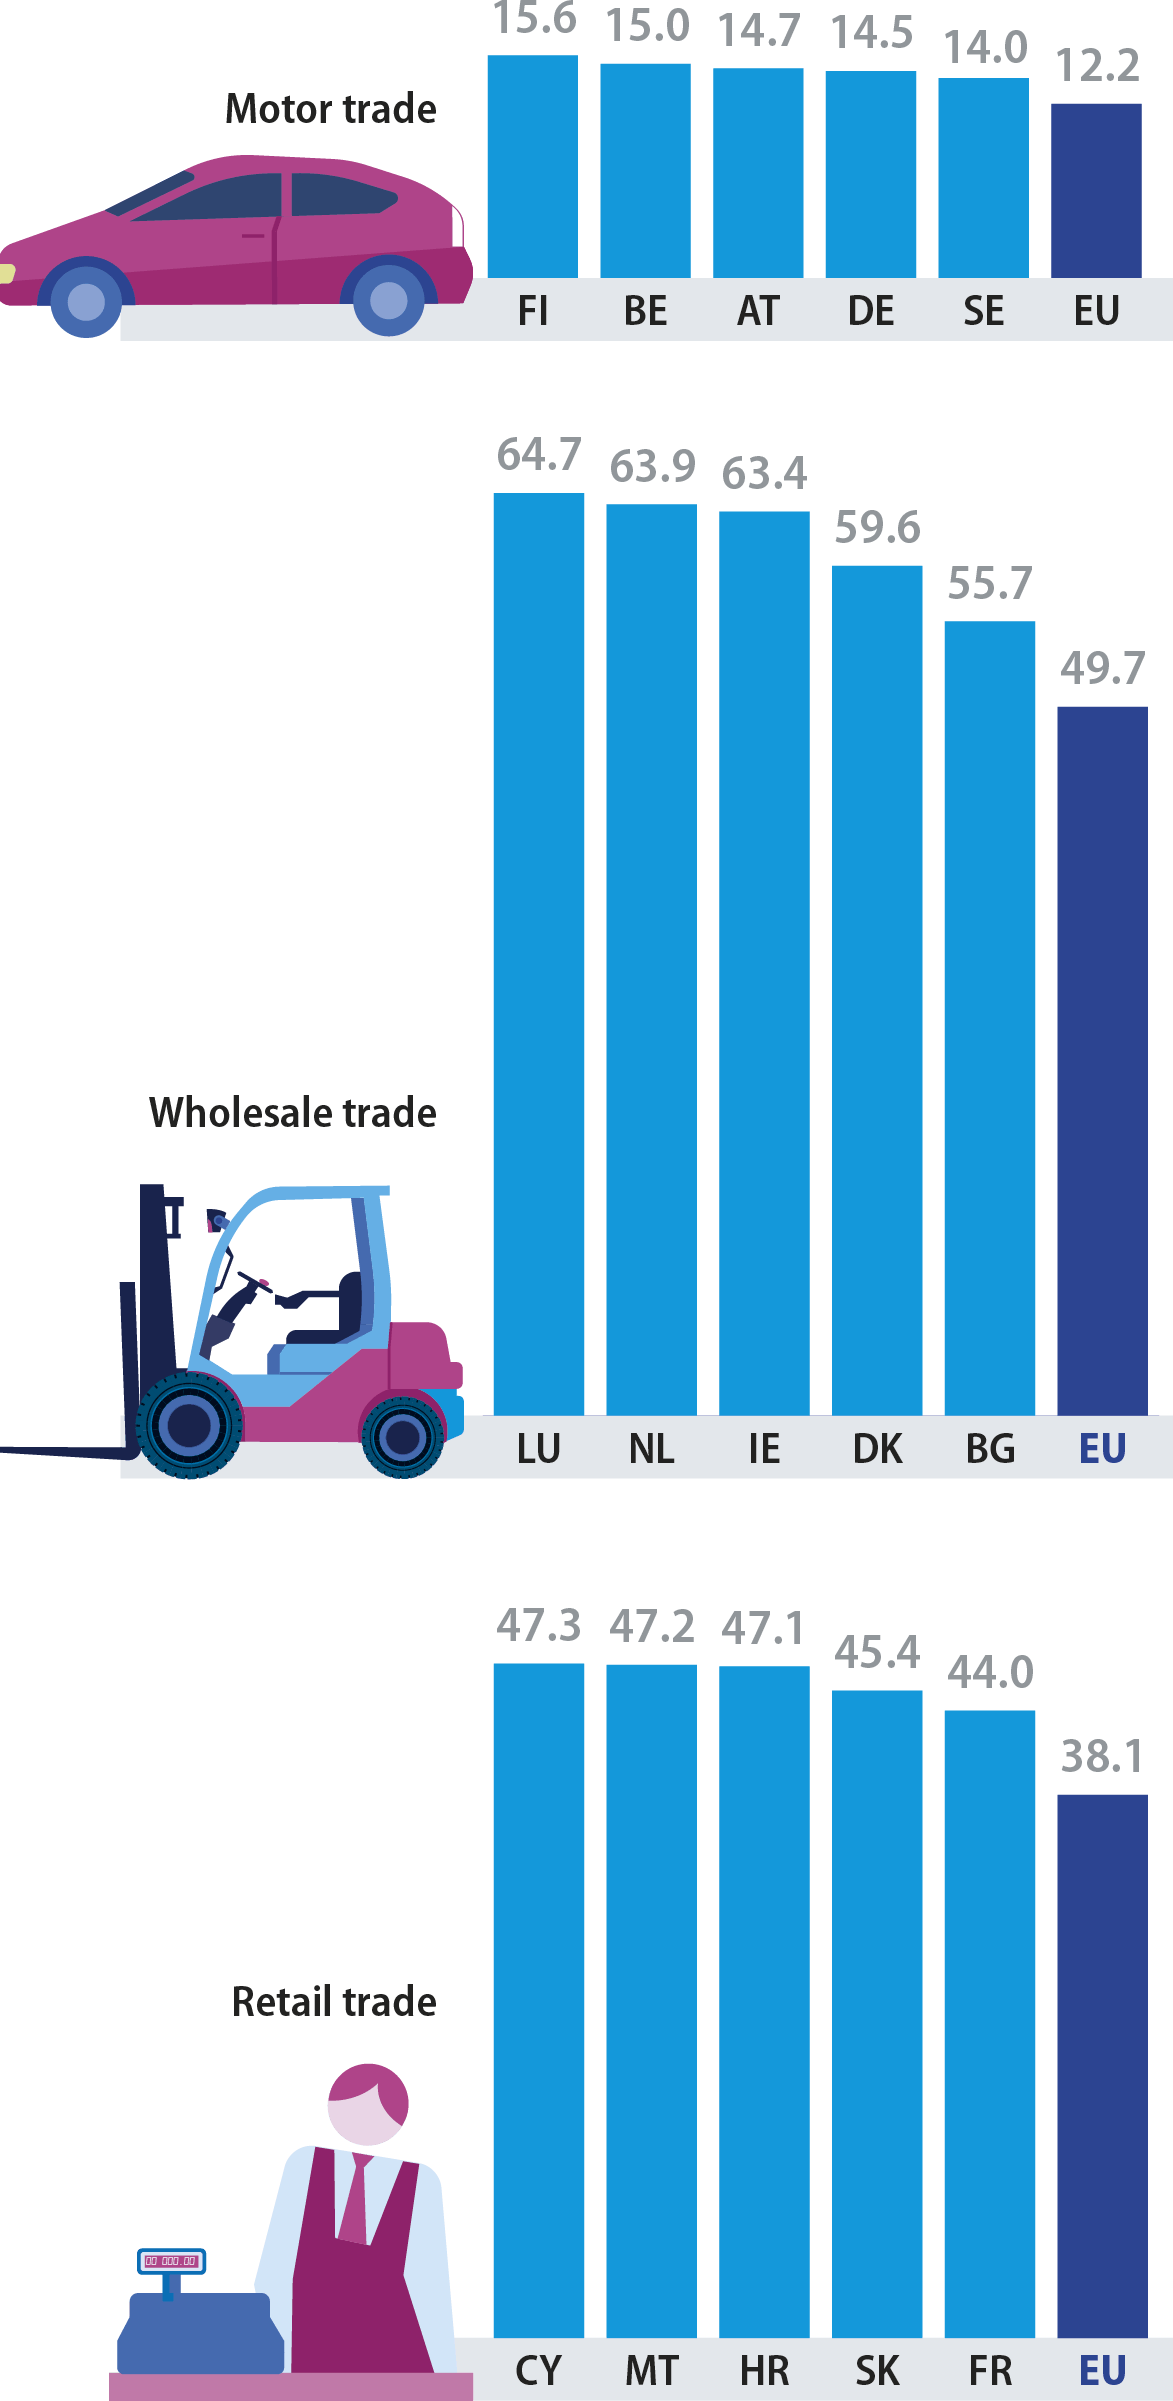
Value added shares of activities within the distributive trades total, in percent. Data for the EU and national data for the EU Member States. Annual data for 2019. Distributive trades NACE divisions. Threee column charts. In 2019, wholesale trade was the largest distributive trade division in the EU in value added terms, contibuting 49.7% of the distibutive trades total.
Average personnel costs within distributive trades divisions (€ thousand per employee, 2019)
Average personnel costs, in thousand euro per employee. Data for the EU and national data for the EU Member States and EFTA countries. Annual data for 2019. Distributive trades NACE divisions. Three column charts.

Note: IS, 2018.

Source: Eurostat (online data code: sbs_na_dt_r2)
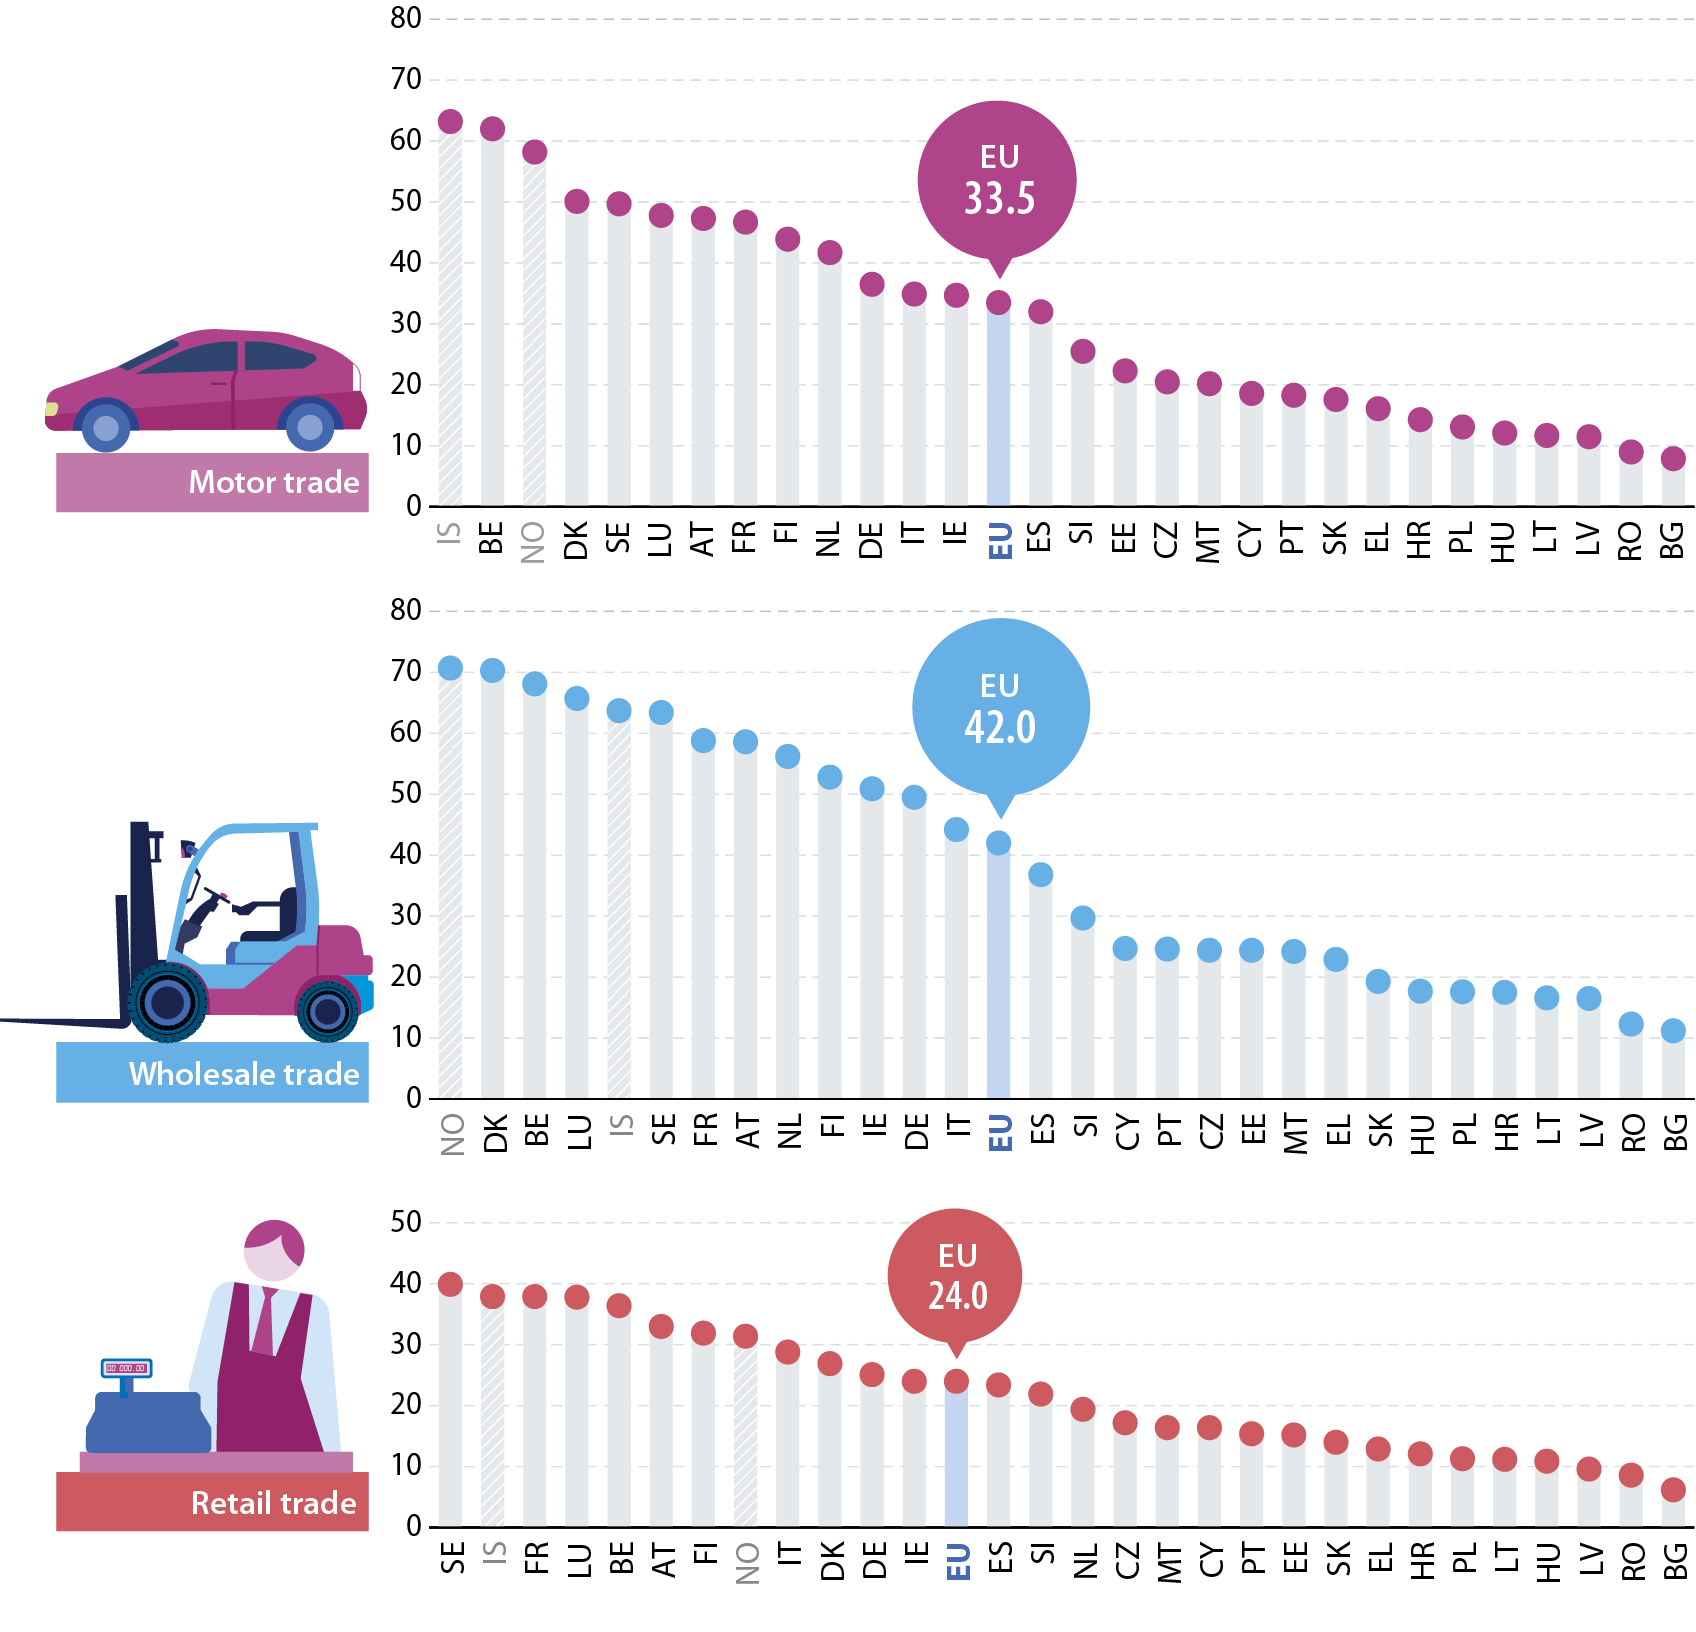
Typically, the lowest average personnel costs can often be observed in sectors with a high incidence of part-time and seasonal work, such as retail trade. Across the EU’s distributive trades’ sector, average personnel costs in 2019 ranged from a high of €42 000 per employee for wholesale trade down to a low of €24 000 per employee for retail trade.

In 2019, Denmark recorded the highest average personnel costs among EU Member States for wholesale trade (€70 300 per employee). Belgium had the highest average personnel costs for motor trade (€62 000 per employee), while Sweden had the highest average personnel costs for retail trade (€39 900 per employee). At the other end of the scale, the lowest average personnel costs for all three distributive trades divisions were recorded in Bulgaria, Romania and Latvia.
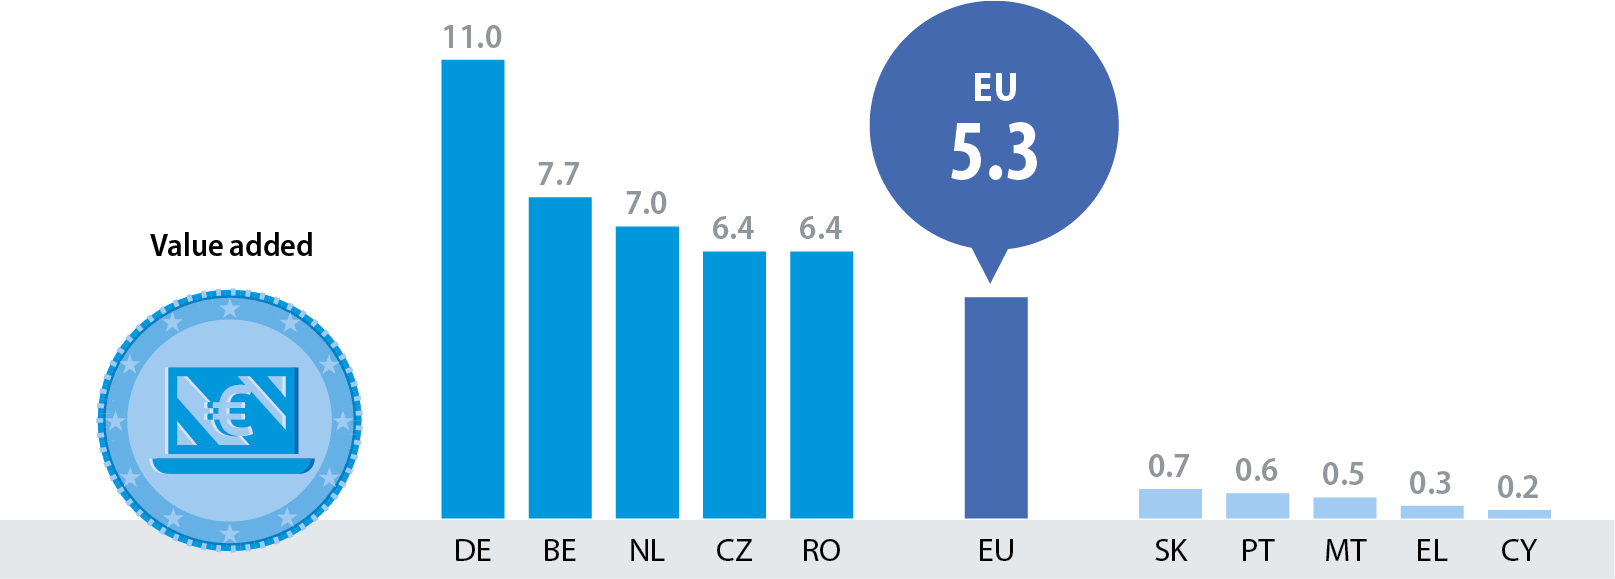
Retail sale via mail order houses or via internet – top five and bottom five EU Member States (%, share in retail trade, 2019)
Value added and employment shares of retail sale via mail order houses or via internet within retail trade, in percent. Data for the EU and national data for the EU Member States. Annual data for 2019. Retail sale via mail order houses or via internet. Two column charts. Value added and employment shares of retail sale via mail order houses or via internet within retail trade, in percent. Data for the EU and national data for the EU Member States. Annual data for 2019. Retail sale via mail order houses or via internet. Two column charts.

Note: retail trade covers NACE Rev. 2 Division 47 and retail sale via mail order houses or via internet covers NACE Rev. 2 Class 47.91. LU: not available.

Source: Eurostat (online data code: sbs_na_dt_r2)

Internet retailing has gained in significance over many years. In 2019, the subsector covering retail sale via mail order houses or via internet accounted for 5.3 % of retailing value added and 3.9 % of retailing employment within the EU. In value added terms, Germany, Belgium and the Netherlands were the most specialised EU Member States in these forms of remote trading, while Greece and Cyprus were the least specialised.

Previous section Next section

Developments

Distributive trades turnover index (2000 = 100, EU, 2000–2021))
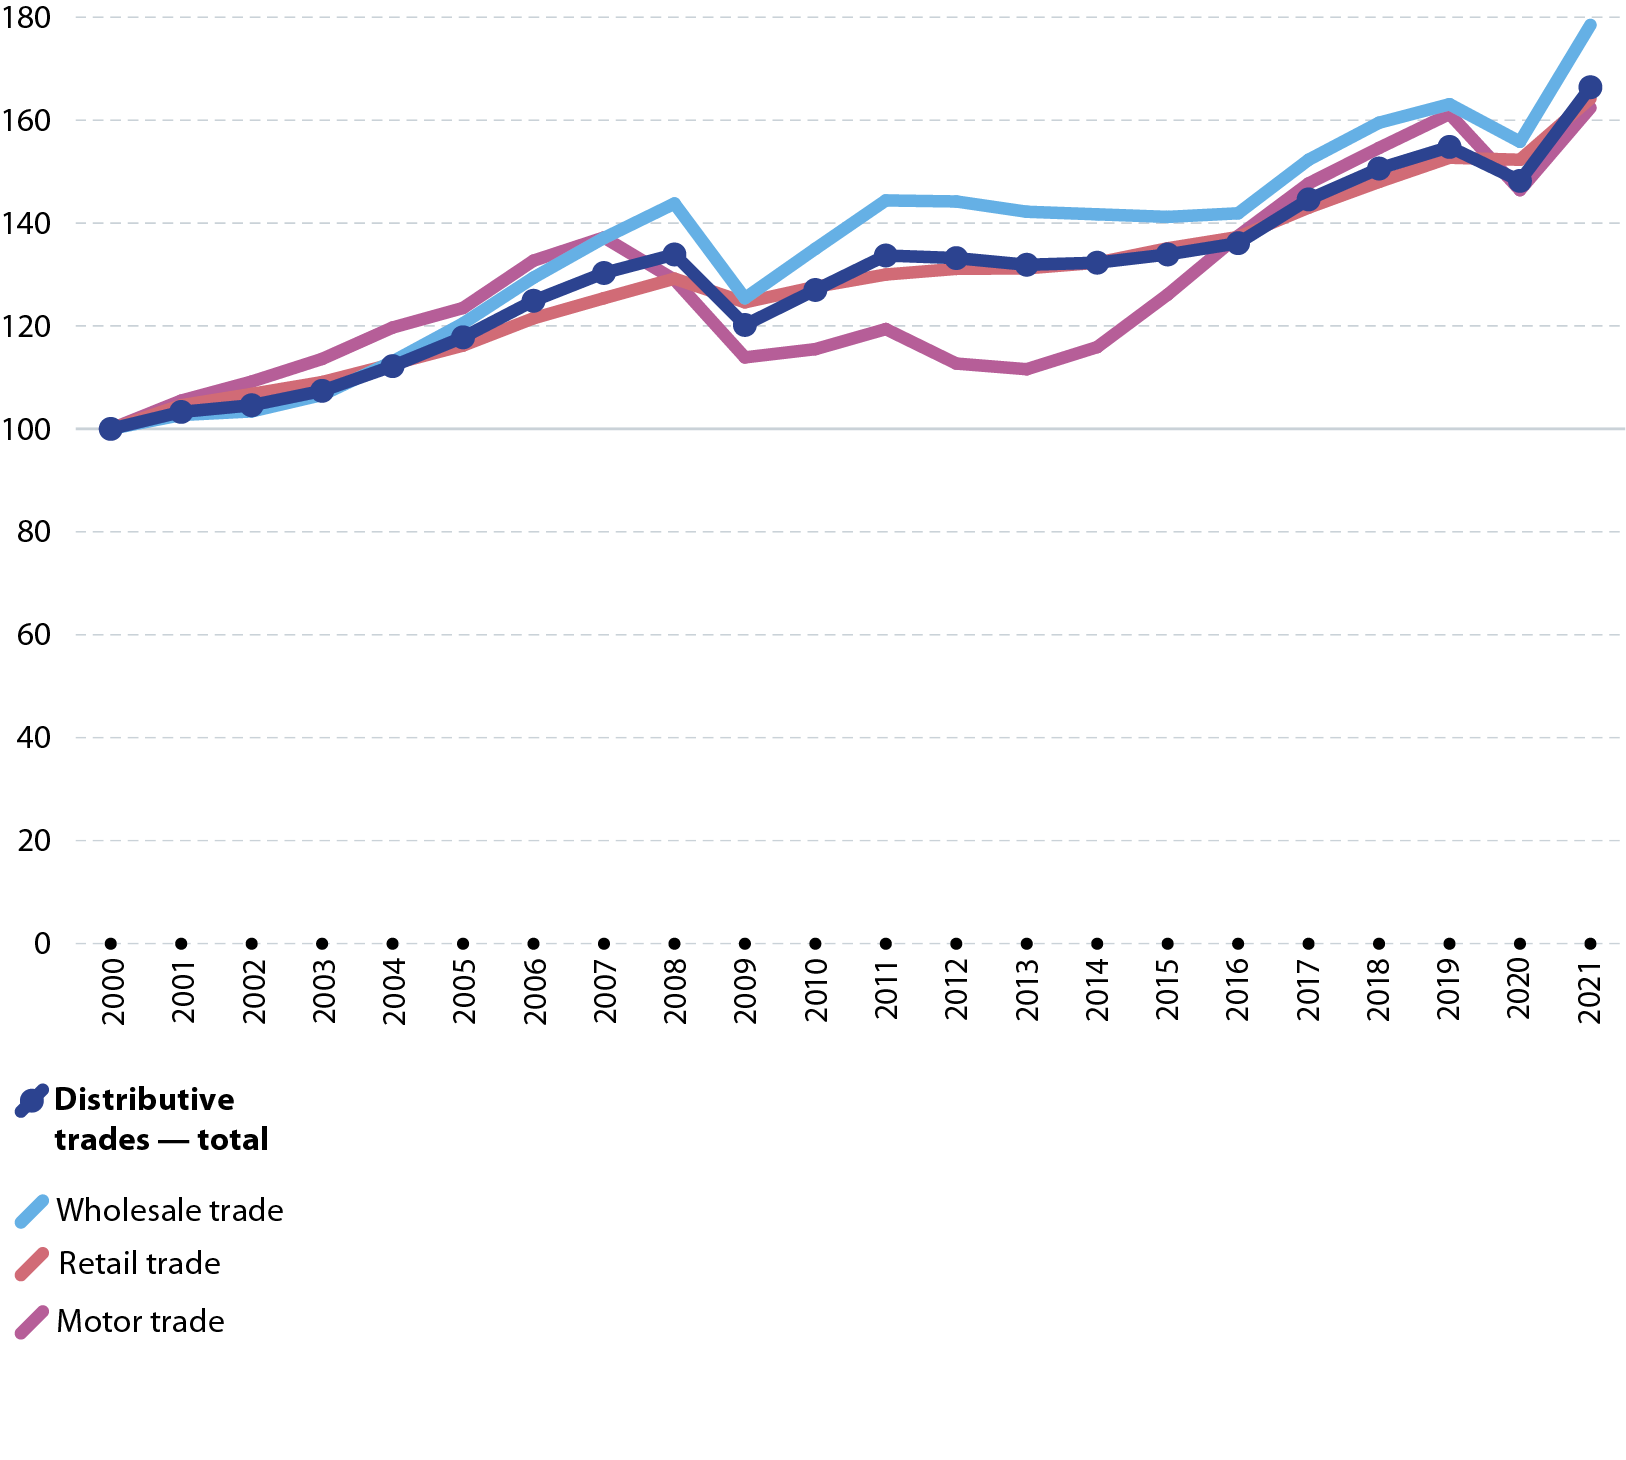
Turnover index. Data for the EU. Annual data for 2000 to 2021. Distributive trades total and three NACE divisions. Line graph.

Note: based on turnover value indices.

Source: Eurostat (online data code: sts_trtu_a)

The turnover index illustrates the development of sales in current prices, in other words this index has not been adjusted to remove the effects of prices changes. Between 2000 and 2021, the EU turnover index for distributive trades increased 66 % overall, equivalent to an average of 2.5 % per year.

In the years just before the global financial and economic crisis, the increase in the EU distributive trades turnover index slowed before a fall of 10.2 % was observed in 2009. Growth returned quite strongly in 2010 and 2011 but thereafter the rates of change were rather subdued for several years (including slight falls in turnover in 2012 and 2013). Stronger growth was again observed from 2017 to 2019 before a fall of 4.2 % was recorded in 2020, reflecting the impact of the COVID-19 pandemic, followed by a rebound of 12.3 % in 2021.

In turnover terms, the fastest growing distributive trades activity in the EU was wholesale trade; its turnover was 79 % higher in 2021 than it had been in 2000, an annual average increase of 2.8 %. Increases in turnover for the retail and motor trades were slightly more subdued, up 64 % and 62 % overall between 2000 and 2021.

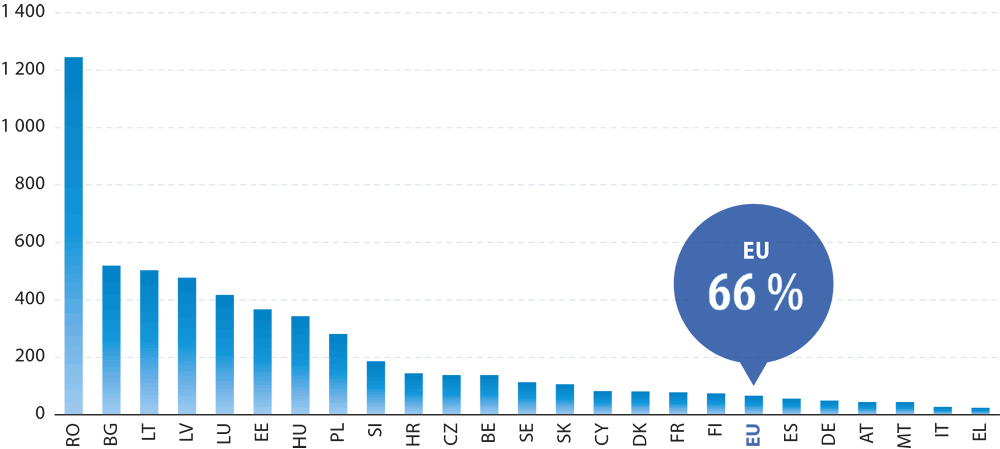
Overall change in the distributive trades turnover index (%, 2000–2021)

Developments in distributive trades turnover between 2000 and 2021 varied enormously between the EU Member States, reflecting differences in prices changes as well as underlying real changes. During this period, only six Member States recorded a lower overall change than was observed for the EU as a whole (up 66 %); among these were three of the largest, namely Spain, Germany and Italy. The largest overall increases in distributive trades turnover were recorded in Romania (up 1 245 %), Bulgaria (519 %), Lithuania (503 %), Latvia (477 %), Luxembourg (417 %), Estonia (367 %) and Hungary (343 %).

Overall change in the turnover index, in percent. Data for the EU and national data for the EU Member States and EFTA countries. Annual data for 2000 to 2021. Distributive trades total. Column chart.

Note: based on turnover value indices. IE, NL and PT: not available.

Source: Eurostat (online data code: sts_trtu_a)

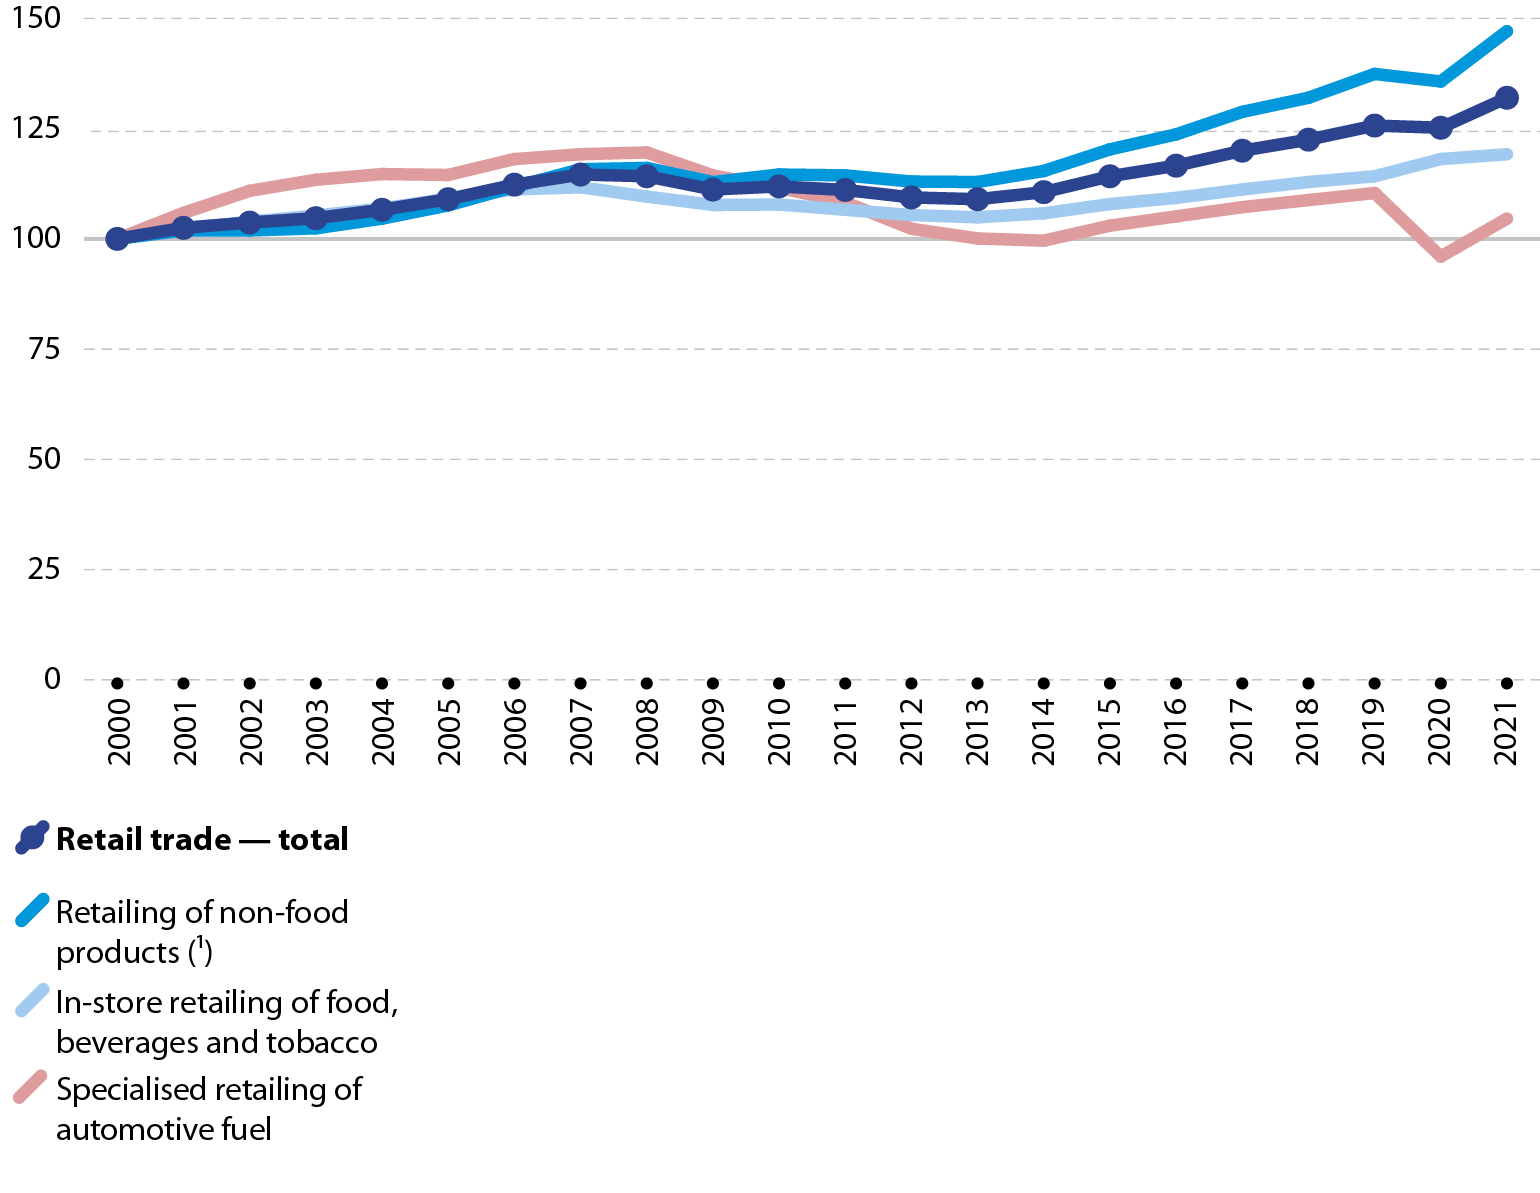
Volume of sales index for retail trade (2000 = 100, EU, 2000–2021)
Valume of sales index. Data for the EU. Annual data for 2000 to 2021. Retail trade, in-store food retail, non-food retail and specialised automotive fuel retailing. Line graph.

Note: based on deflated turnover indices. Retail trade covers NACE Rev. 2 Division 47. (¹) Also includes all retail trade not in stores.

Source: Eurostat (online data code: sts_trtu_a)

The volume of sales index for retail trade is adjusted for price changes in the goods that are sold. Between 2000 and 2021, this index increased 32 % overall in the EU, compared with an increase of 64 % for the retail trade turnover index (in current price terms). An overall increase (in volume terms) was observed between 2000 and 2021 for three types of retailing: non-food, food and automotive fuel retailing. Non-food retailing increased the most, up 47 % overall, while food retailing increased 19 % and automotive fuel 5 %.

The COVID-19 pandemic had a diverging impact on the retail sale of these goods. The volume of sales for food, beverages and tobacco was up 3.4 % in 2020, while a relatively small decline was recorded for non-food products (down 1.2 %) and a considerable decline for automotive fuel (down 13.1 %).

The volume of sales for food, beverages and tobacco continued upwards in 2021, but at a more subdued pace (up 0.9 %), while non-food retailing grew by 8.3 %, approximately double the next highest growth recorded in any of the previous 20 years. Growth for the retailing of automotive fuel was 9.0 % in 2021, recovering much but not all of the decline observed in 2020.

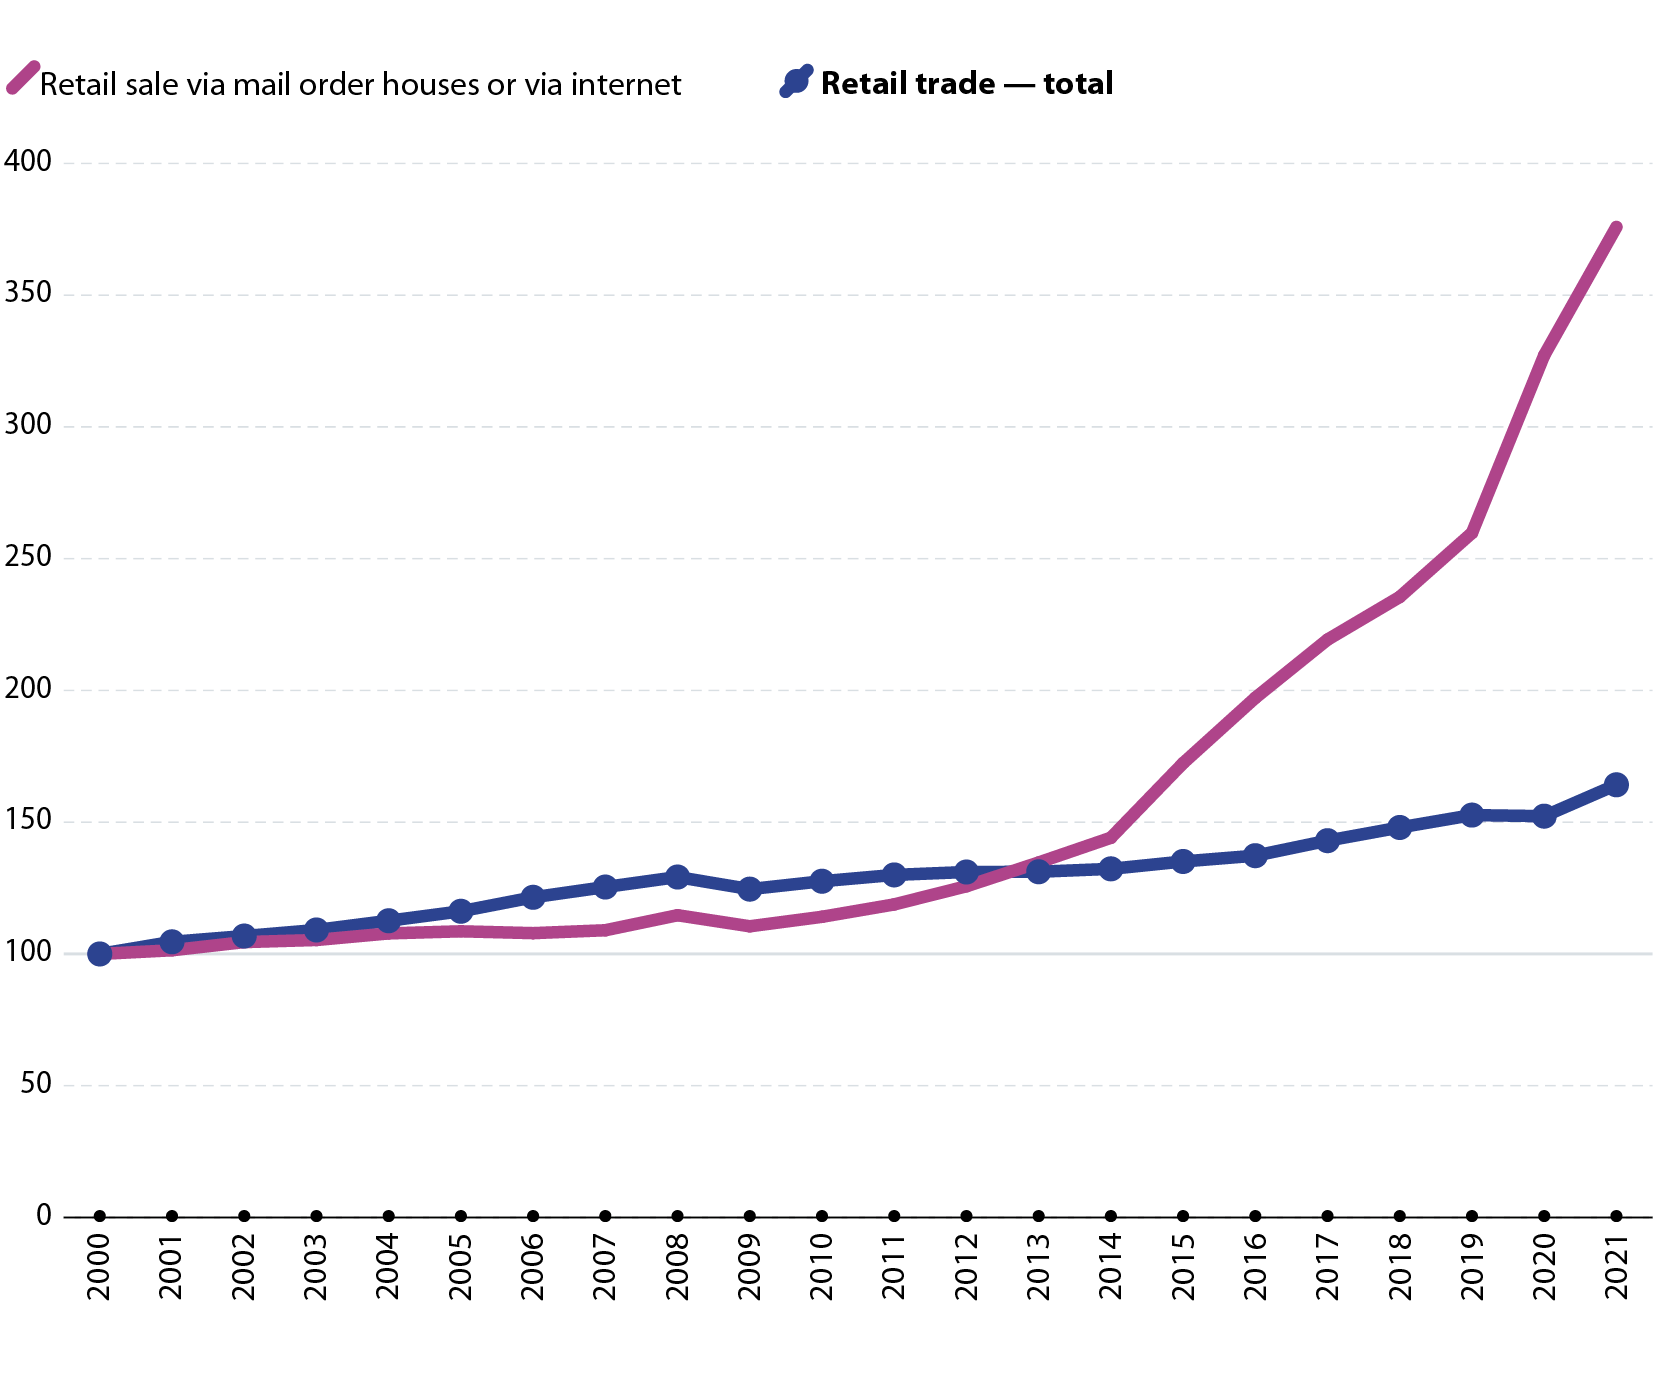
Turnover index for retail trade and retail sale via mail order houses or via internet (2000 = 100, EU, 2000–2021)
Turnover index. Data for the EU. Annual data for 2000 to 2021. Retail trade total and retail sale via mail order houses or via internet. Line graph.

Note: based on turnover value indices. Retail trade covers NACE Rev. 2 Division 47 and retail sale via mail order houses or via internet covers NACE Rev. 2 Class 47.91.

Source: Eurostat (online data code: sts_trtu_a)

As already noted, internet retailing has gained in significance over many years. Between 2000 and 2021, the EU turnover index for retail sale via mail order houses or via internet increased 276 %, corresponding to an average of 6.5 % per year. For comparison, the average increase for retail trade as a whole was 64 %, equivalent to 2.4 % per year. Turnover growth for retail sale via mail order houses or via internet was relatively moderate before 2008, was generally higher thereafter and has been particularly strong since 2015: annual growth rates were 10 % or higher in six out of the seven most recent years for which data are available, including 25.9 % growth in 2020 and 14.9 % growth in 2021.

Previous section Next theme

Latest developments

Monthly data for 2020 and to a lesser extent 2021 show the impact of the COVID-19 pandemic on distributive trades. The most recent data for 2022 may be impacted by a wider range of issues, for example aftereffects of the COVID-19 crisis on supply chains and early impacts from the Russian military aggression against Ukraine and the related sanctions.

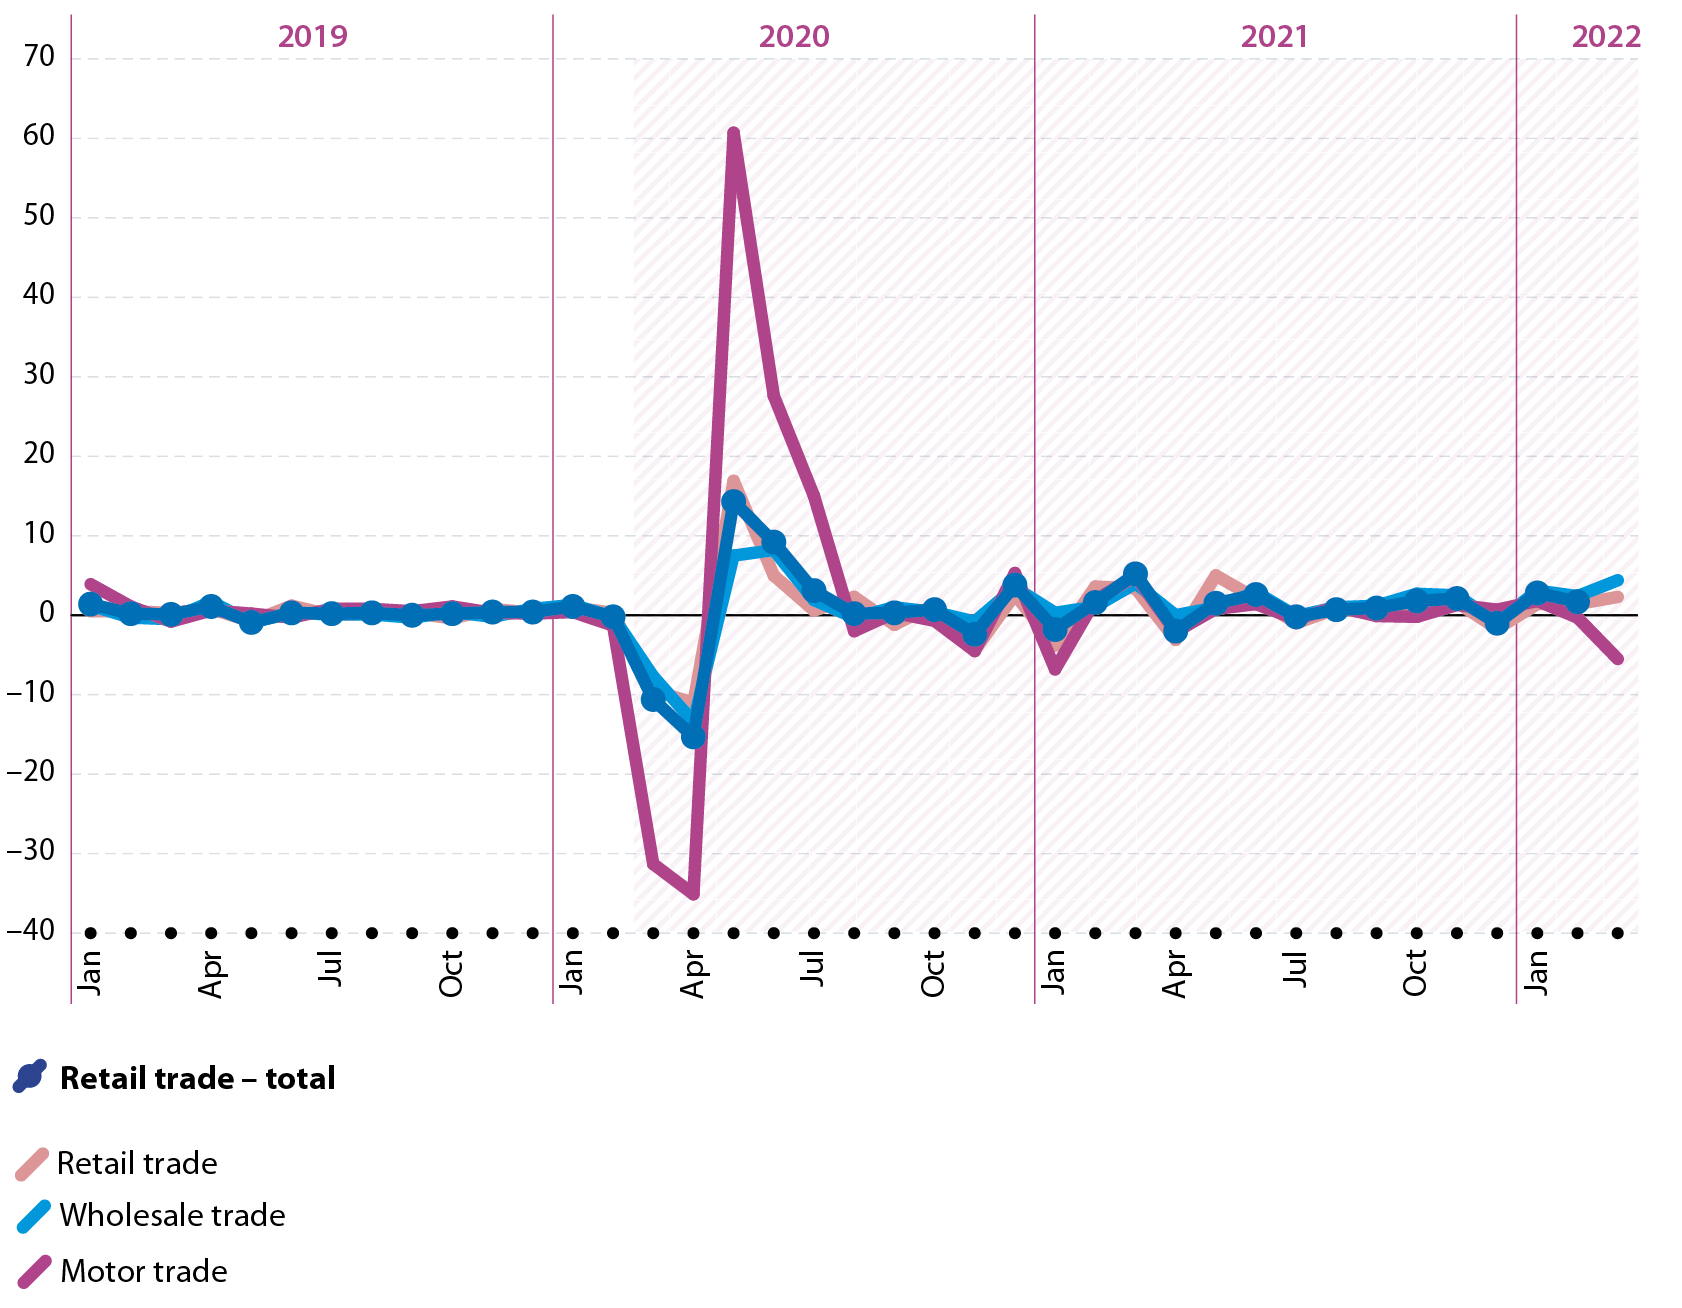
Distributive trades turnover indices (%, change compared with the previous month, EU, January 2019–March 2022)
Monthly change in the turnover index, in percent. Data for the EU. Monthly data for January 2019 to March 2022. Distributive trades total and NACE divisions. Line graph.

Note: March 2022, not available for distributive trades.

Source: Eurostat (online data code: sts_trtu_m)

The main decline in distributive trades turnover during the early stage of the COVID-19 crisis was in March and April 2020, with a strong but partial recovery in May and June. To assess the impact of the first wave of the pandemic, sales in April 2020 can be compared with those in February 2020. The strongest decline among the distributive trades divisions was recorded for motor trades, as EU sales were down 55 % overall; by contrast, turnover fell 20 % for wholesale trade and 19 % for retail trade.

Distributive trades turnover rebounded strongly in the late spring / early summer of 2020 and continued a generally upward development through the rest of 2020, all of 2021 and into 2022. By February 2021, distributive trades turnover was close to the level it had been in February 2020; by February 2022, it was 17 % above its pre-pandemic level.

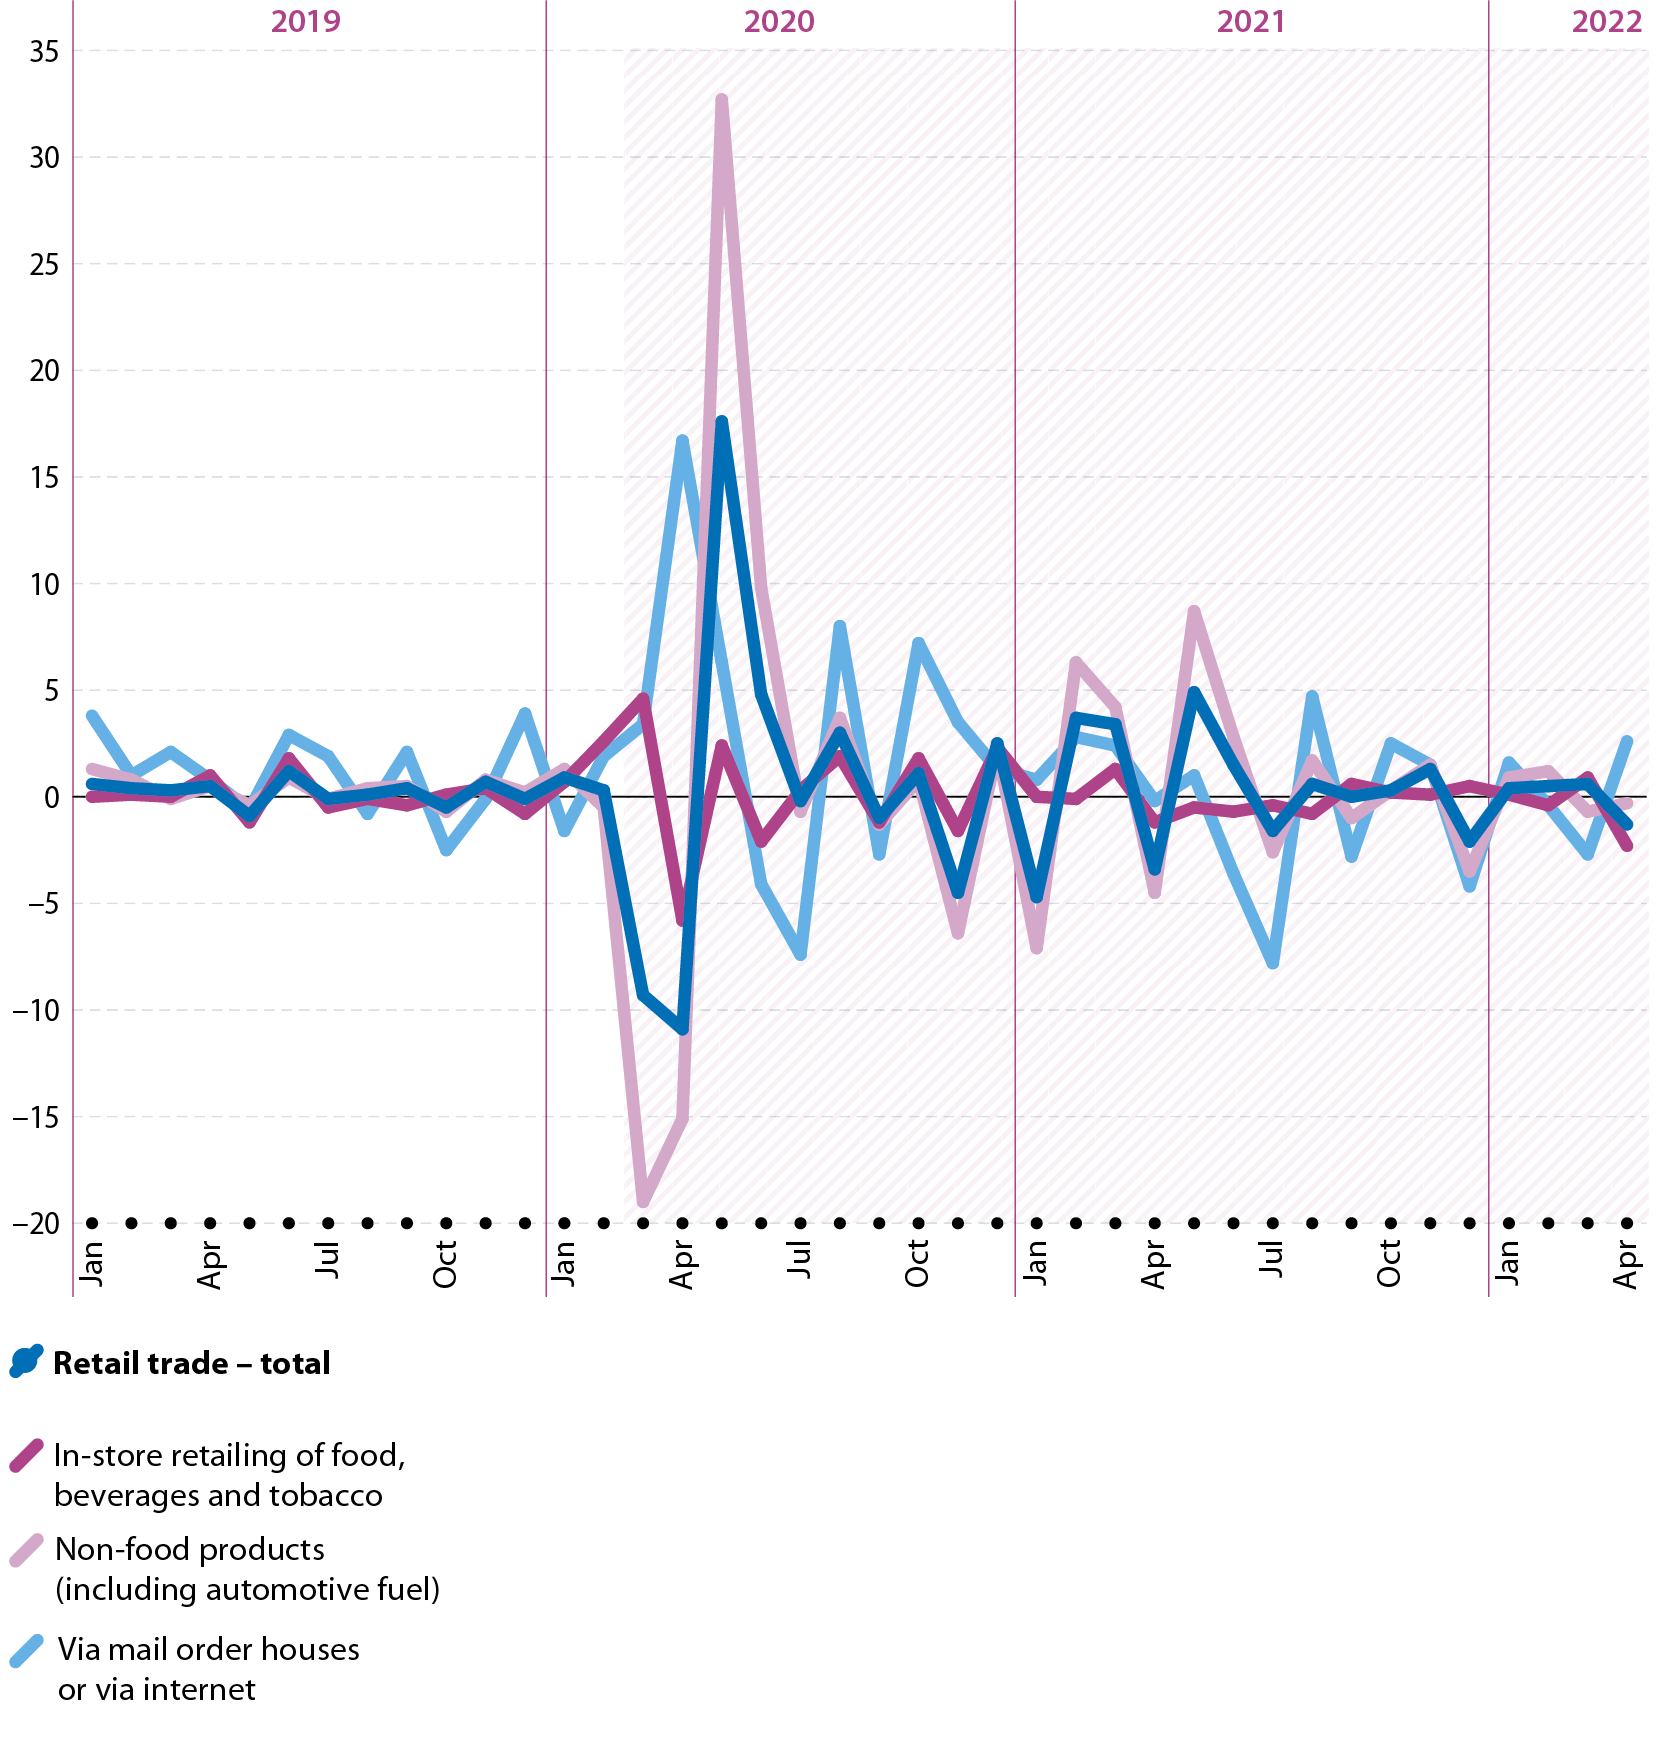
Volume of sales index for retail trade (%, change compared with the previous month, EU, January 2019–April 2022)
Monthly change in the volume of sales index, in percent. Data for the EU. Monthly data for January 2019 to April 2022. Retail trade, in-store food retail, non-food retail including specialised automotive fuel retailing, and retail sale via mail order houses or via internet. Line graph.

Note: the retailing of non-food products includes all retail trade not in stores (whether of food, beverages or tobacco or not), including retailing via mail order houses or via internet.

Source: Eurostat (online data code: sts_trtu_m)

The pandemic had a particularly large impact on the development of retailing. Between February and April 2020, the EU volume of sales index fell 31 % for non-food products (including automotive fuel), compared with 1 % for food, beverages and tobacco, while there was a 21 % increase in sales via mail order houses or via internet. By June 2020, the volume of sales index for retail trade was approximately back to the level it had been in February 2020; for sales via mail order houses or via internet, the index was 23 % above the February level.

During the winter months, the EU’s retail trade volume of sales fell again, down 4.5 % in November 2020 and 4.7 % in January 2021, with growth of 2.5 % between these two values. Relatively rapid growth in February, March and May 2021 was interrupted by a fall of 3.4 % in April. By May 2021, the volume of sales index for retail trade was 4 % above the level it had been in February 2020, with sales via mail order houses or via internet up 44 %. More subdued monthly rates of change returned from June 2021 through to April 2022, ranging between -2.1 % and 1.5 %.

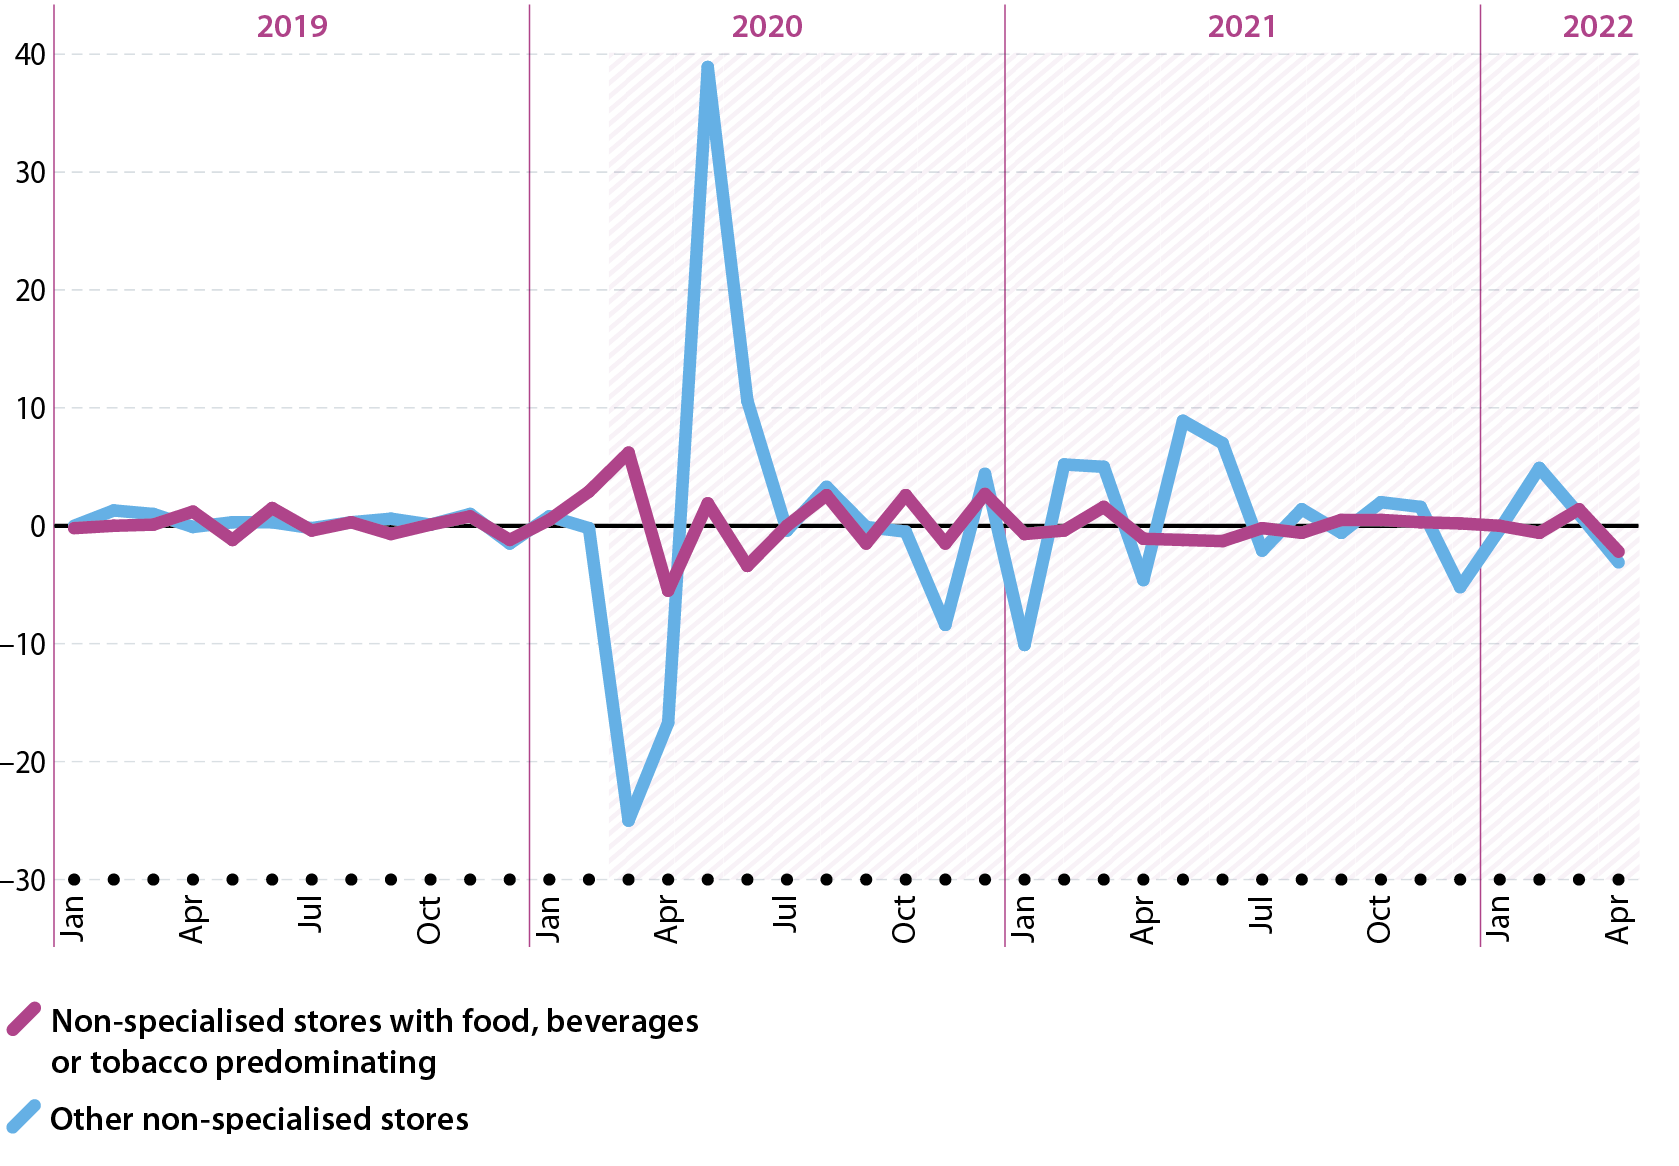
Volume of sales index for retail trade in non-specialised stores (%, change compared with the previous month, EU, January 2019–April 2022)
Monthly change in the volume of sales index, in percent.  Data for the EU. Monthly data for January 2019 to April 2022. Retail trade in non-specialised stores: food, beverages or tobacco predominating; other. Line graph. In March 2020, the volume of sales index for non-specialised in-store retaling with food, beverages or tobacco predominating in the EU increased strongly, but fell back  somewhat in April. The monthly developments for this activity remained quite volatile into Spring 2021. For other non-specialised stores, In March and April 2020 thevolume of sales index for the EU fell strongly, reflecting the impact of the COVID-19 crisis. It recovered strongly in May. The monthly developments for this activity remained quite volatile until Summer 2021.

Source: Eurostat (online data code: sts_trtu_m)

Looking in more detail at the volume of sales for non-specialised in-store retailing, the developments for food, beverage and tobacco retailers were more volatile than usual during the early months of the pandemic – particularly from February to June 2020 – as rates of change ranged from -5.5 % to 6.2 %. From January 2021 to March 2022, the monthly rates of change for the volume of sales were in the range of -1.3 % to 1.6 %, broadly in line with pre-pandemic developments. A notably stronger fall, down 2.2 %, was observed in April 2022.

For the non-food non-specialised stores, the developments during the early months of the pandemic were much more volatile: falls of 25.0 % and 16.7 % were recorded in March and April 2020, followed by a partial rebound of 38.9 % and 10.6 % in May and June 2020. The volume of sales for this activity remained volatile, with rates of change in late 2021 and early 2022 often greater than those recorded before the pandemic.

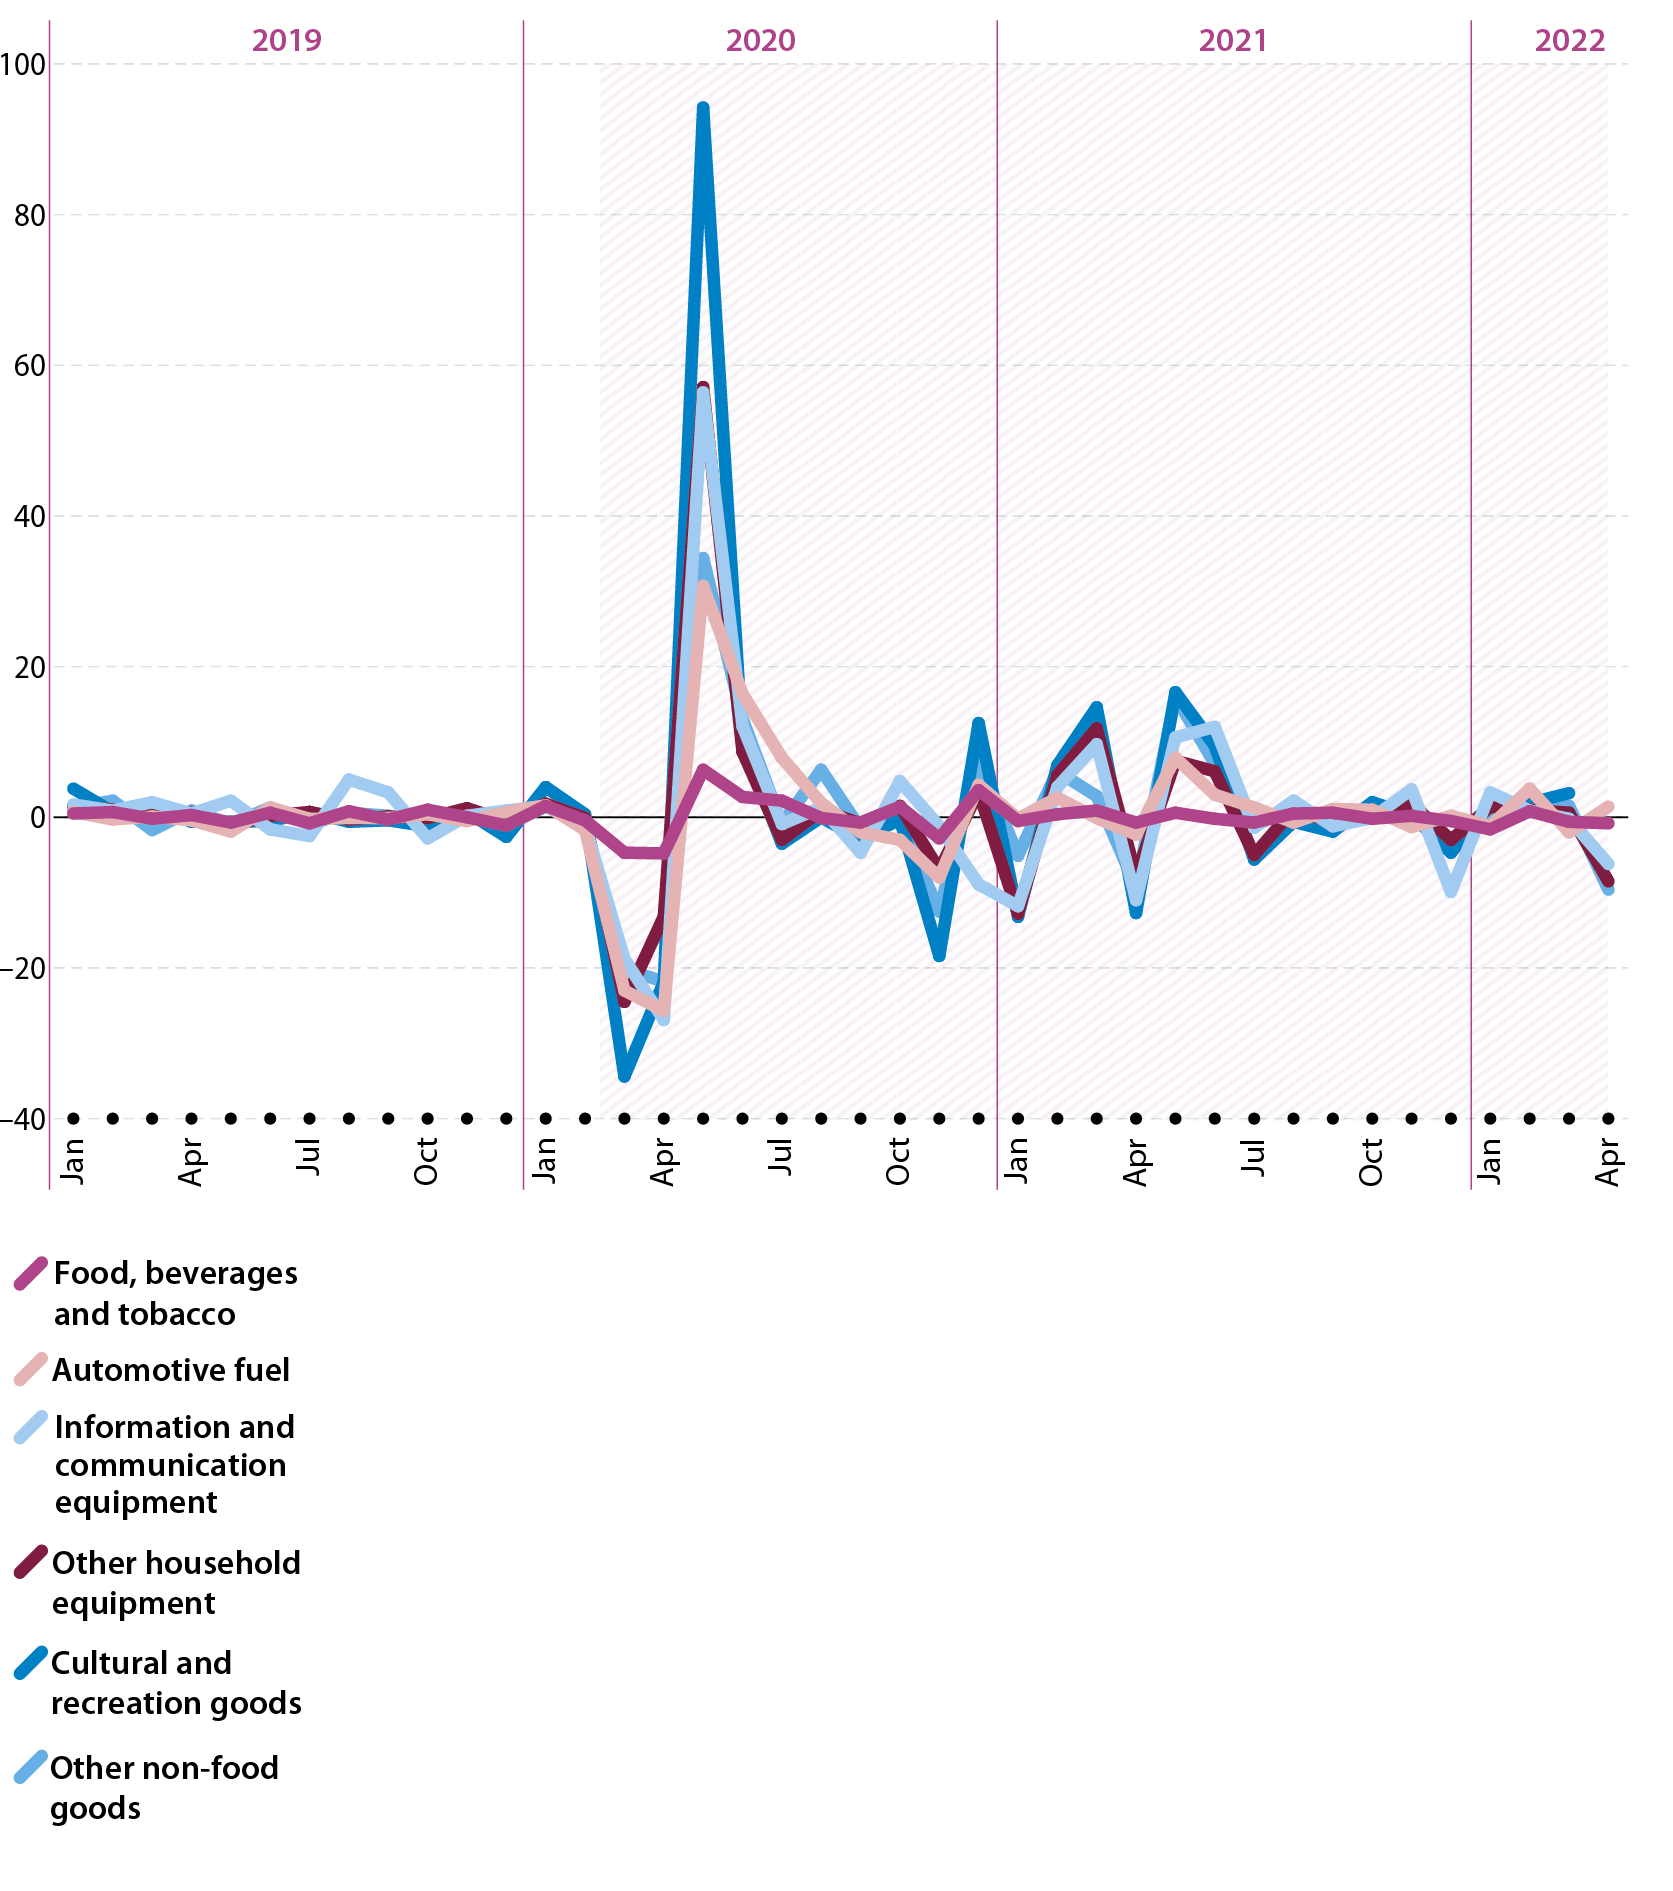
Volume of sales index for retail trade in specialised stores (%, change compared with the previous month, EU, January 2019–April 2022)
Monthly change in the volume of sales index, in percent. Data for the EU. Monthly data for January 2019 to April 2022. Retail trade in six types of specialised stores. Line graph. In March and April 2020, the volume of sales index for all types of specialised in-store retailing in the EU decreased strongly. The recovery in June 2020 was very varied, one activity recovering only slightly, two more strongly, and three completely. Nevertheless, monthly developments for the volume of sales index retailing remained volatile for the rest of 2020 and into 2021 for most types of specialised in-store retailing.

Note: April 2022, not available for specialised retail of cultural and recreation goods.

Source: Eurostat (online data code: sts_trtu_m)

Turning to specialised in-store retailing, the developments for food, beverage and tobacco retailers were also more volatile than usual during the early months of the pandemic. As for their non-specialised counterparts, the developments for their volume of sales returned to relative stability at the beginning of 2021.

The five non-food specialised in-store retailing activities experienced a strong downturn in the volume of sales in March and April 2020, followed by a rebound during the next two months. For information and communication equipment retailing, other household equipment retailing, and cultural and recreation goods retailing, the rebound was strong enough that the volume of sales was higher in June 2020 than in February 2020. For these five non-food activities, the developments for the volume of sales remained volatile until June or July 2021. From the summer of 2021 onwards, rates of change were closer to those observed before the pandemic, although there were some relatively high rates of change – some positive and some negative – for individual activities during the winter of 2021/22 and into spring 2022.

Previous section Next theme
Go to the top of the page