Tourism Download chapter 7 of Key figures on European business in PDF format

Previous theme Next section

Structure

Tourism is travel to a destination away from home for less than one year, for pleasure, business or other personal reason.
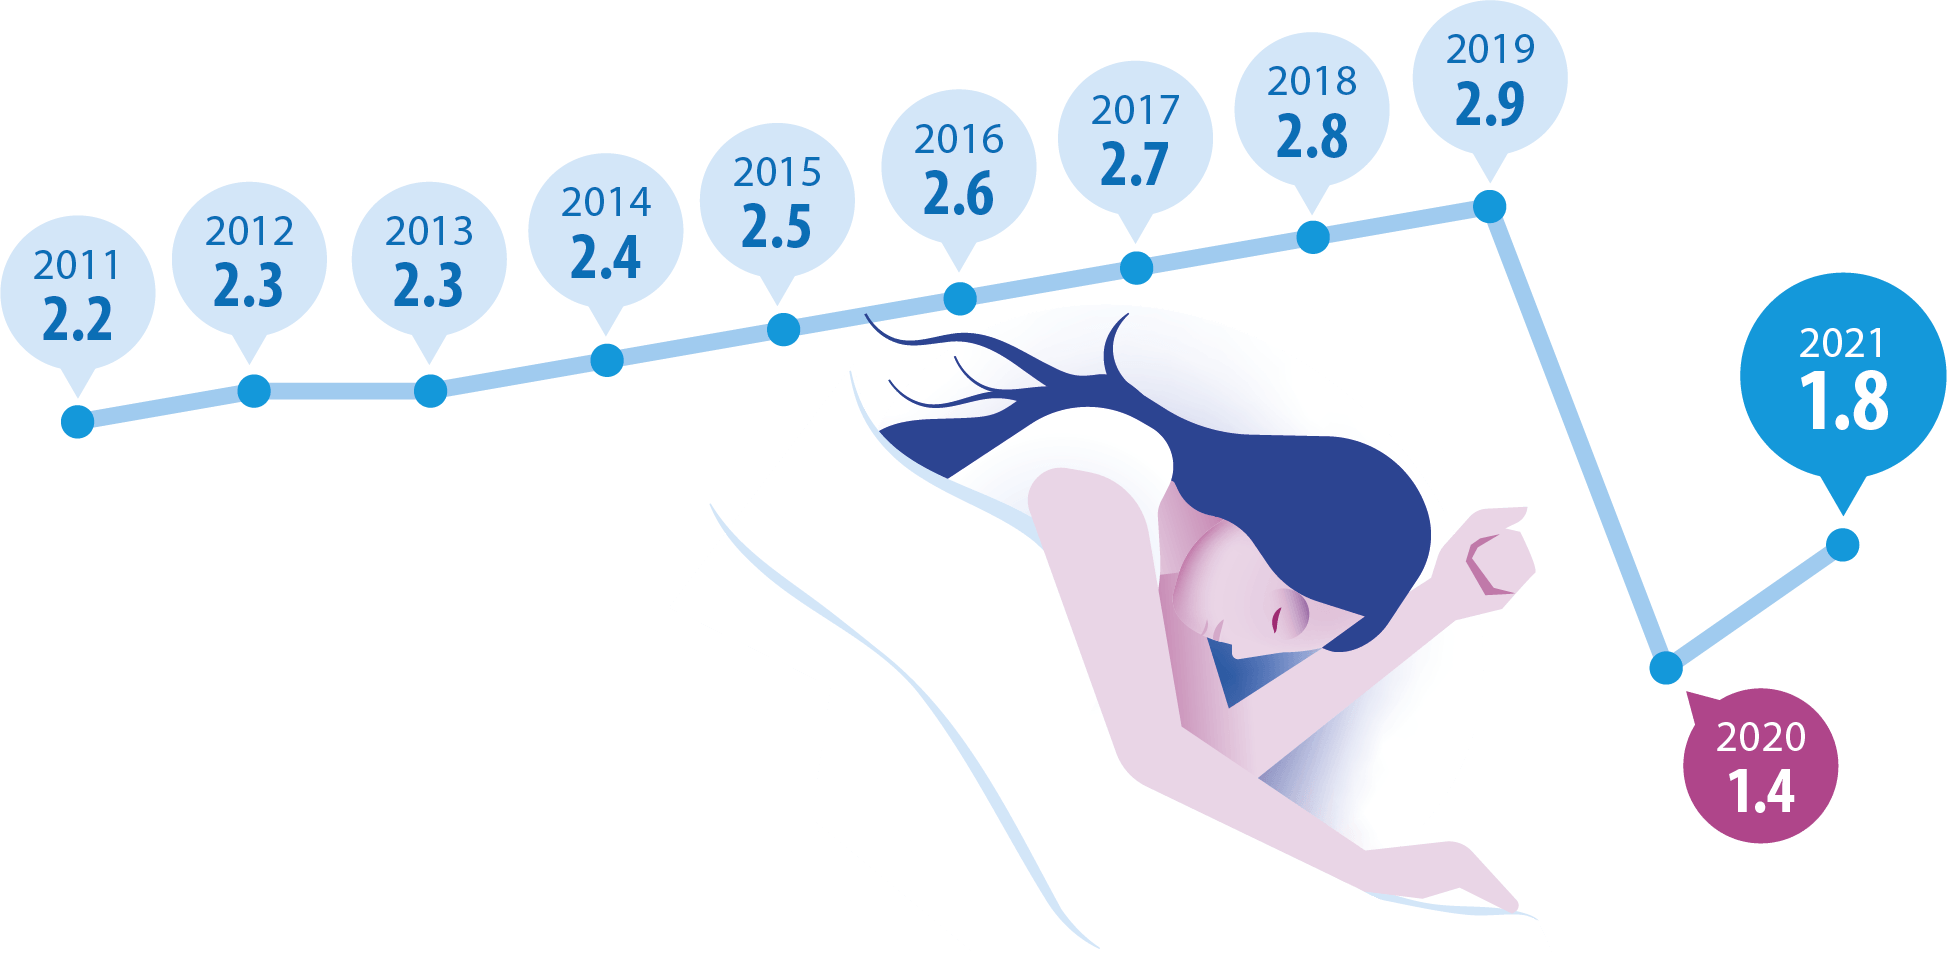
Nights spent in tourism accomodation (billion, EU, 2011-2021)
Nights spent in tourist accommodation, in billion. Data for the EU. Annual data for 2011 to 2021. Line graph. Source: Eurostat (online data codes: tour_occ_ninat and tour_occ_nim)

Source: Eurostat (online data codes: tour_occ_ninat and tour_occ_nim)

Number of nights in tourist accommodation (million nights spent, 2019)

Source: Eurostat (online data code: tour_occ_ninat)

Between 2011 and 2019, the number of nights spent in tourist accommodation in the EU increased at an average rate of 3.1 % per year. This sustained period of growth was followed by a sharp contraction (down 50.5 %) in 2020 – as the COVID-19 crisis started – and a partial rebound (up 27.8 %) in 2021.

In 2021, 1.8 billion nights were spent in tourist accommodation in the 27 EU Member States. This overall figure includes nights spent by domestic tourists (those travelling within their country of residence) and inbound international tourists (coming from other Member States or from non-EU countries). The largest markets in the EU were France, Italy, Germany and Spain, each recording 259–324 million nights spent in tourist accommodation.

Capital city share of nights booked through booking platforms (%, 2021)

Data on short-stay accommodation rentals are available from Airbnb, Booking, Tripadvisor and Expedia Group. In 2021, 364 million guest nights were spent in the EU in holiday rentals booked through one of these four platforms, well below the 512 million total in 2019, before the onset of the COVID-19 crisis.

In 2021, more than half of the nights spent in accommodation booked through these platforms in Luxembourg, Hungary and Malta were in the capital city. By contrast, this share was below 10.0 % in some of the larger EU Member States (Italy, the Netherlands, France, Germany and Spain) and was just under 3.0 % in Croatia and Cyprus, reflecting the coastal domination of their tourism supply.
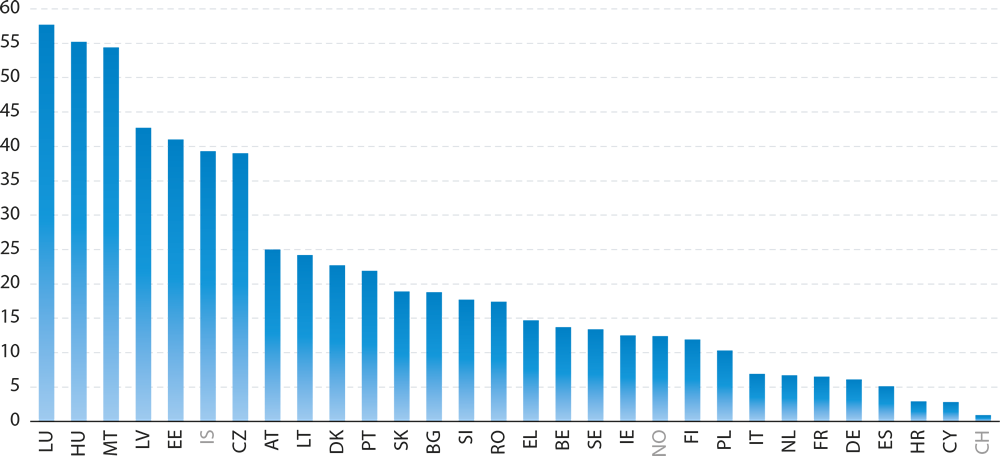
Capital city share of nights booked through booking platforms, in percent. National data for the EU Member Sates and EFTA countries. Annual data for 2021. Business economy. Bar chart.

Source: Eurostat (experimental statistics)
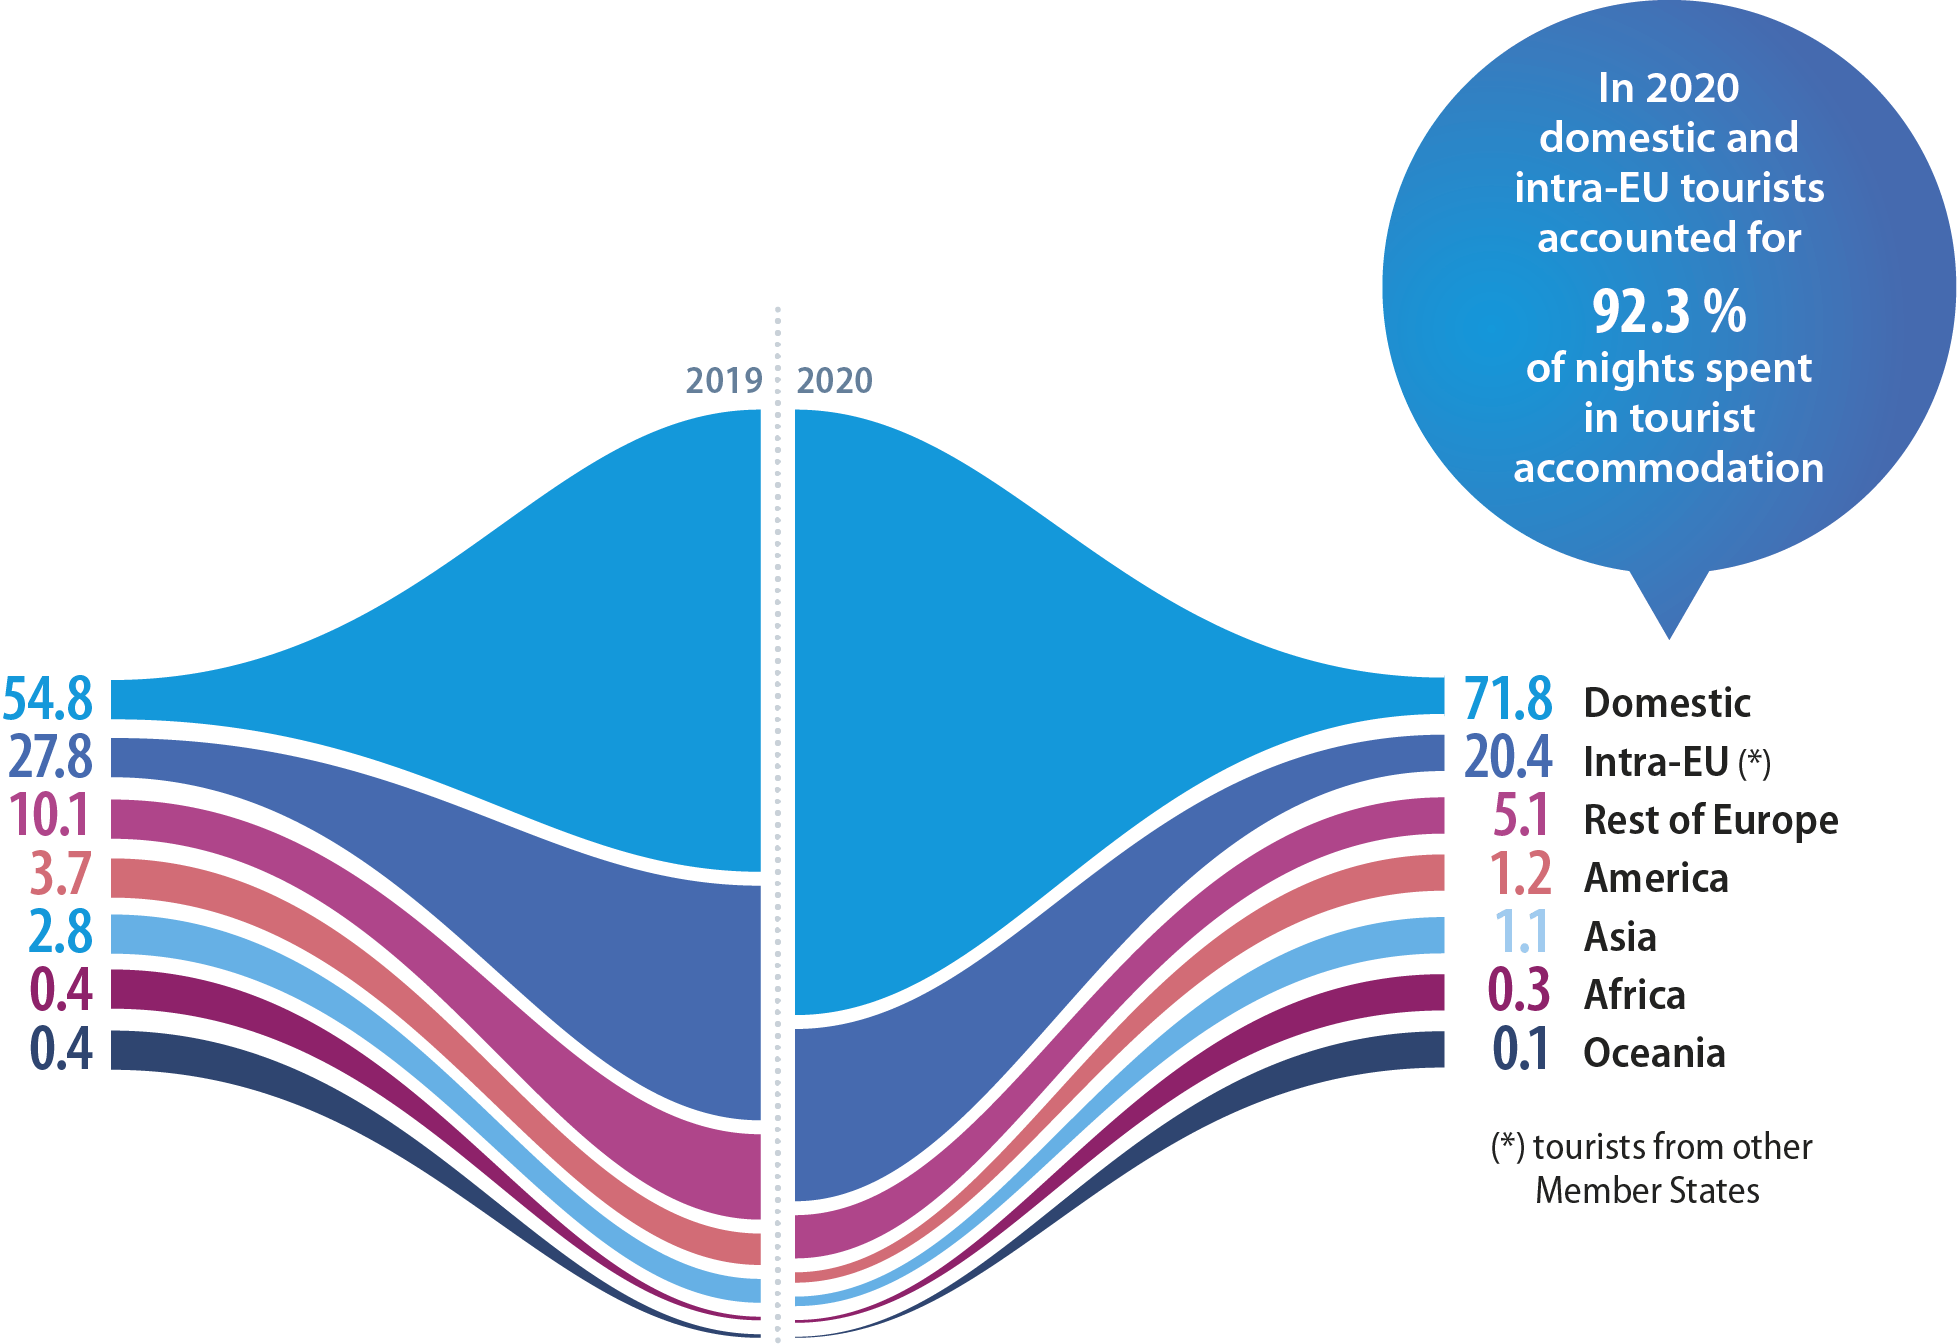
Nights spent in tourist accommodation according to the residence of tourists (%, share of all tourist nights, EU, 2019 and 2020)
Nights spent according to the residence of tourist, in percent. Data for the EU (excluding data for IE, EL, CY, LU and SE). Annual data for 2019 and 2020. Tourist accomodation. Bar chart.

Note: excluding IE, EL, CY, LU and SE; the data represent 91 % of the total nights spent in EU tourist accommodation.

Source: Eurostat (ad hoc voluntary data collection)

Domestic tourists accounted for more than two thirds (71.8 %) of nights spent in tourist accommodation across the EU (1) in 2020. Tourists from other EU Member States accounted for one fifth (20.4 %) of the total. As such, domestic and international tourists from within the EU accounted for 92.3 % of all nights spent in 2020, with international tourists from non-member countries constituting the remaining 7.7 %. Among the nights spent by tourists from non-member countries, by far the largest origin was the rest of Europe.

(1) These data for the EU are based on data for 22 EU Member States which, collectively, accounted for 91 % of the total nights spent in EU tourist accommodation.

Previous section Next section

Seasonality

Seasonality of nights spent in tourist accommodation (million nights, EU, January 2019–February 2021)
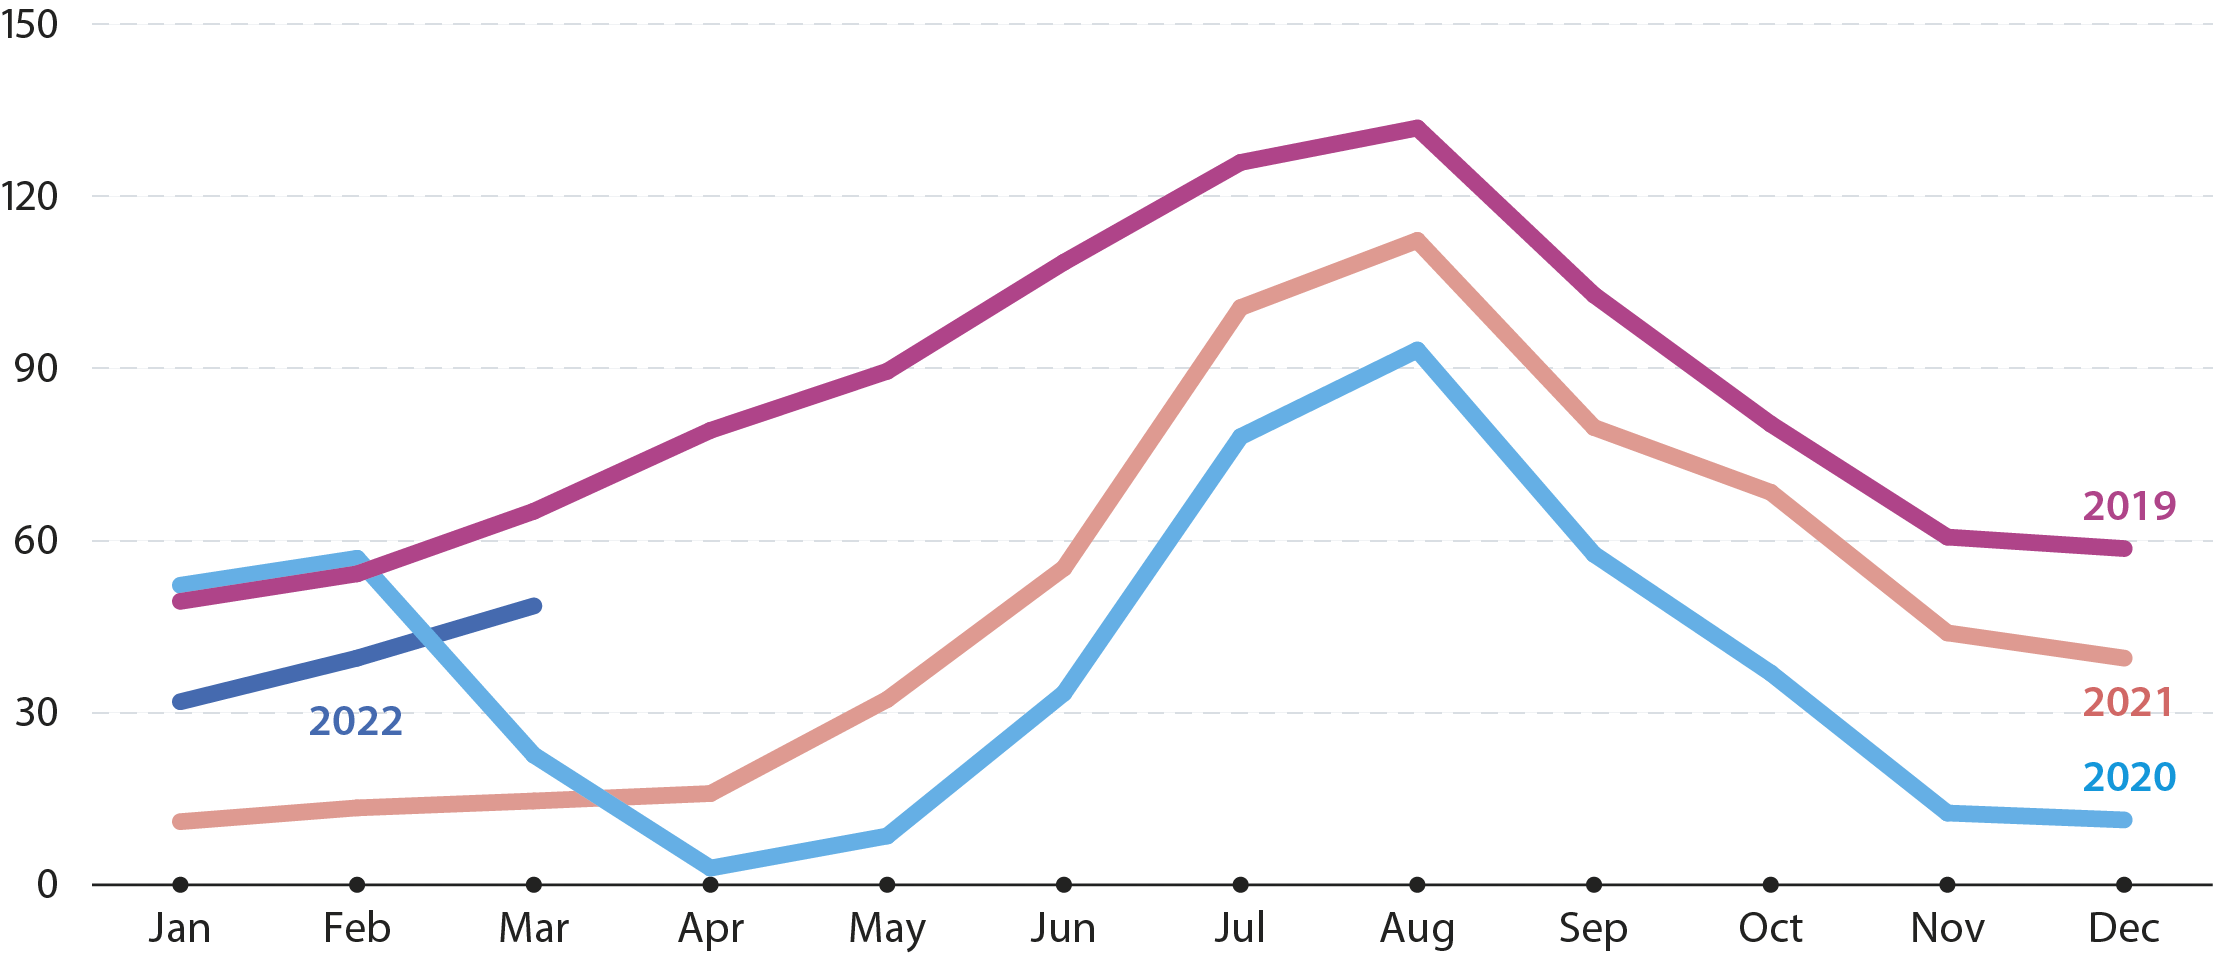
Nights spent, in million. Data for the EU. Monthly data for January 2019 to February 2022. Tourist accommodation. Domestic and international tourists. Line chart.

Source: Eurostat (online data code: tour_occ_nim)

One of the key measures of tourism seasonality is monthly data for nights spent in tourist accommodation. The seasonal patterns for domestic tourists and international tourists were quite similar during 2019, with domestic tourists accounting for 48–59 % of the total nights spent, depending on the month. However, the share of domestic tourists was far higher during 2020 when they accounted for 55 % and 56 % respectively in January and February, before the COVID-19 outbreak, while for the remaining months this share ranged between 61% and 90 % of the total nights spent in EU tourist accommodation. The lower level of demand from international tourists likely reflects increased uncertainty during the COVID-19 pandemic, with this group primarily affected by cancelled transport services and/or travel restrictions.
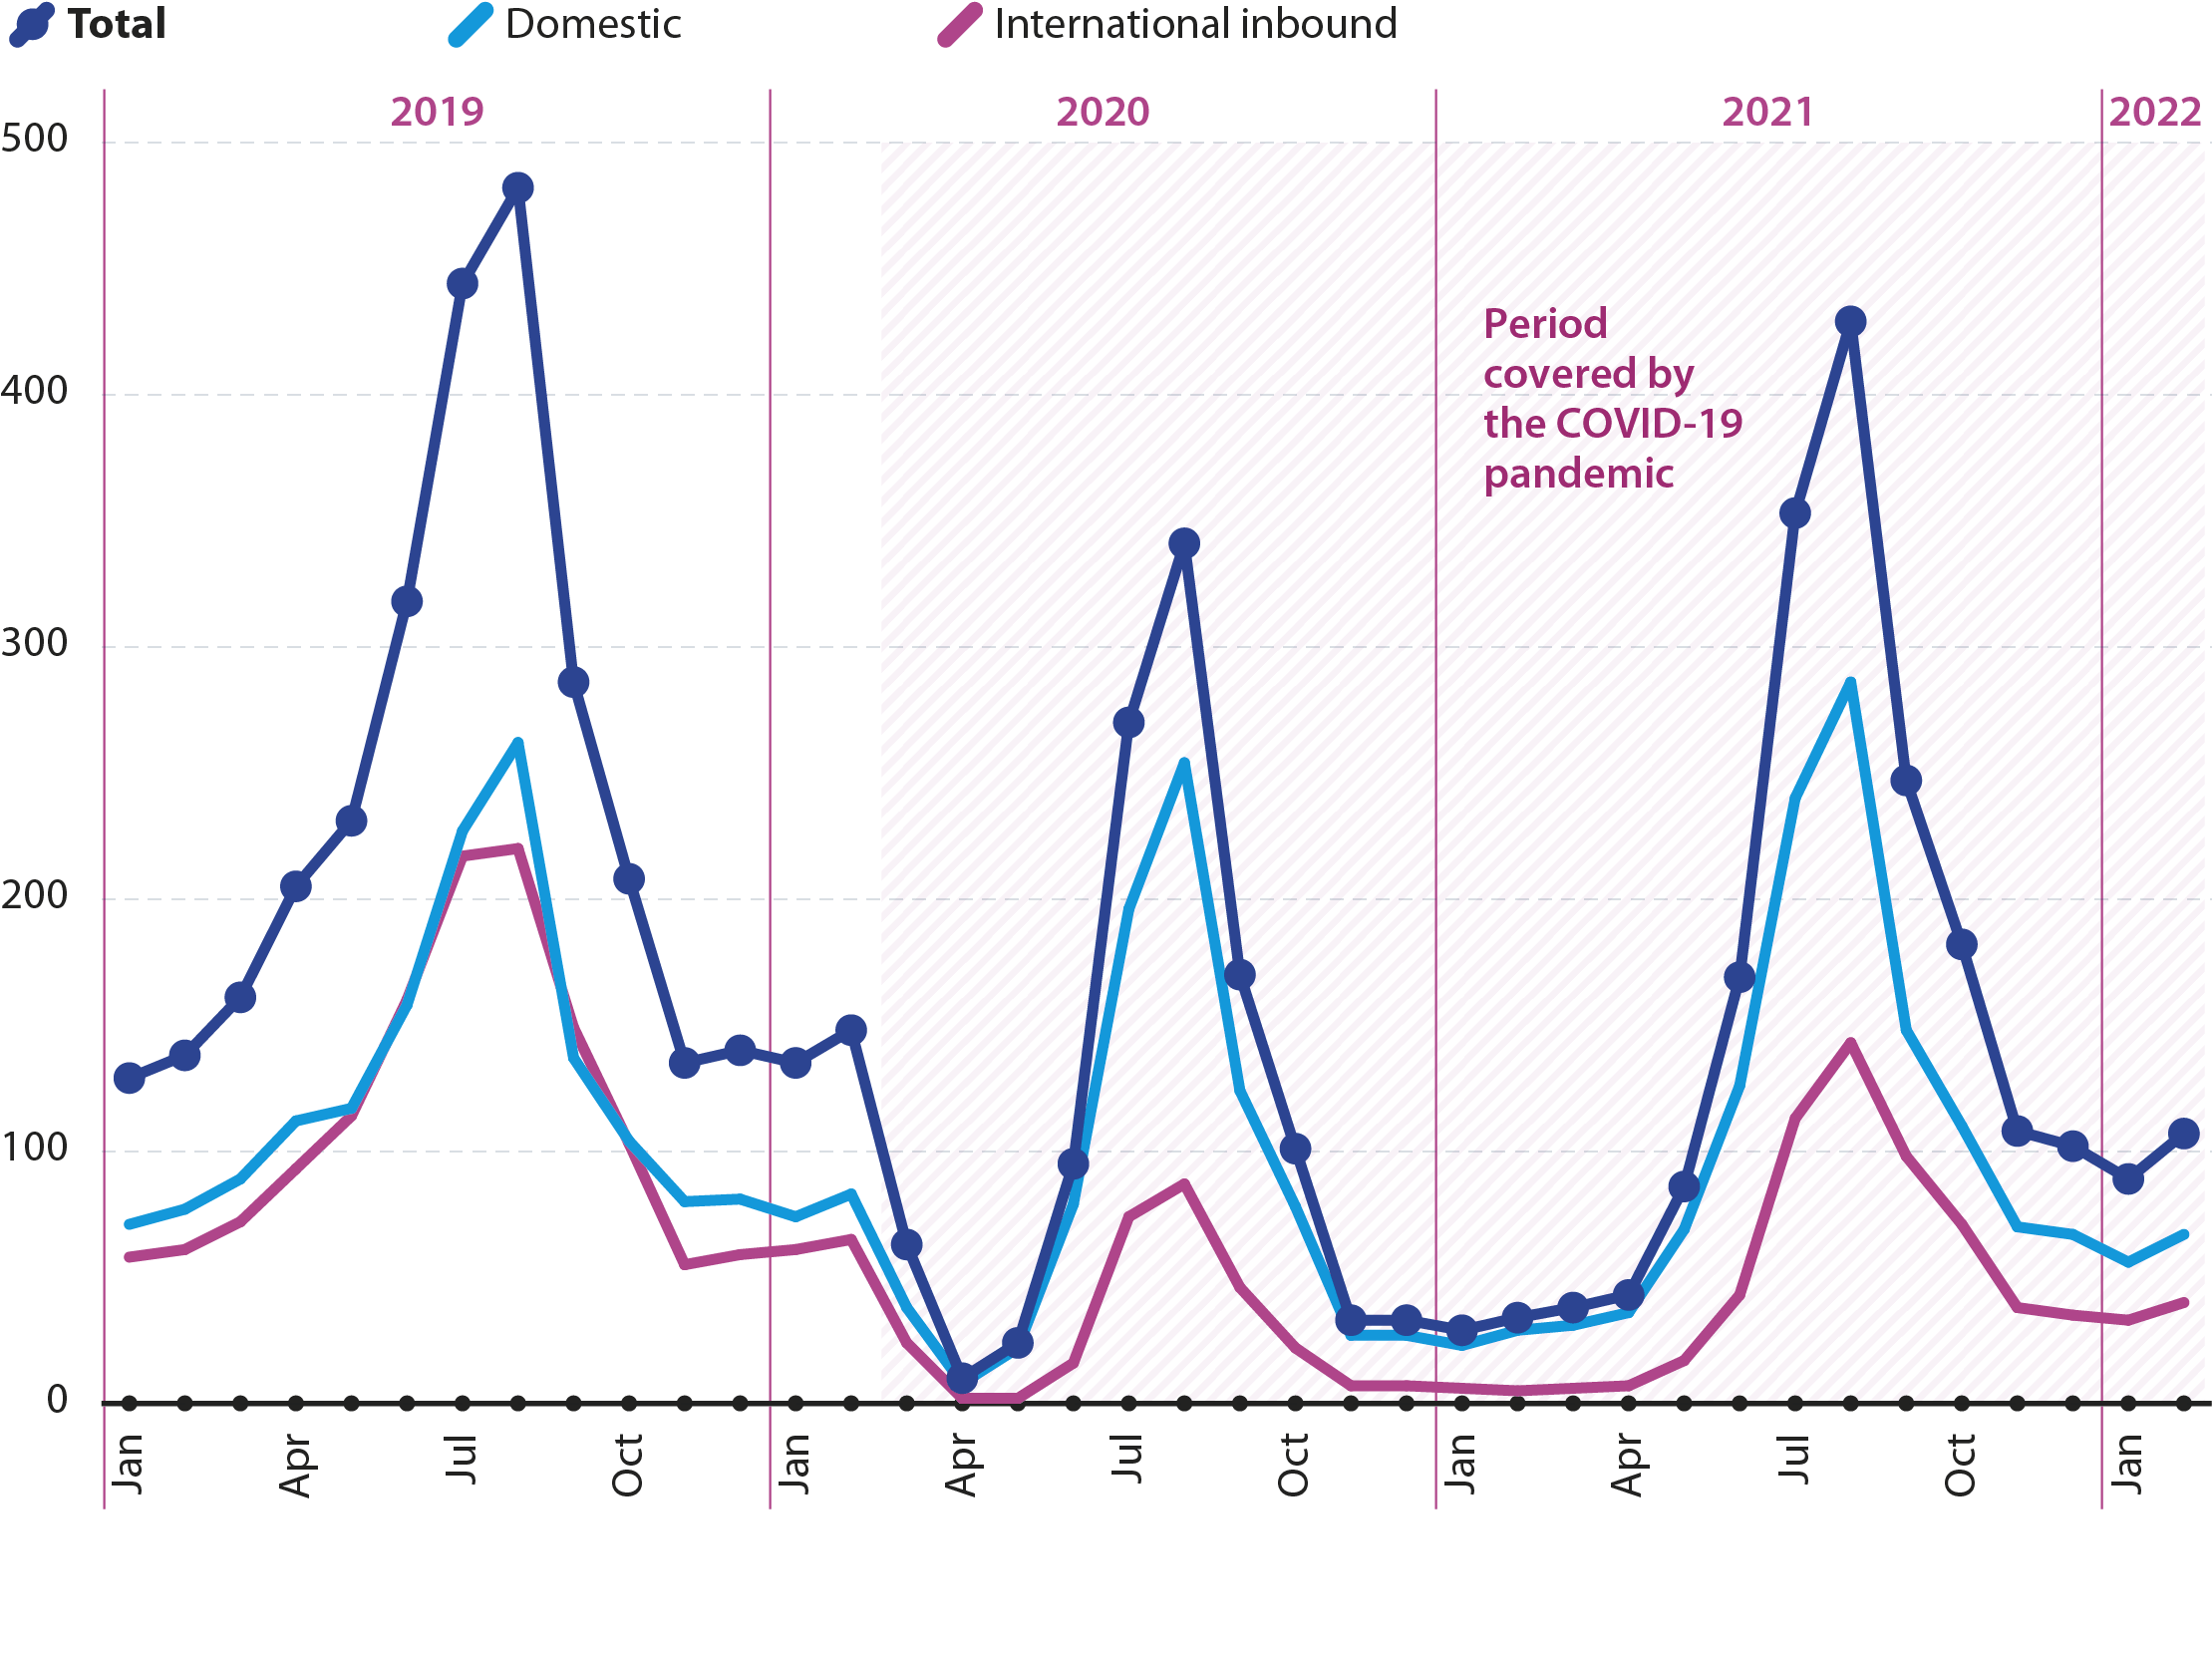
In each month of 2021, the share of domestic tourists remained above that observed for each month of 2019, ranging from 60 % to 84 %. For each month from April 2021, the share of domestic tourists was lower than that observed for the same month in 2020.

Nights spent in tourist accommodation in July and August (%, share of annual nights spent, 2021)
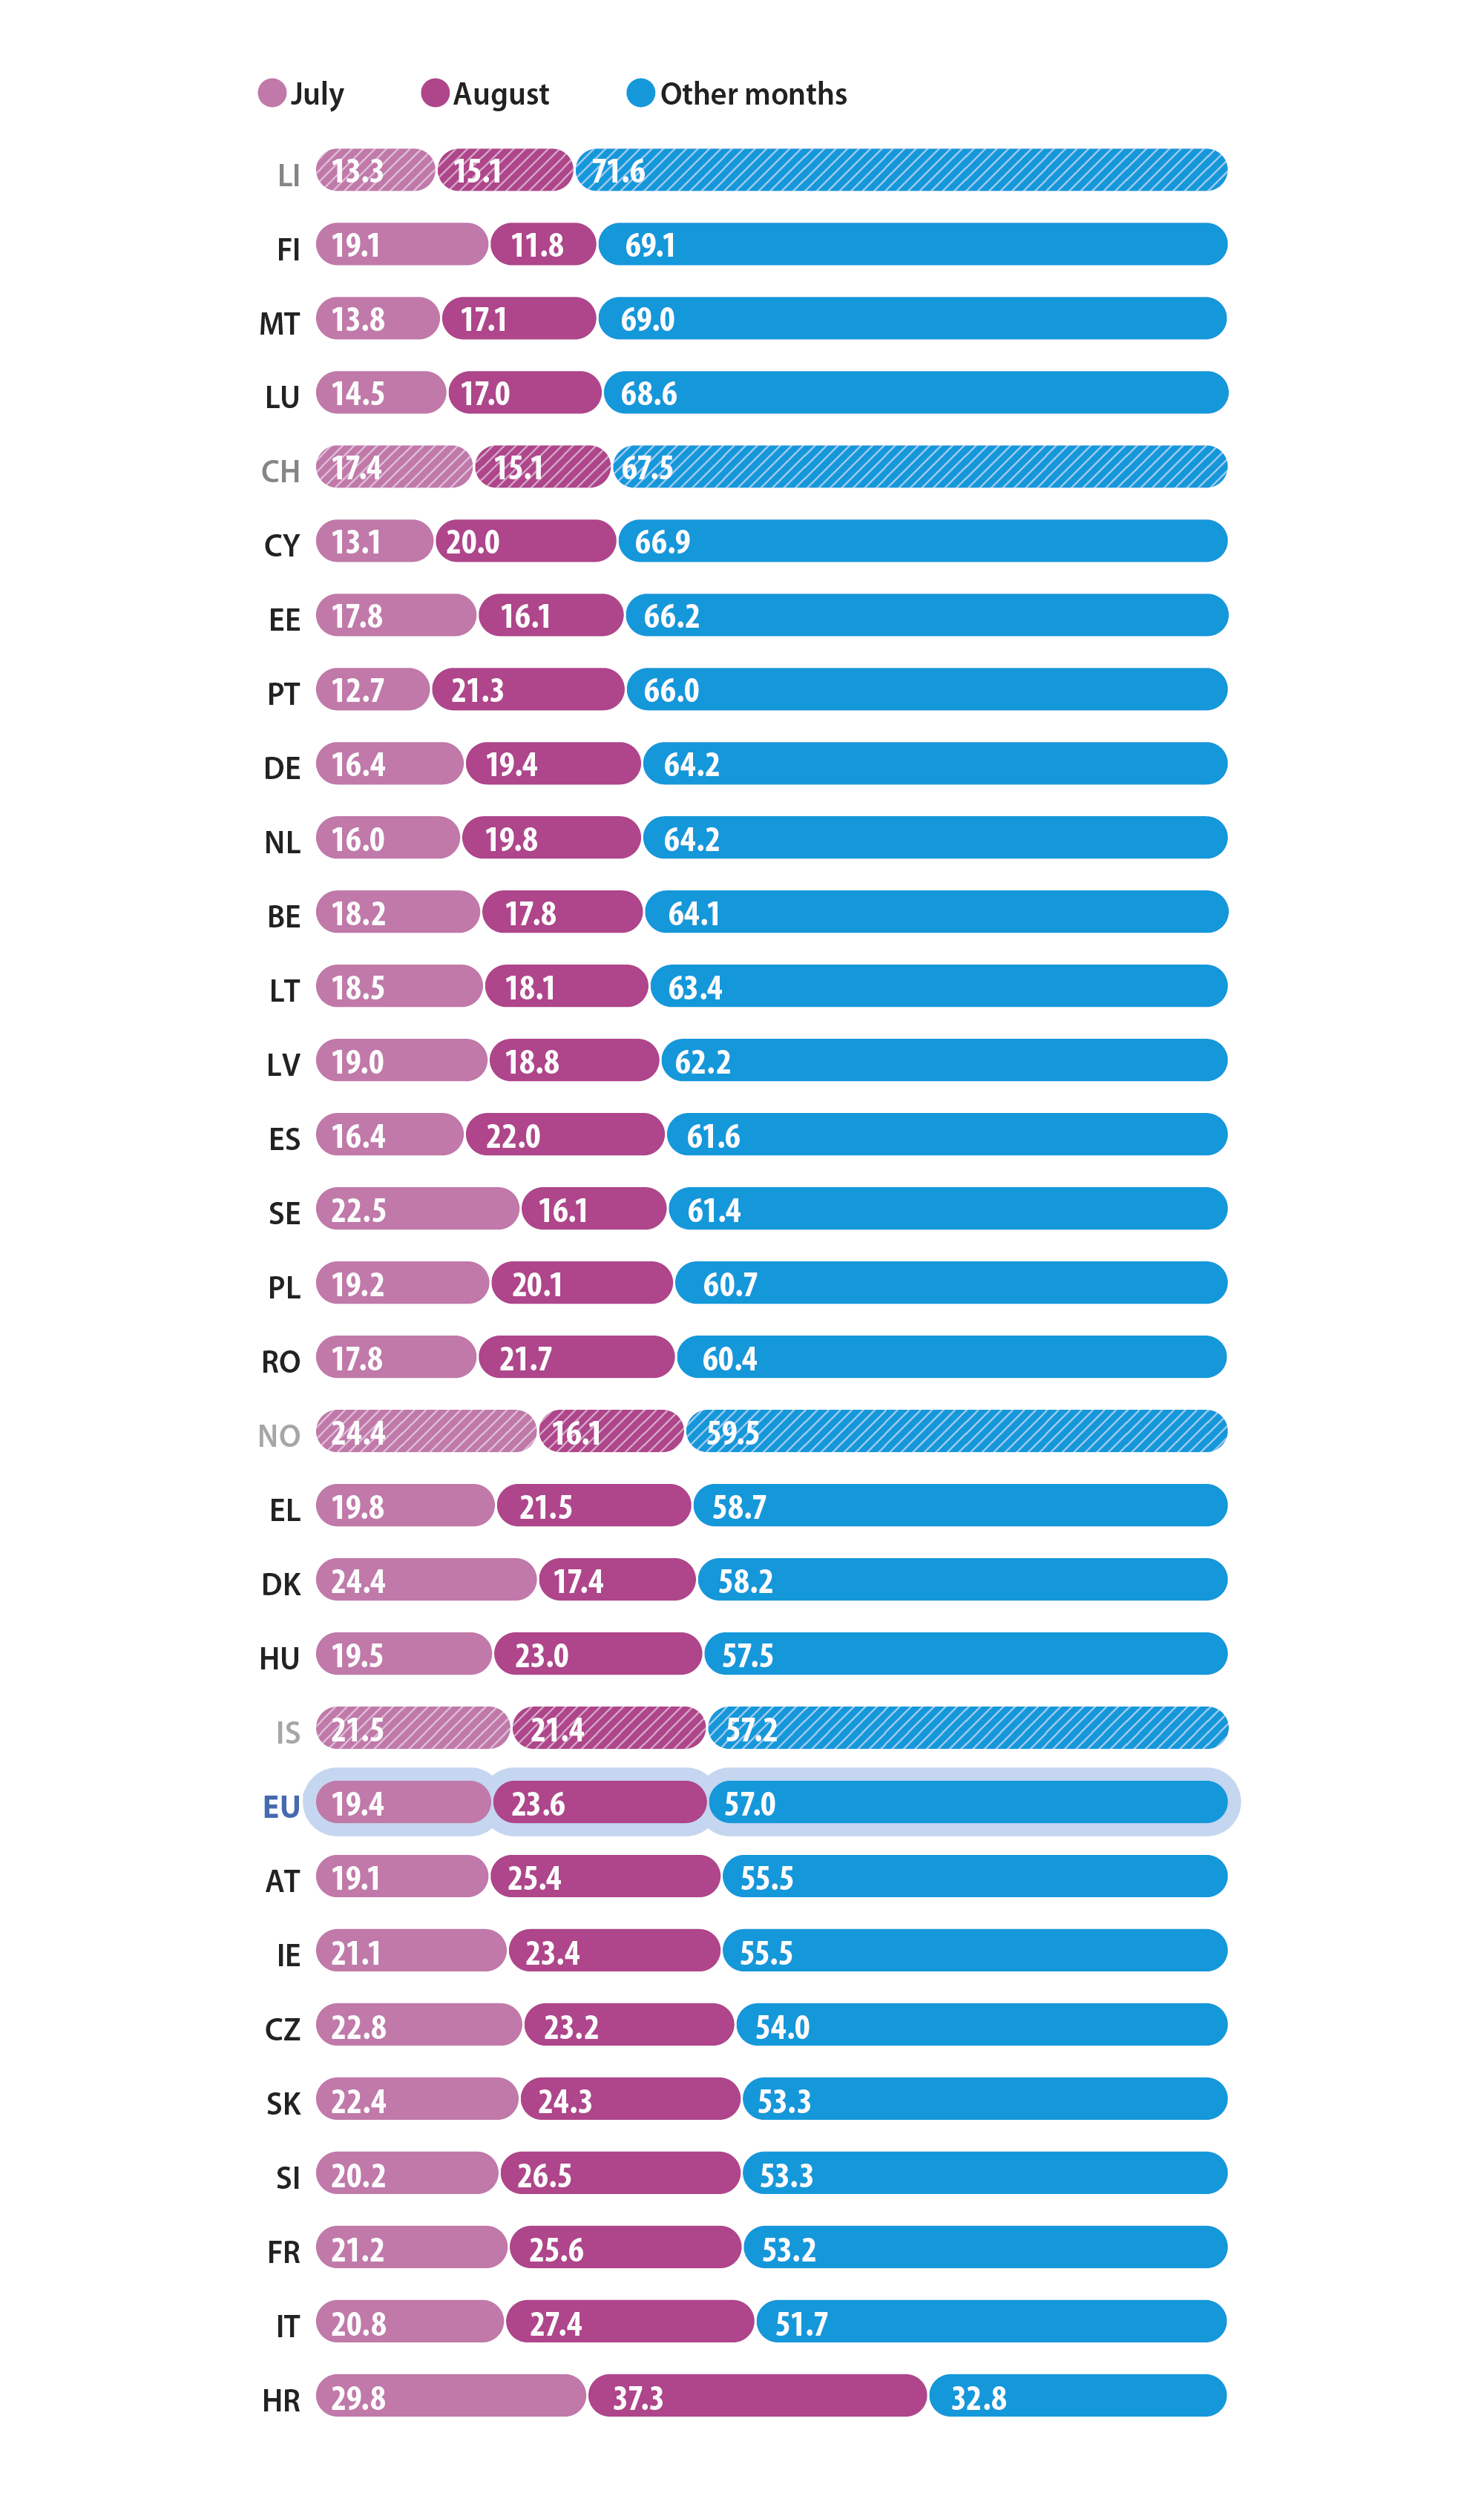
Nights spent in July and August as a share of all months, in percent. Data for the EU and national data for the EU Member States. Monthly data for 2021. Tourist accommodation. Stacked bar chart.

Note: EE, IE, CY, IS and CH, 2020. EL and FR: 2019. BG: not available.

Source: Eurostat (online data code: tour_occ_nim)

Tourism demand (represented here by the number of nights spent in tourist accommodation) in some EU Member States is particularly concentrated in the summer months of July and August. This pattern was particularly notable in Croatia where more than two thirds of all the nights spent in tourist accommodation in 2021 were recorded in these two months. By contrast, while it does have a summer bias, Malta is a year-round destination with demand spread more evenly across the calendar.

Previous section Next theme

Latest developments

Monthly data for 2020 and to a lesser extent 2021 show the impact of the COVID-19 pandemic on tourism. The most recent data for 2022 may be impacted by a wider range of issues, for example early impacts from the Russian military aggression against Ukraine and the related sanctions.

Arrivals in tourist accommodation (million arrivals, EU, January 2019–March 2022)
Arrivals, in million. Data for the EU. Monthly data for January 2019 to March 2022. Tourist accommodation. Line chart.

Source: Eurostat (online data code: tour_occ_arm)

While the number of tourist accommodation arrivals in the EU in January and February 2020 was in line with those for January and February 2019, the pandemic and related measures led to a considerable decrease in March and April 2020. This was followed by a modest increase in the number of arrivals in May, while the number accelerated – but did not fully recover – in the early summer of 2020. Throughout the rest of the summer and into autumn, the developments were similar in 2020 to those in 2019, but with around 39–48 million fewer arrivals each month from July to December 2020 than during the equivalent months in 2019; in relative terms, these lower numbers were equivalent to falls of 29–81 %.

The situation observed in the second half of 2020 continued into the first half of 2021, with 38–63 million fewer arrivals in tourist accommodation in the EU each month from January to June 2021 than during the equivalent months in 2019. Thereafter the number of arrivals increased greatly. Nevertheless, from July to December 2021 there were 12–25 million fewer arrivals each month than during the equivalent months in 2019.

Comparing 2021 directly with 2020 (leaving aside the pre-pandemic months of January and February 2020 and the transition month of March 2020), there were more arrivals in every month of 2021 than the equivalent month of 2020. For example, from May to December 2021, there were at least 19 million more arrivals each month than there were in each equivalent month of 2020. This recovery continued into the first three months of 2022, with more arrivals in January, February and March 2022 than a year earlier.

Arrivals in tourist accommodation (million arrivals, EU, January 2019–March 2022)
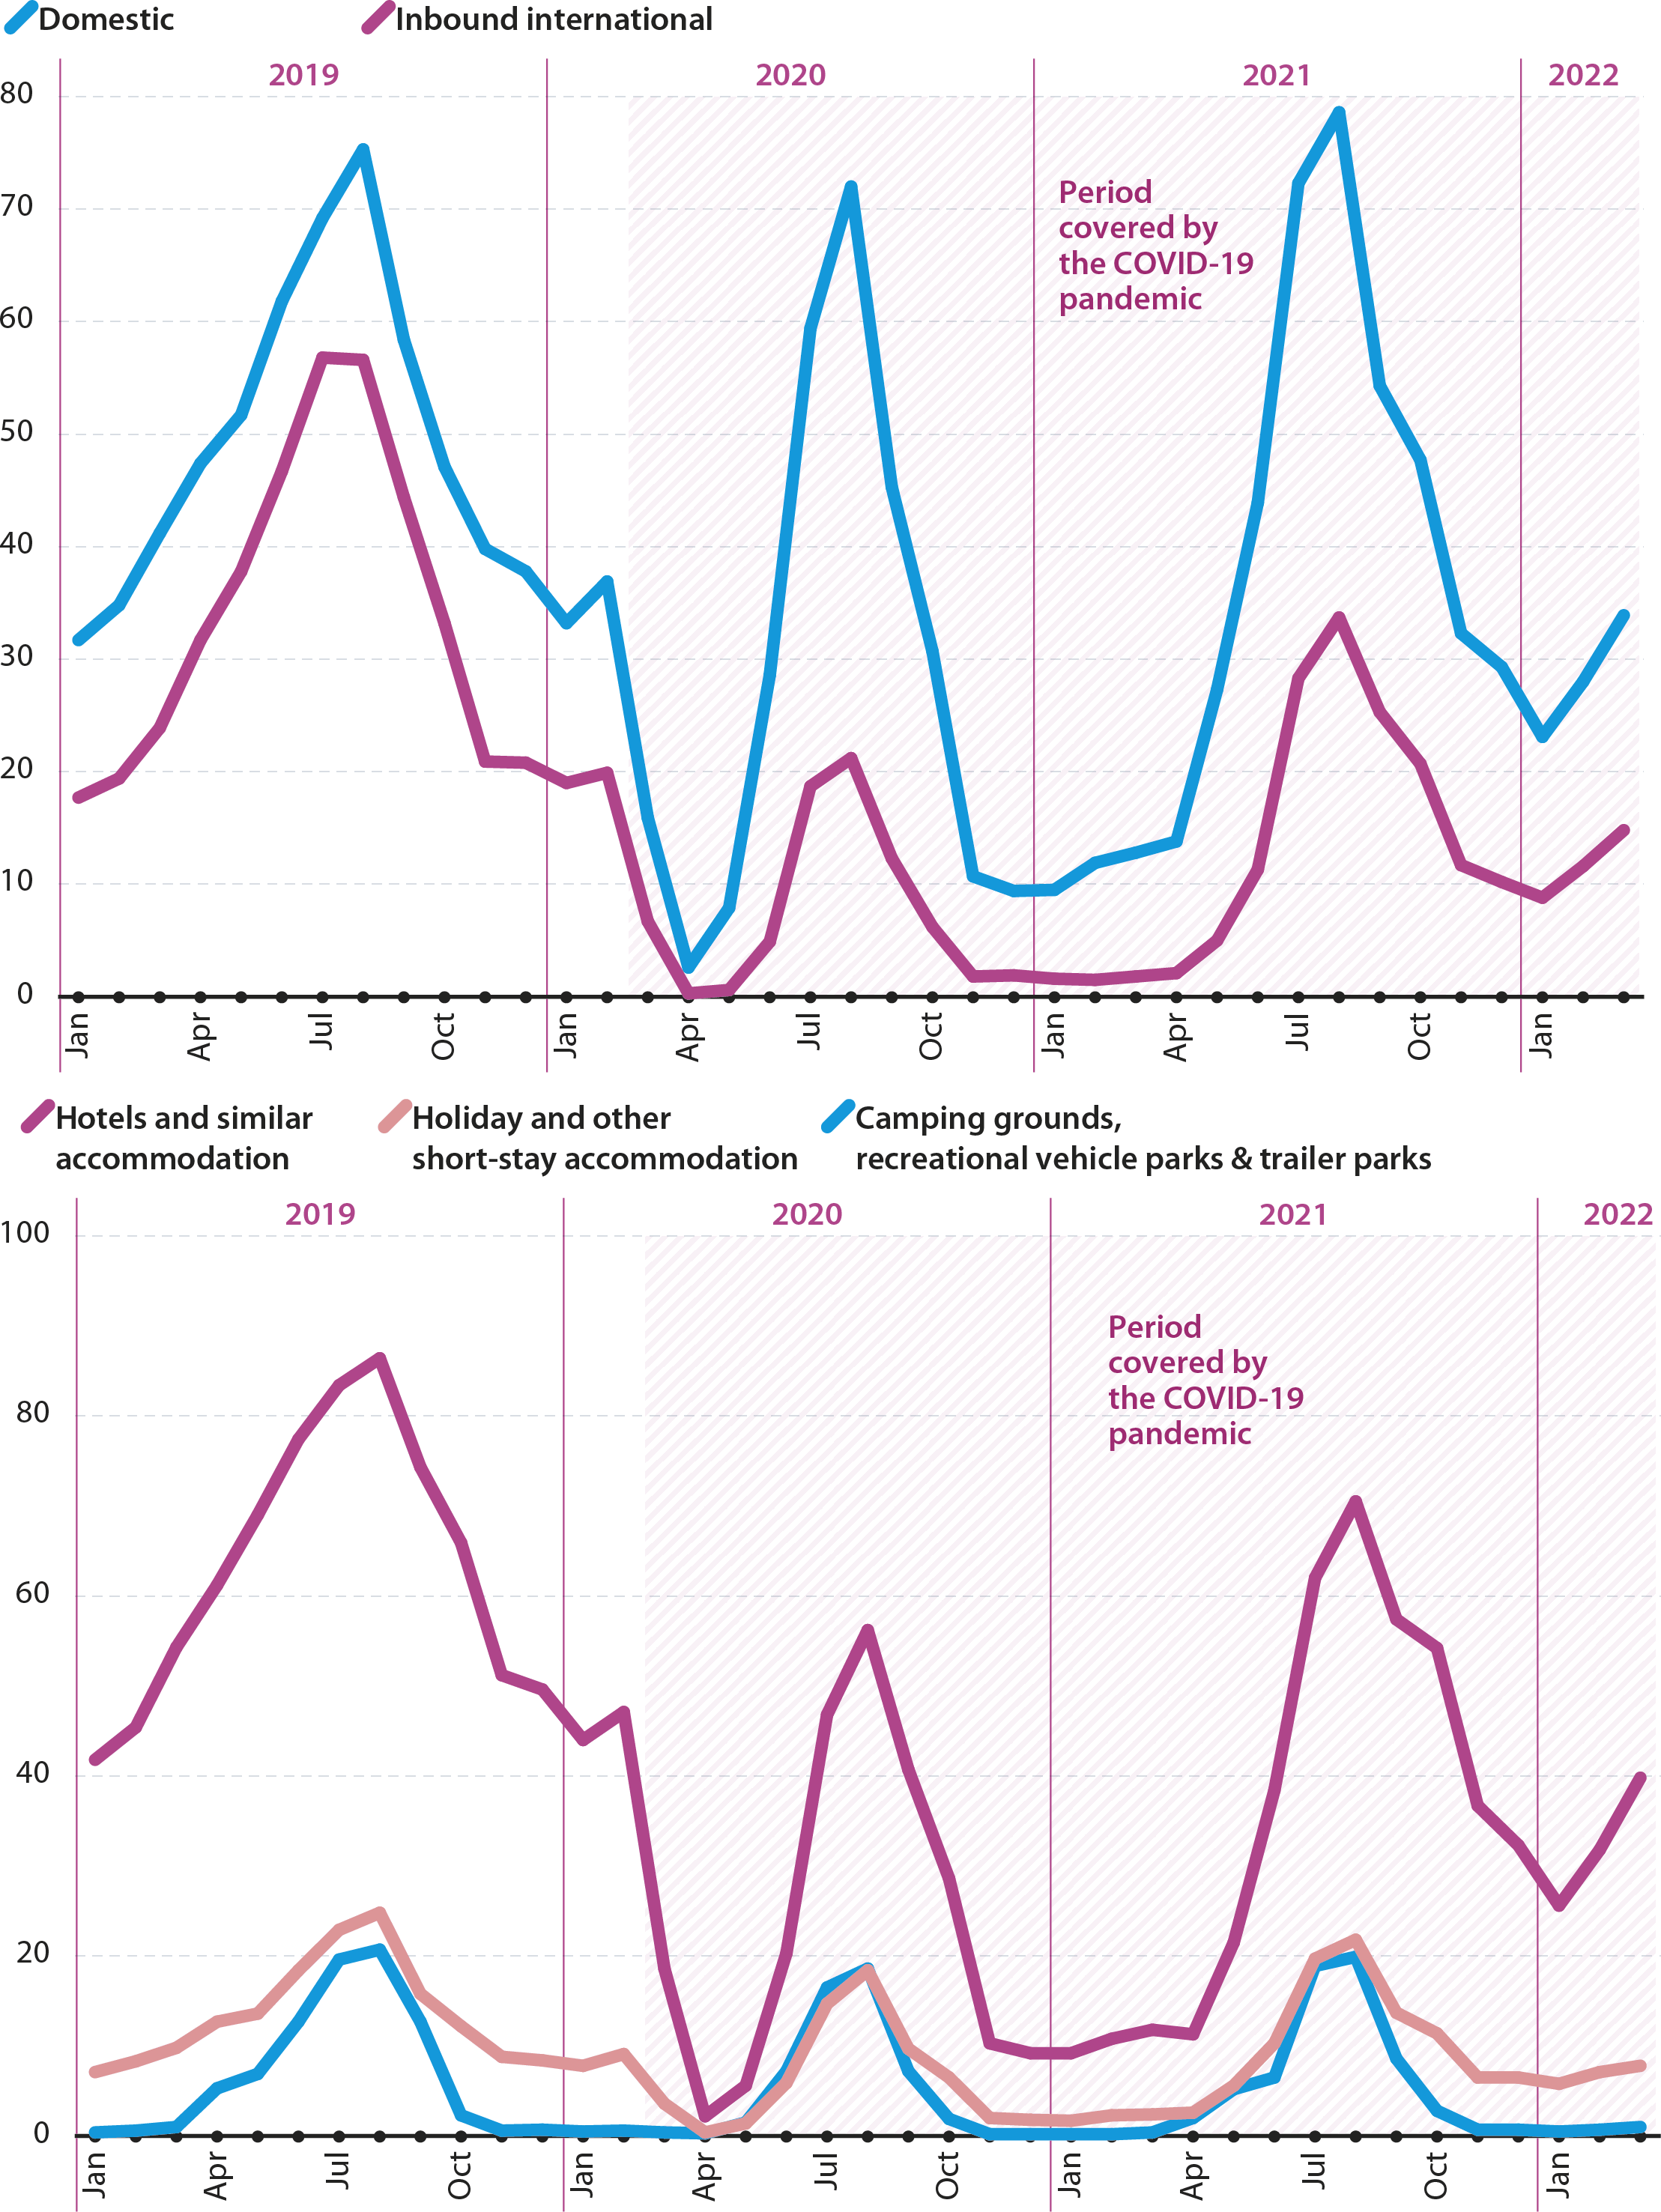
Arrivals, in million. Data for the EU. Monthly data for January 2019 to March 2022. Tourist accommodation. Domestic and imbound international tourists. Line chart.

Source: Eurostat (online data code: tour_occ_arm)

The number of international arrivals at EU tourist accommodation was 88 % lower in March and April 2020 (combined) than a year earlier, while for domestic arrivals there was a fall of 79 %. When studied by type of accommodation, arrivals at hotels and similar accommodation and at holiday and other short-stay accommodation were down 82 % during the same period, with a larger fall (down 90 %) for camping grounds, recreational vehicle parks and trailer parks.

The partial recovery in the number of arrivals at tourist accommodation during the summer of 2020 was largely driven by domestic demand, with many people deciding to stay in their home country for a ‘staycation’ rather than crossing borders for a foreign holiday. Based on a comparison with July and August 2019, domestic arrivals at EU tourist accommodation were down 9 % in July and August 2020, while the decrease for inbound international arrivals was considerably greater, at 65 %. The most affected type of accommodation was hotels and similar accommodation, as the number of arrivals in July and August 2020 was 39 % lower than in the same months of 2019. The number of arrivals in EU holiday and other short-stay accommodation was 31 % lower in July and August 2020 than in July and August 2019, while the smallest impact from the pandemic was felt by camping grounds, recreational vehicle parks and trailer parks (down 13 %).

Comparing the combined July and August figures for 2021 with those for 2020, inbound international arrivals increased 55 % compared with a 15 % increase for domestic arrivals. Concerning the type of accommodation, the largest increases were for hotels and similar accommodation (up 29 %) and holiday and other short-stay accommodation (up 25 %); the increase observed for camping grounds, recreational vehicle parks and trailer parks was 11 %.

Compared with 2019, in other words before the pandemic, the combined July and August figures for 2021 were down 45 % for inbound international arrivals but up 4 % for domestic arrivals. Concerning the type of accommodation, the largest decreases were still for hotels and similar accommodation (down 22 %) and holiday and other short-stay accommodation (down 13 %); the decrease observed for camping grounds, recreational vehicle parks and trailer parks was 4 %.


Previous section Next theme
Go to the top of the page