Structure
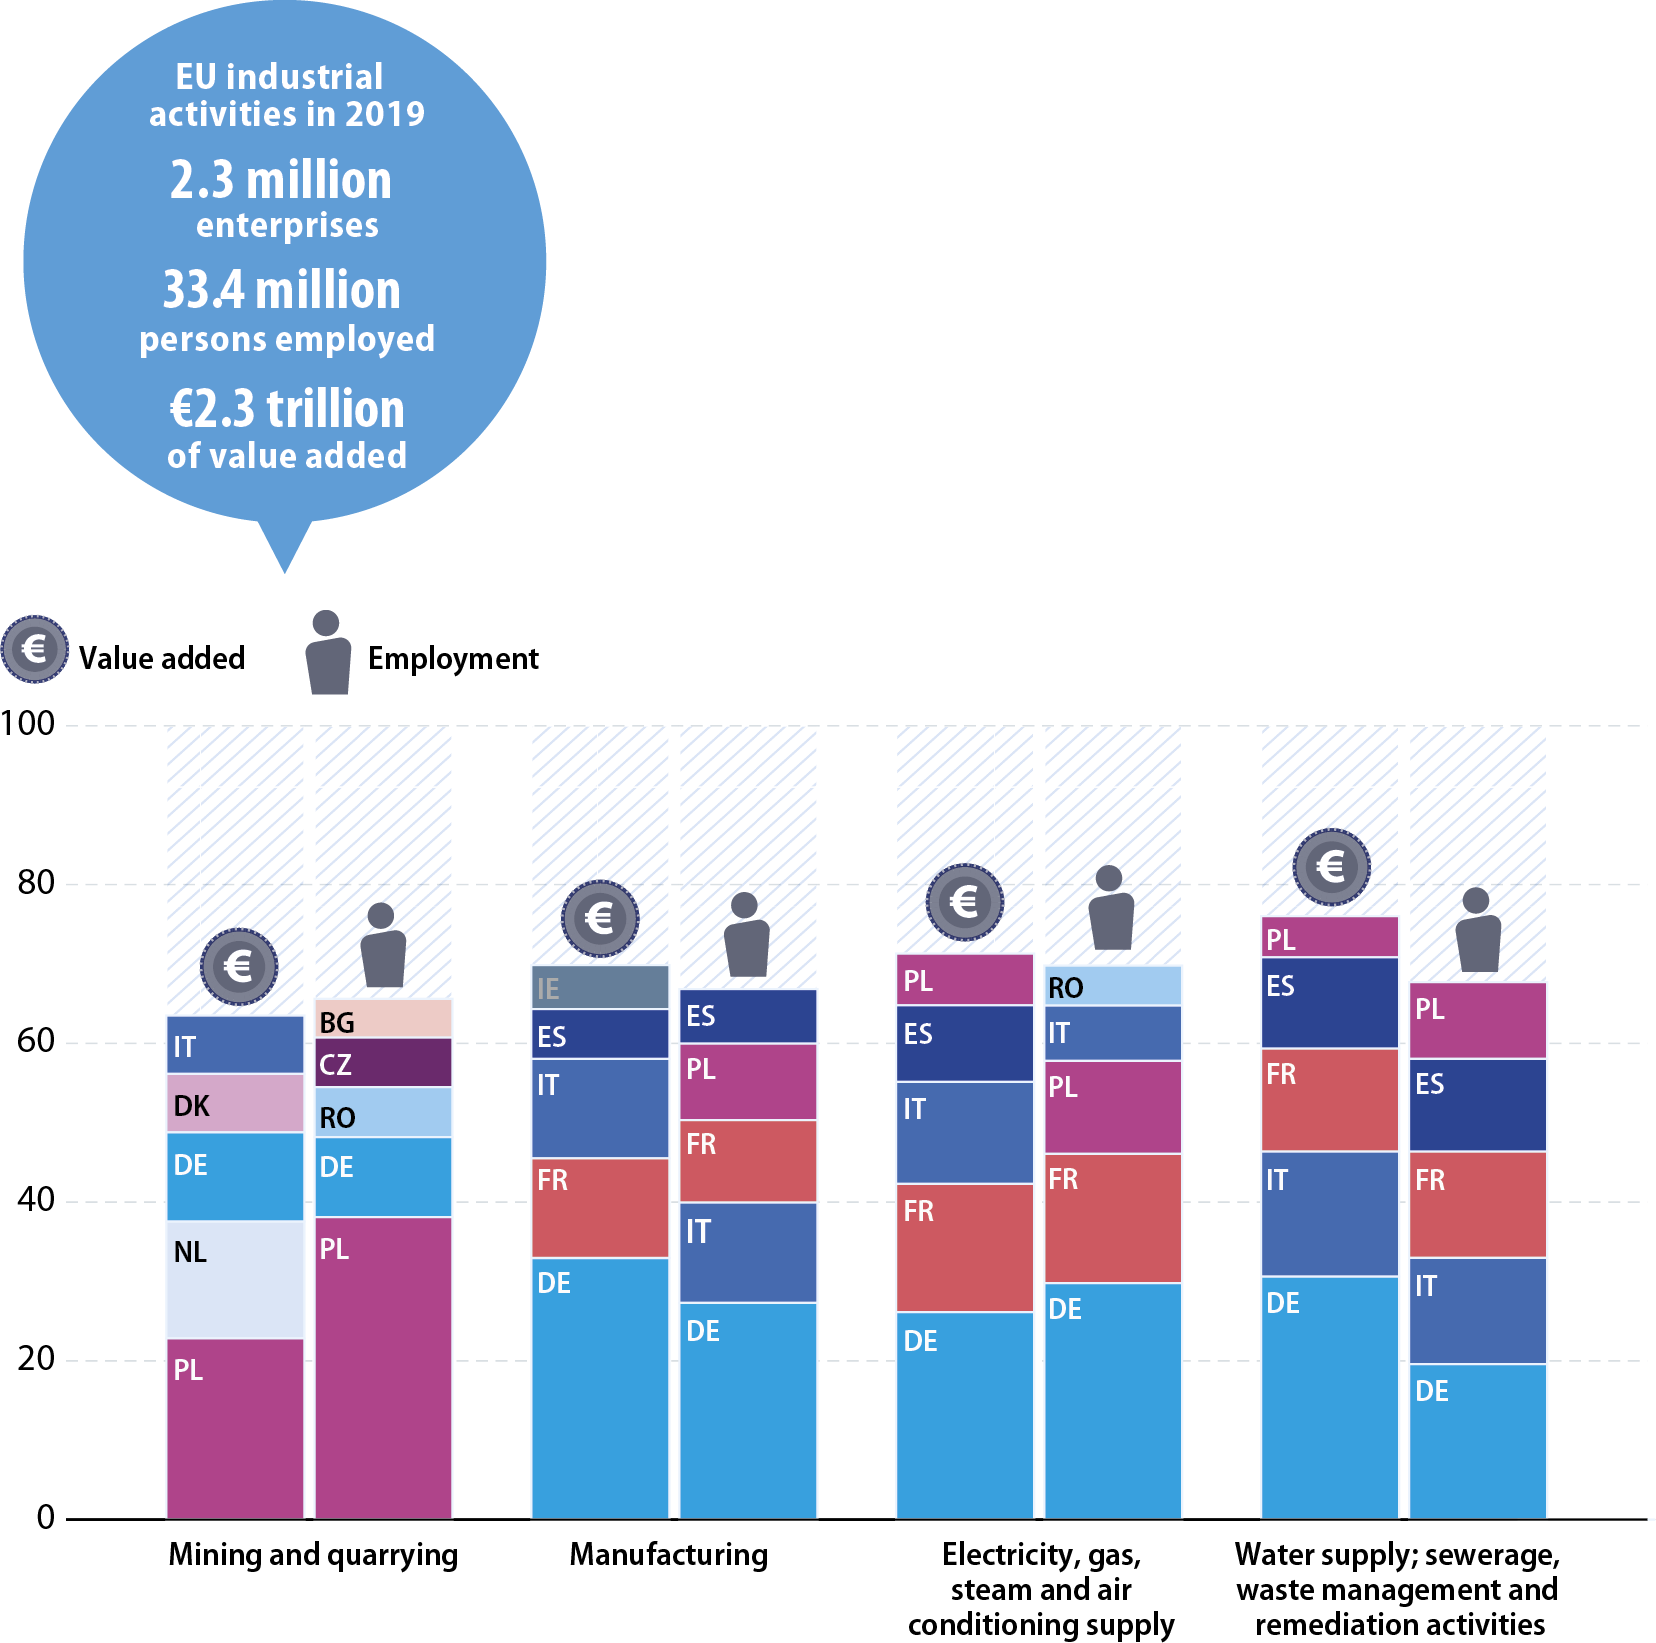
The EU’s industrial economy is covered by four activities: mining and quarrying; manufacturing; electricity, gas, steam and air conditioning supply; and water supply, sewerage, waste management and remediation activities. Manufacturing was by far the largest of these four activities: in 2019, it accounted for more than four fifths (84.7 %) of industrial value added in the EU and for an even higher share of industrial employment (90.3 %).
Note: electricity, gas, steam and air conditioning supply, MT: not available.
Source: Eurostat (online data code: sbs_na_ind_r2)
In 2019, Germany had the highest share of EU value added for the manufacturing sector (33.0 %), for water supply, sewerage, waste management and remediation activities (30.6 %) and for electricity, gas, steam and air conditioning supply (26.2 %). By contrast, Poland contributed the largest share of value added to the EU’s mining and quarrying sector (22.8 %), followed by the Netherlands (14.7 %).
Germany also recorded the highest shares of EU employment for the same three industrial activities as noted above, with shares of 27.3 %, 19.6 % and 29.8 % respectively. Poland had the largest employment share within the EU’s mining and quarrying sector, at 38.1 %.
Value added specialisation – top five EU Member States (%, share of industrial value added, 2019)
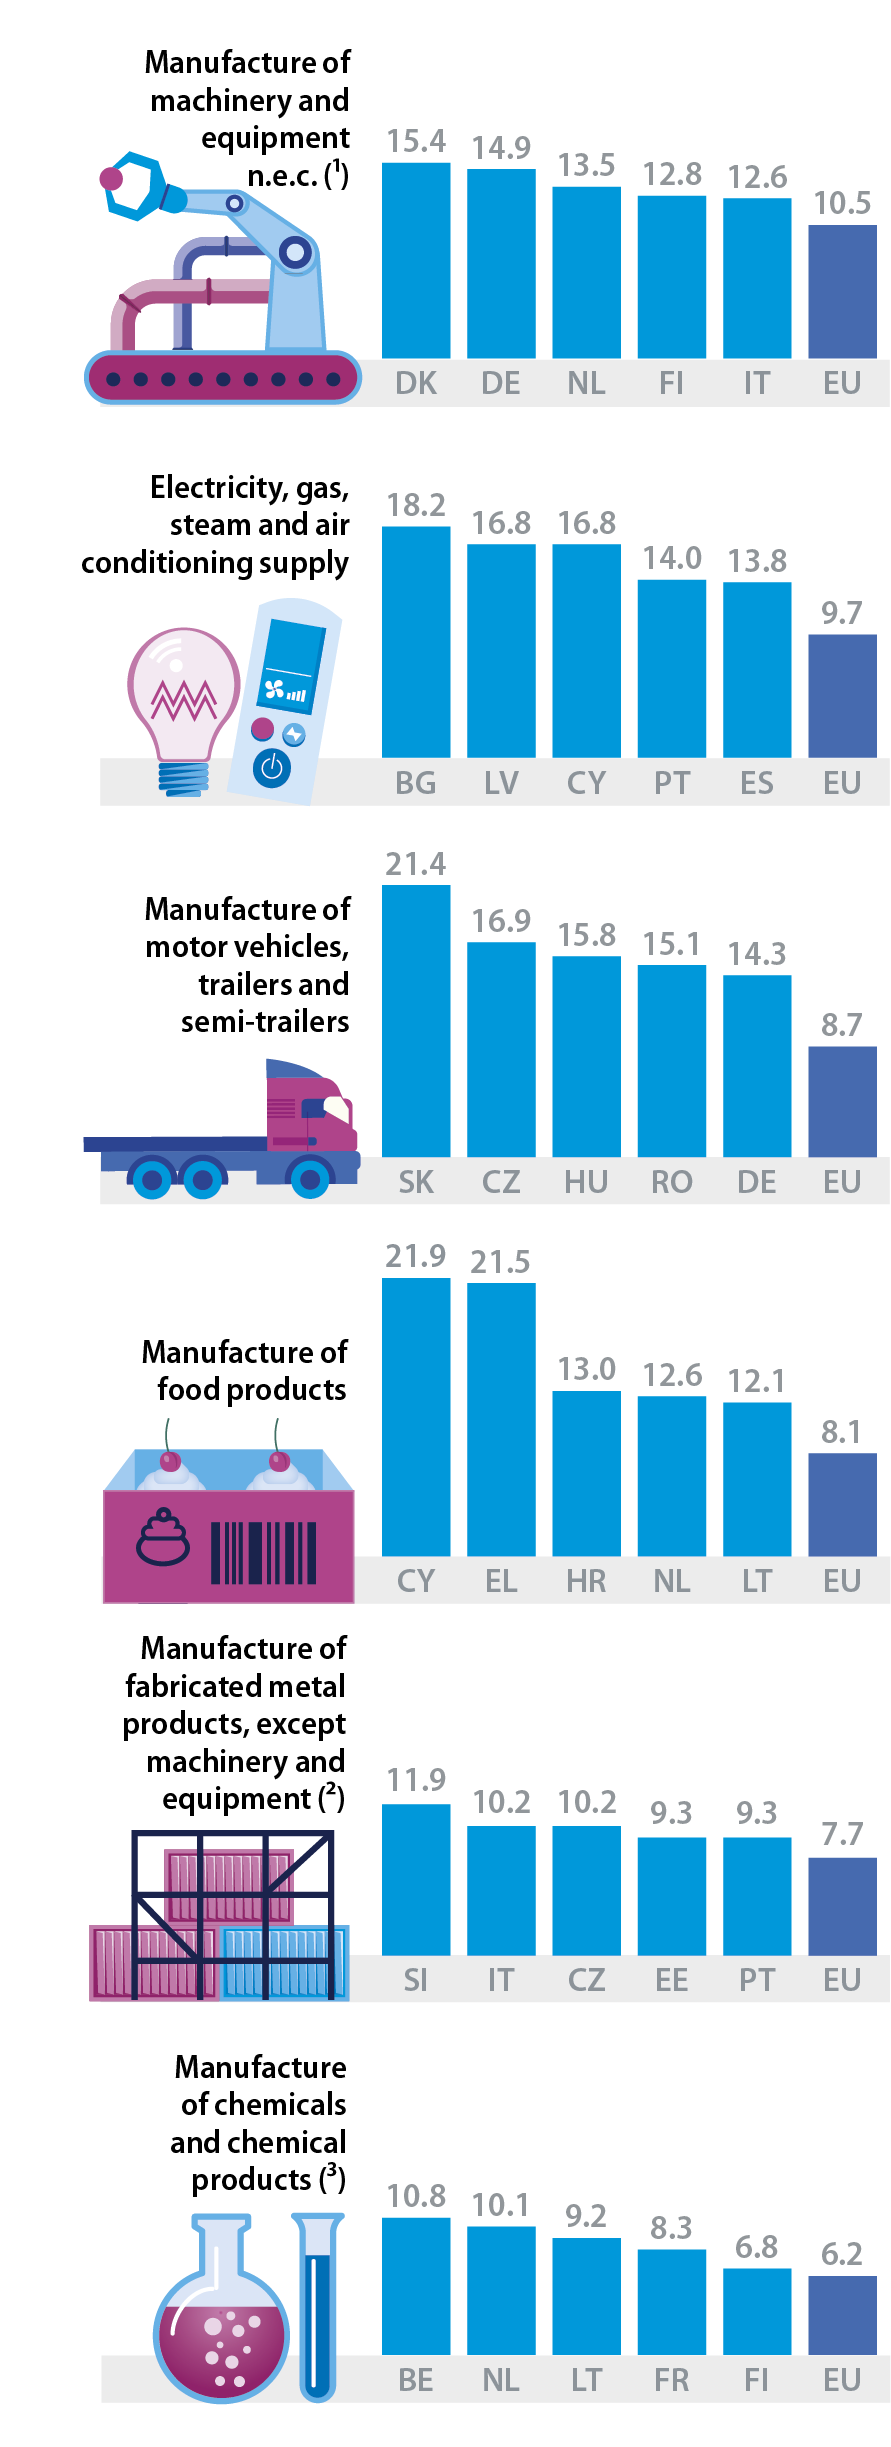
In 2019, measured by value added the six largest activities (based on NACE Rev 2 divisions) within the EU’s industrial economy were: the manufacture of machinery and equipment not elsewhere classified (10.5 % of industrial value added); electricity, gas, steam and air conditioning supply (9.7 %); the manufacture of motor vehicles, trailers and semi-trailers (8.7 %); the manufacture of food products (8.1 %); the manufacture of fabricated metal products, except machinery and equipment (7.7 %); and the manufacture of chemicals and chemical products (6.2 %).
Among the EU Member States, Denmark had the highest share of its industrial value added within the manufacture of machinery and equipment (15.4 %), followed by Germany with a 14.9 % share. For electricity, gas, steam and air conditioning, Bulgaria (18.2 %) had the highest proportion, while for the manufacture of motor vehicles, trailers and semi-trailers, the highest share was recorded in Slovakia (21.4 %).
In Cyprus, the manufacture of food products accounted for 21.9 % of industrial value added in 2019, just ahead of the 21.5 % share observed in Greece. In Slovenia, the manufacture of fabricated metal products except machinery and equipment accounted for 11.9 % of industrial value added. Belgium had the highest degree of relative specialisation across the EU Member States for the manufacture of chemicals and chemical products, with 10.8 % of its industrial value added being generated in this subsector, ahead of the Netherlands where a 10.1 % share was observed.
Note: data are shown for the six largest activities based on EU value added for NACE Rev. 2 industrial divisions. MT: not available. (¹) EU: excluding IE. IE: not available. (²) EU: excluding PL. PL: not available. (³) IE and PL: not available.
Source: Eurostat (online data code: sbs_na_ind_r2)
Note: IS, 2018. Mining and quarrying: CY: not available. Electricity, gas, steam and air conditioning supply: CY and MT: not available. Water supply; sewerage, waste management and remediation activities: MT: not available.
Source: Eurostat (online data code: sbs_na_ind_r2)
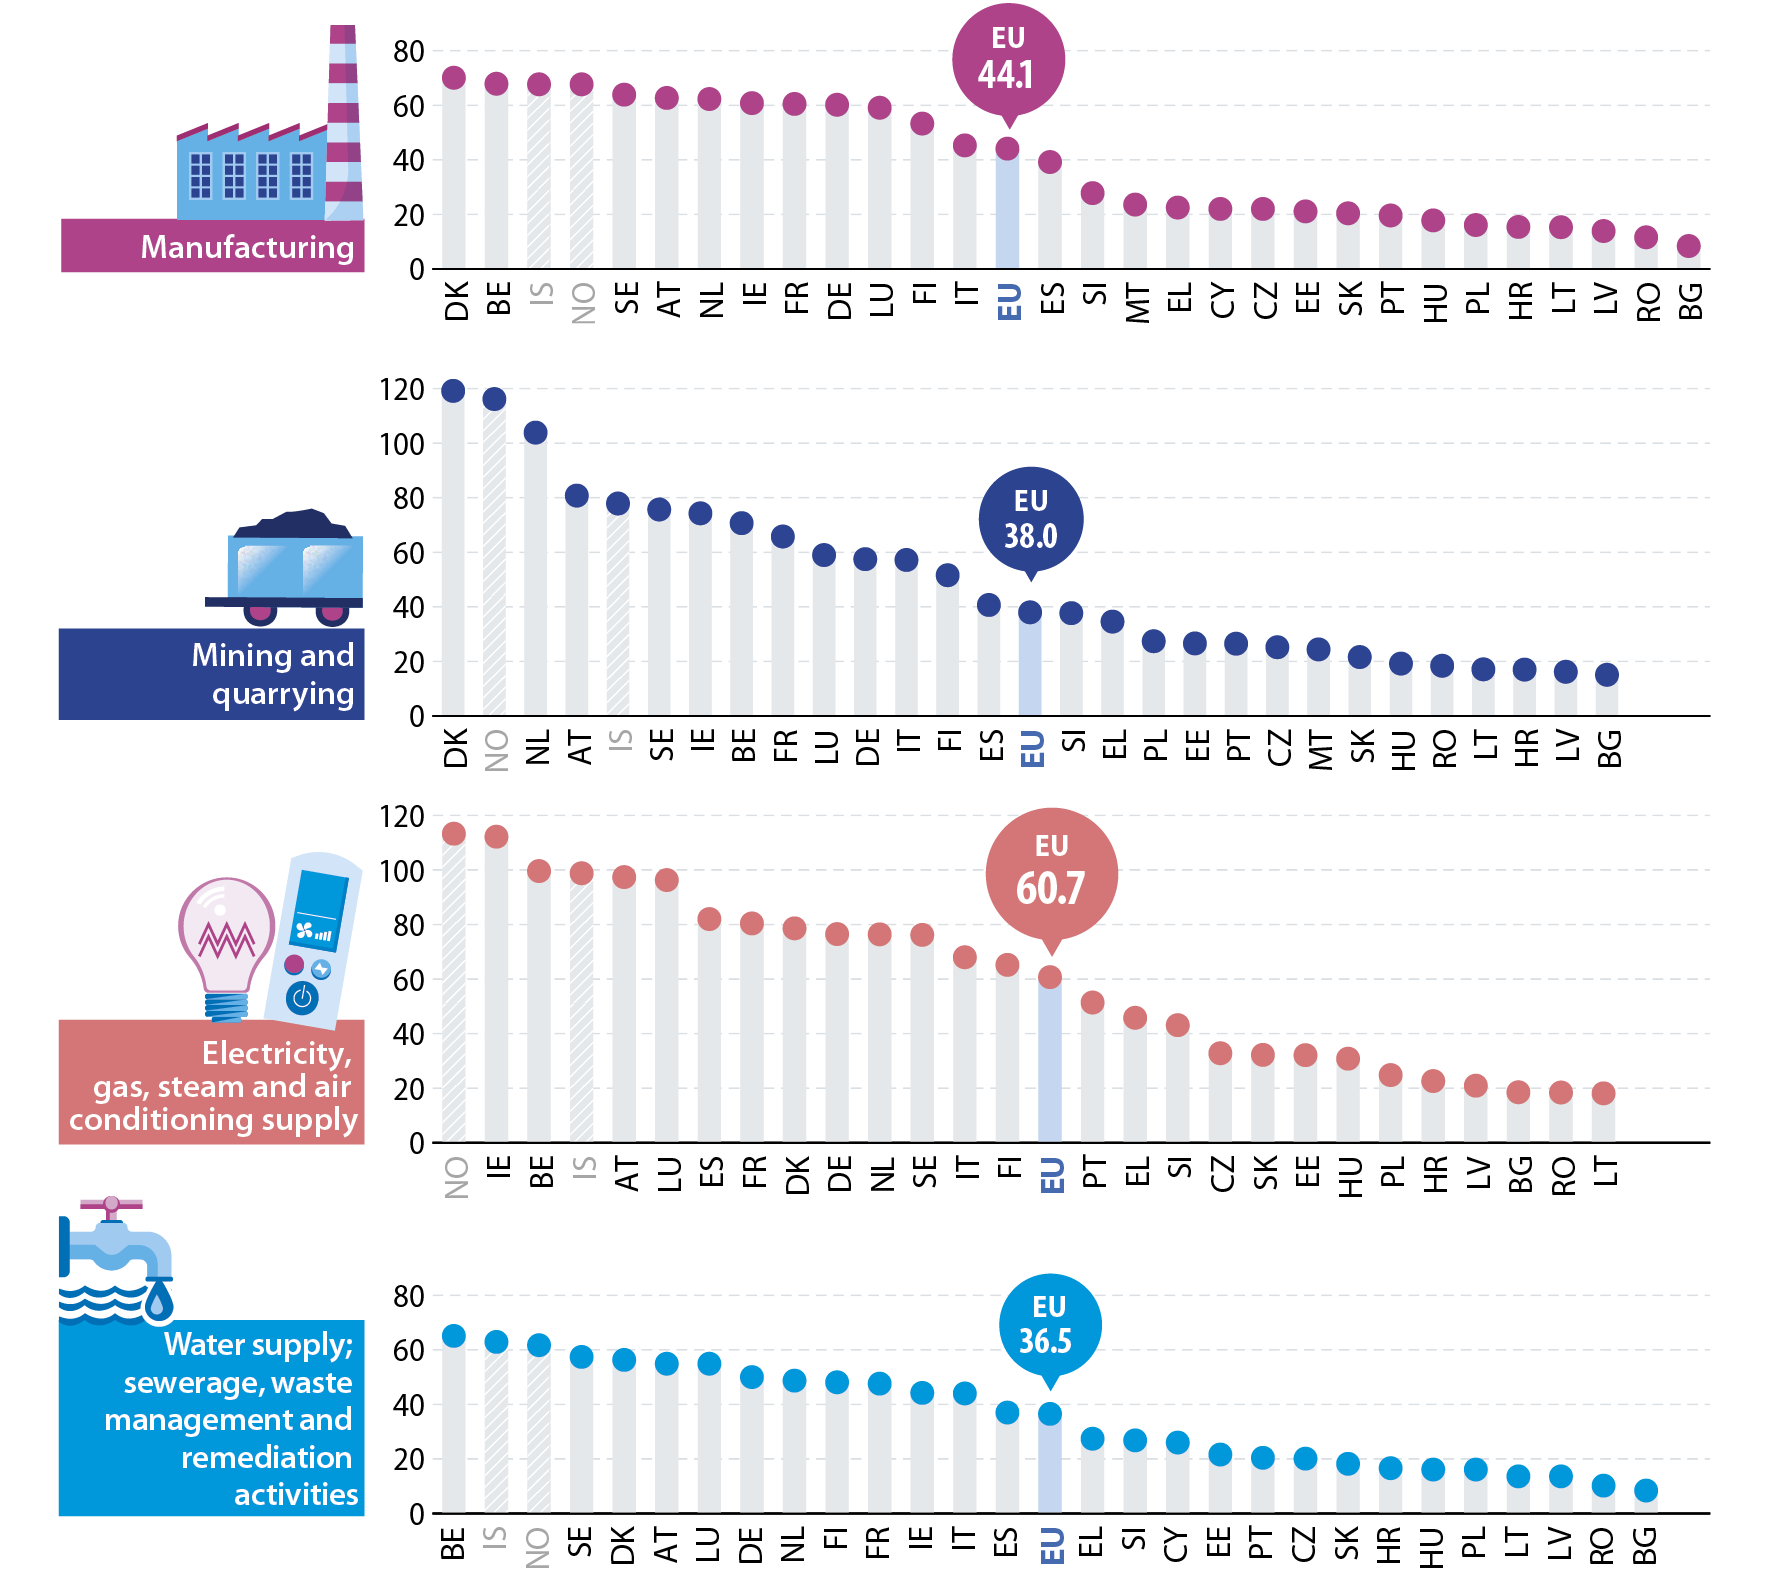
In 2019, average personnel costs across the four sections within the EU’s industrial economy ranged from a high of €60 700 per employee for electricity, gas, steam and air conditioning supply down to €36 500 per employee for water supply, sewerage, waste management and remediation activities.
In the vast majority of EU Member States, the highest average personnel costs across industrial activities were registered for electricity, gas, steam and air conditioning supply. The only exceptions in 2019 were Denmark, the Netherlands and Poland (incomplete data for Cyprus and Malta): in all three cases, average personnel costs were higher for mining and quarrying. By contrast, the lowest average personnel costs were often recorded for water supply, sewerage, waste management and remediation activities; Estonia, Greece, Croatia and Portugal were exceptions, as average personnel costs were lower in manufacturing.