Structure
Other non-financial services include seven activities: transportation and storage; accommodation and food services; information and communication services; real estate activities; professional, scientific and technical services; administrative and support services; repair of computers and personal and household goods. In value added terms, the largest of these activities in the EU in 2019 was professional, scientific and technical activities, with a 22.5 % share of the total.
Source: EEurostat (online data code: sbs_na_1a_se_r2)
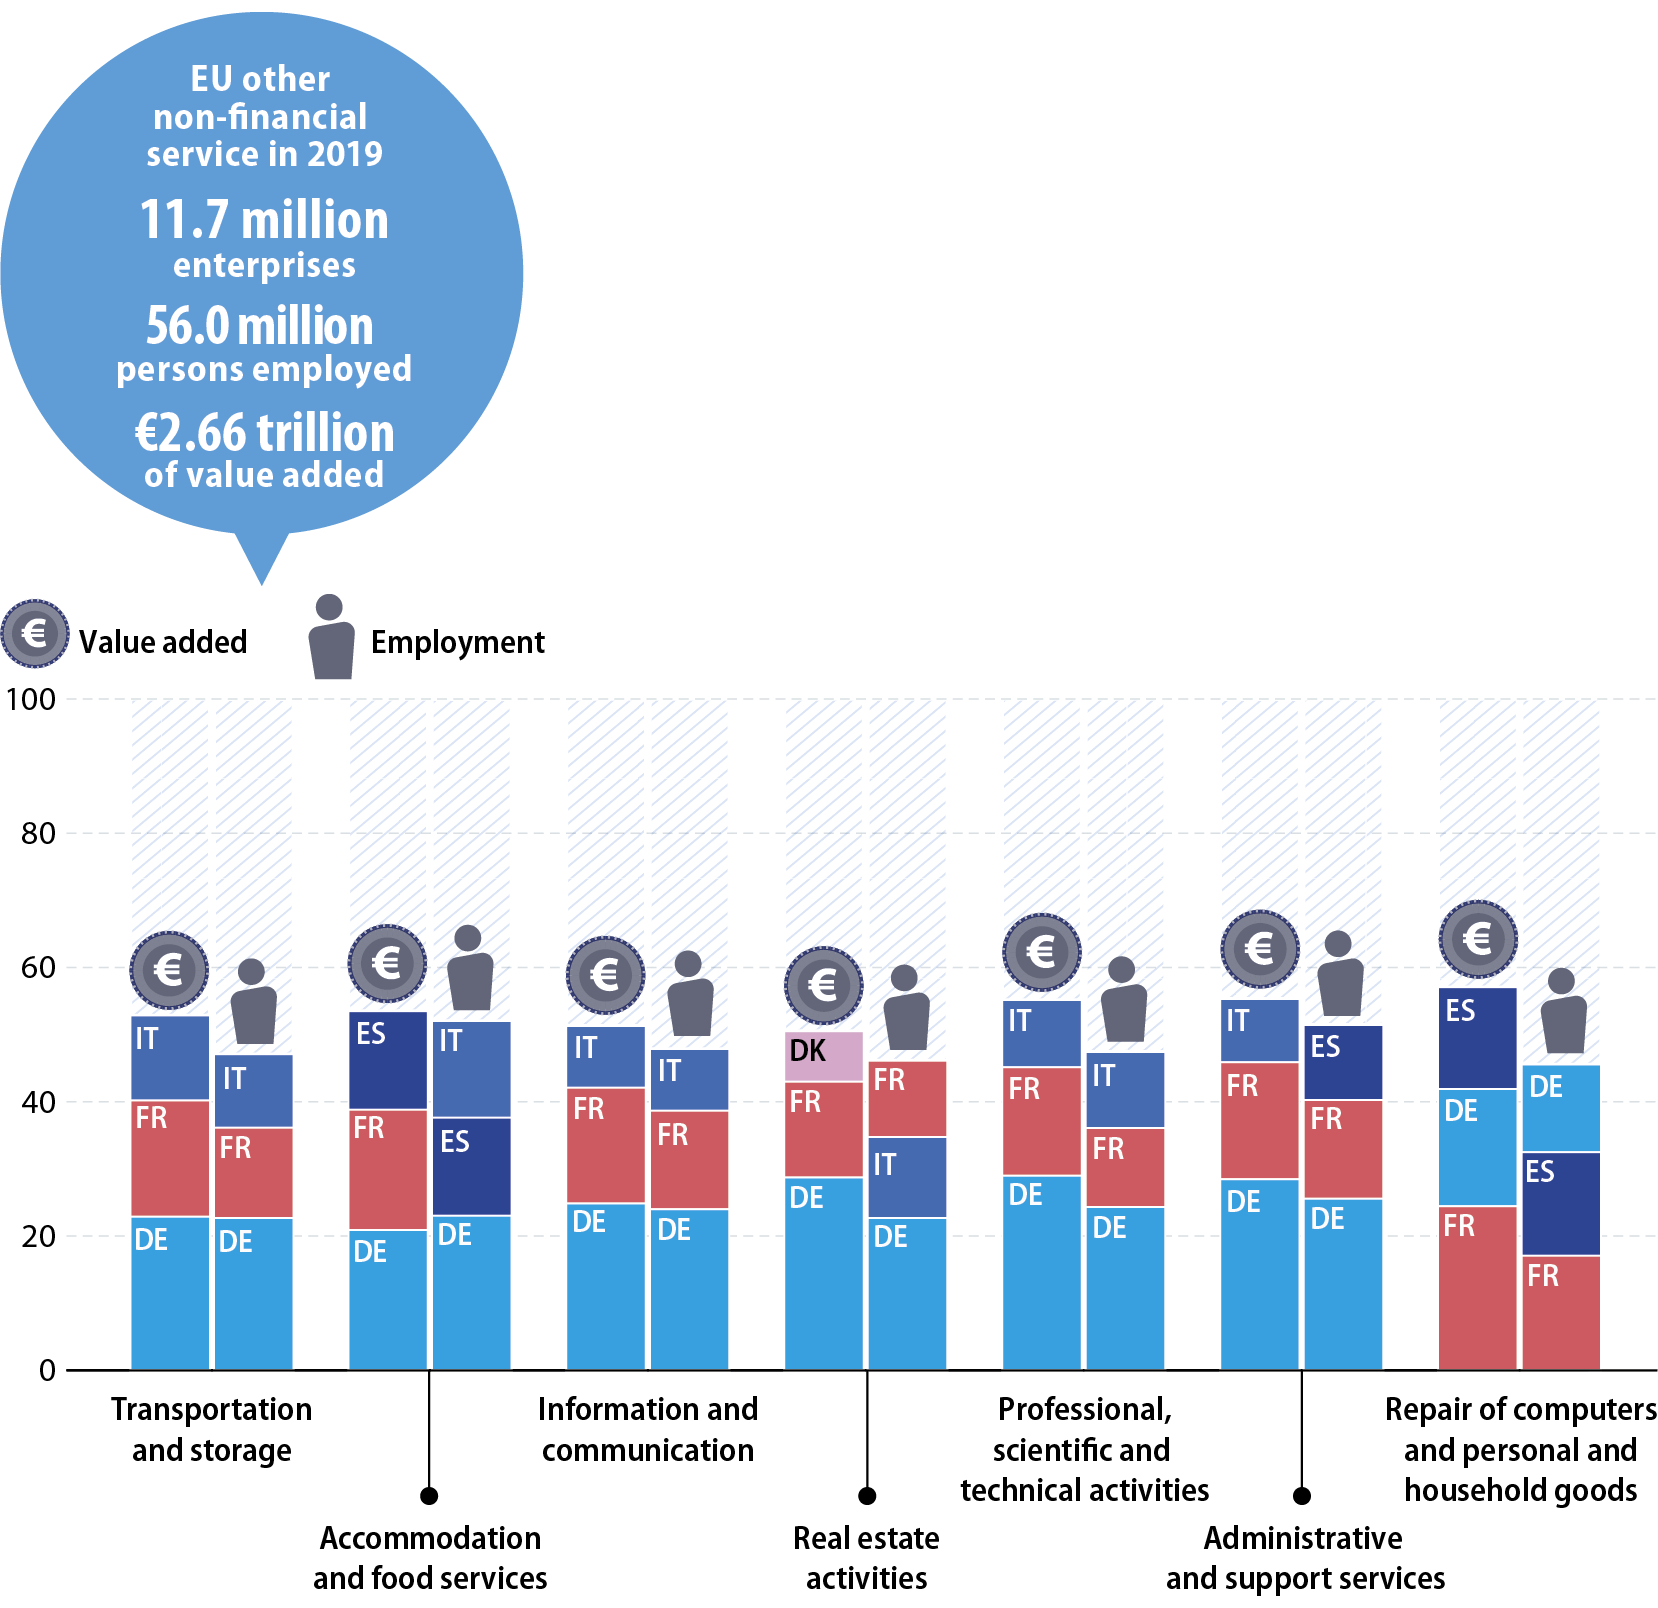
In 2019, Germany had the highest share of EU value added for six out of the seven subsectors included within other non-financial services aggregate and was (for each of these) followed by France. The order of these two EU Member States was reversed for the relatively small activity of repair of computers and personal and household goods: France had the largest share ahead of Germany the second largest. For most of the seven subsectors, Italy or Spain had the third highest value added. The exception was real estate activities as Denmark’s share was third highest.
In terms of employment, Germany had the highest share for the same six subsectors. For four of these France recorded the second highest share; Spain had the second largest workforce for accommodation and food services; Italy had the second largest workforce for real estate activities. As for value added, in employment terms France had the largest share of the repair of computers and personal and household goods, followed by Spain.
Value added specialisation – top five EU Member States (% share of other non-financial services value added, 2019)
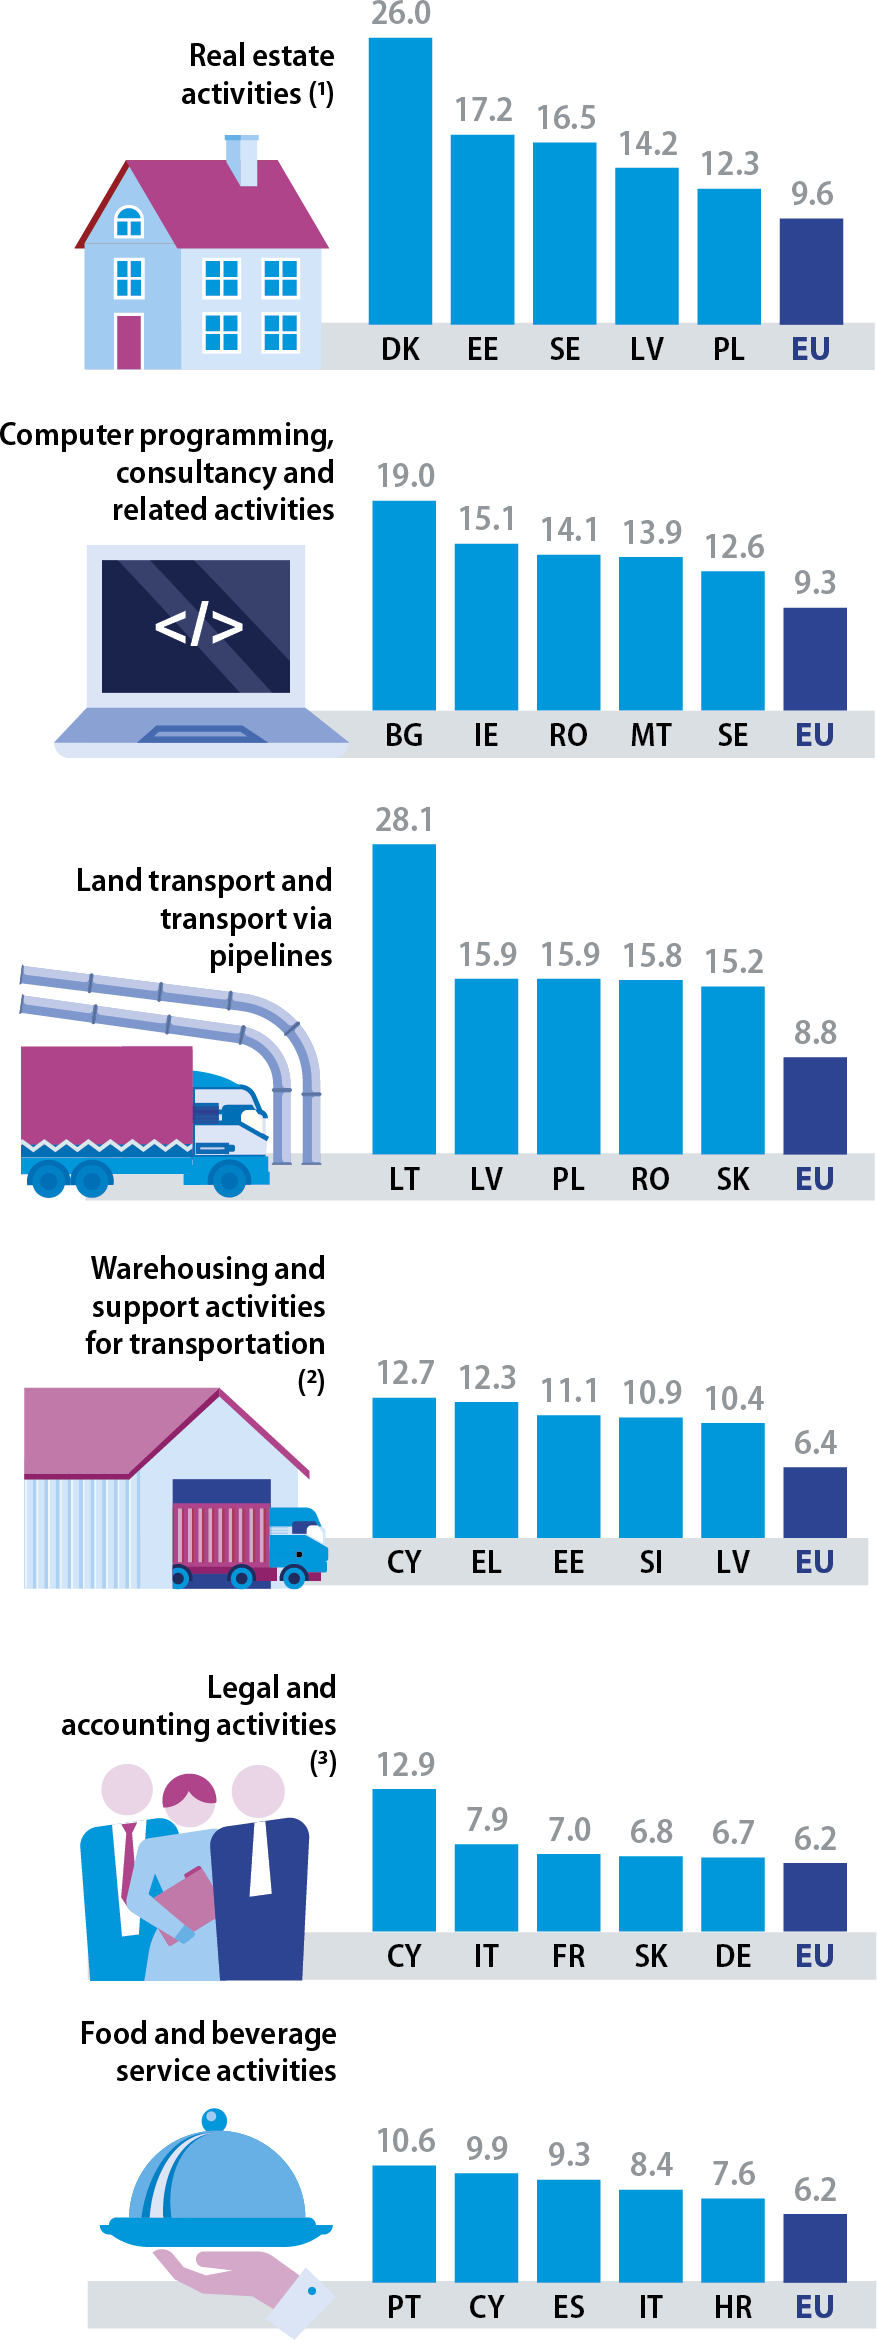
In value added terms, the largest other non-financial service divisions in the EU in 2019 were: real estate activities; computer programming, consultancy and related activities; land transport and transport via pipelines; warehousing and support activities for transportation; legal and accounting activities; and food and beverage services.
Denmark was highly specialised in real estate activities, adding 26.0 % of its non-financial services value added in this activity. Bulgaria and Ireland were the most specialised in computer programming, consultancy and related activities. By far the most specialised EU Member State in land transport and transport via pipelines was Lithuania, as 28.1 % of its value added in other non-financial services in 2019 was recorded in this subsector; for comparison, the EU average was 8.8 %.
Cyprus and Greece were the most specialised EU Member States in warehousing and support activities for transportation, as more than 12.0 % of their value added in non-financial services in 2019 was in this subsector, around double the EU average (6.4 %). The most specialised Member State in legal and accounting activities was also Cyprus, recording 12.9 % of its value added in non-financial services in this subsector, more than double the EU average (6.2 %). There was less specialisation in food and beverage service activities: the highest share was 10.6 % in Portugal, compared with the EU average of 6.2 %.
Note: data are shown for the six largest other non-financial services based on EU value added for NACE Rev.2 other non-financial service divisions. (¹) FI: not available. (²) LU: not available. (³) EU: excluding LU. LU: not available.
Source: Eurostat (online data code: sbs_na_1a_se_r2)
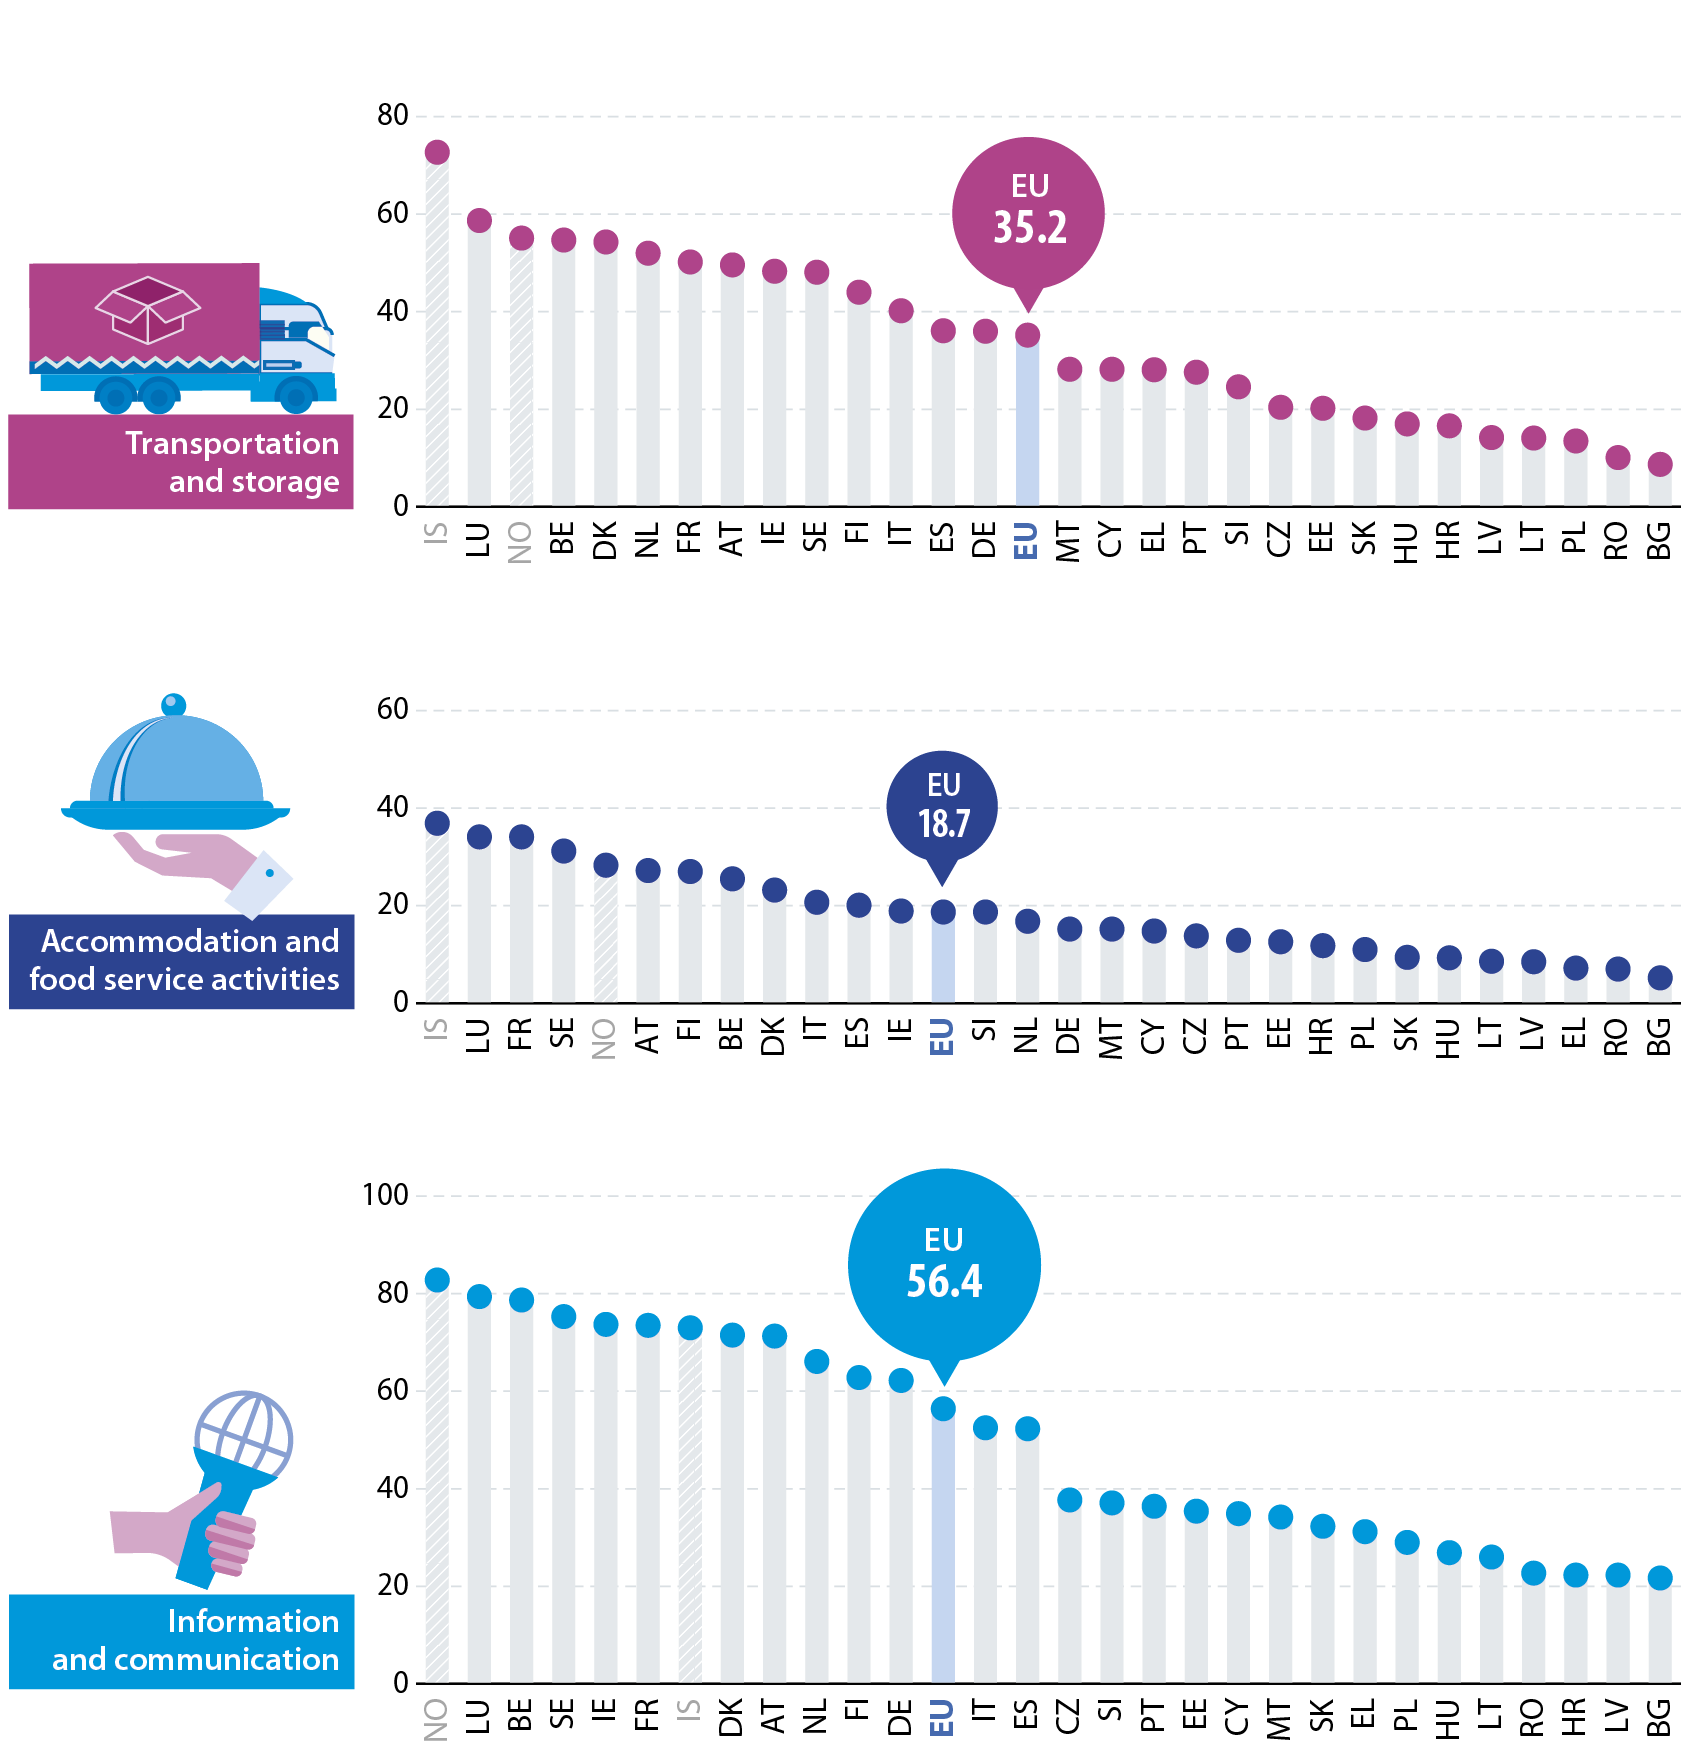
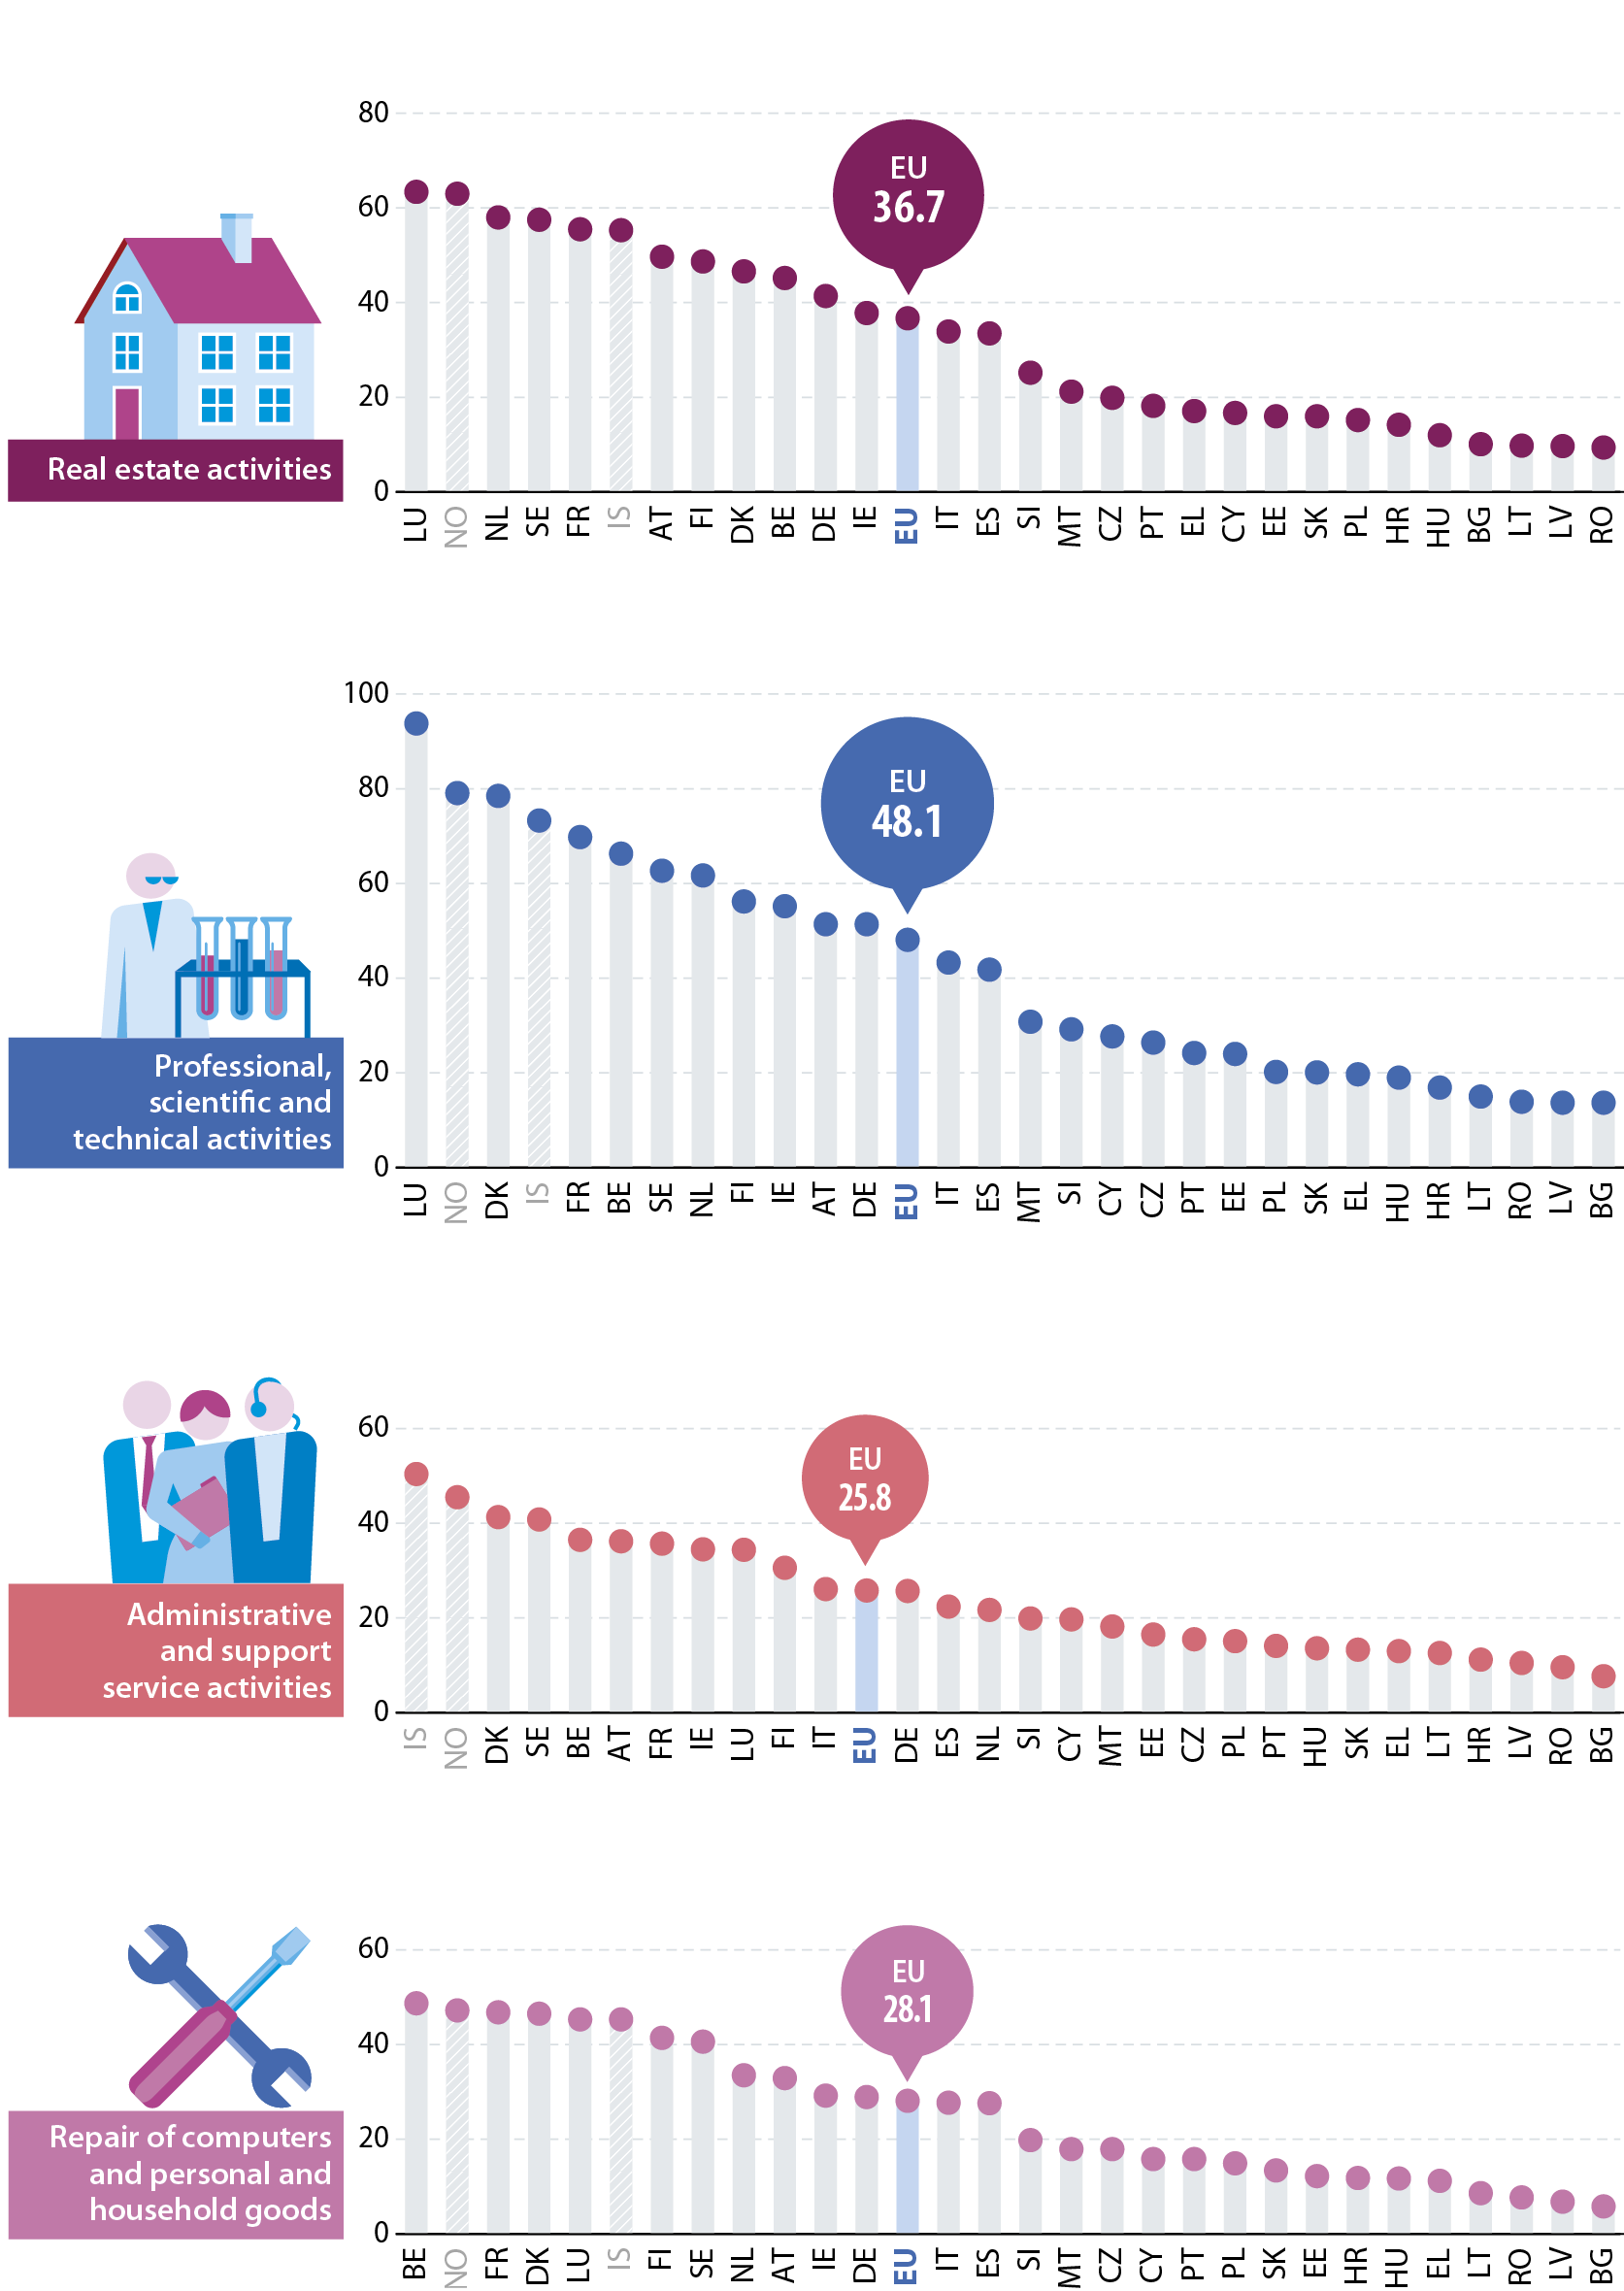
Note: IS, 2018.
Source: Eurostat (online data code: sbs_na_1a_se_r2)
Typically, the lowest average personnel costs across the EU can be observed in activities with a high incidence of part-time and seasonal work, such as accommodation and food services (€18 700 per employee) or administrative and support service activities (€25 800 per employee), whereas higher ratios can be seen for professional, scientific and technical activities (€48 100 per employee) or information and communication services (€56 400 per employee).