Business dynamics Download chapter 1 of Key figures on European business in PDF format

Previous theme Next section

Size of businesses

Business statistics cover industry, construction, distributive trades and most other services. It is important to underline that they exclude a range of economic activities, such as: agriculture, forestry and fishing; public administration; education; health and social work; arts, entertainment and recreation. Alongside these, financial and insurance activities are also frequently excluded, given their specific nature and the limited availability of statistics in this area.

Key business statistics for the non-financial business economy (EU, 2019)

Note: the non-financial business economy covers industry, construction, distributive trades and most other market services outside of financial services.

Source: Eurostat (online data code: sbs_na_sca_r2)

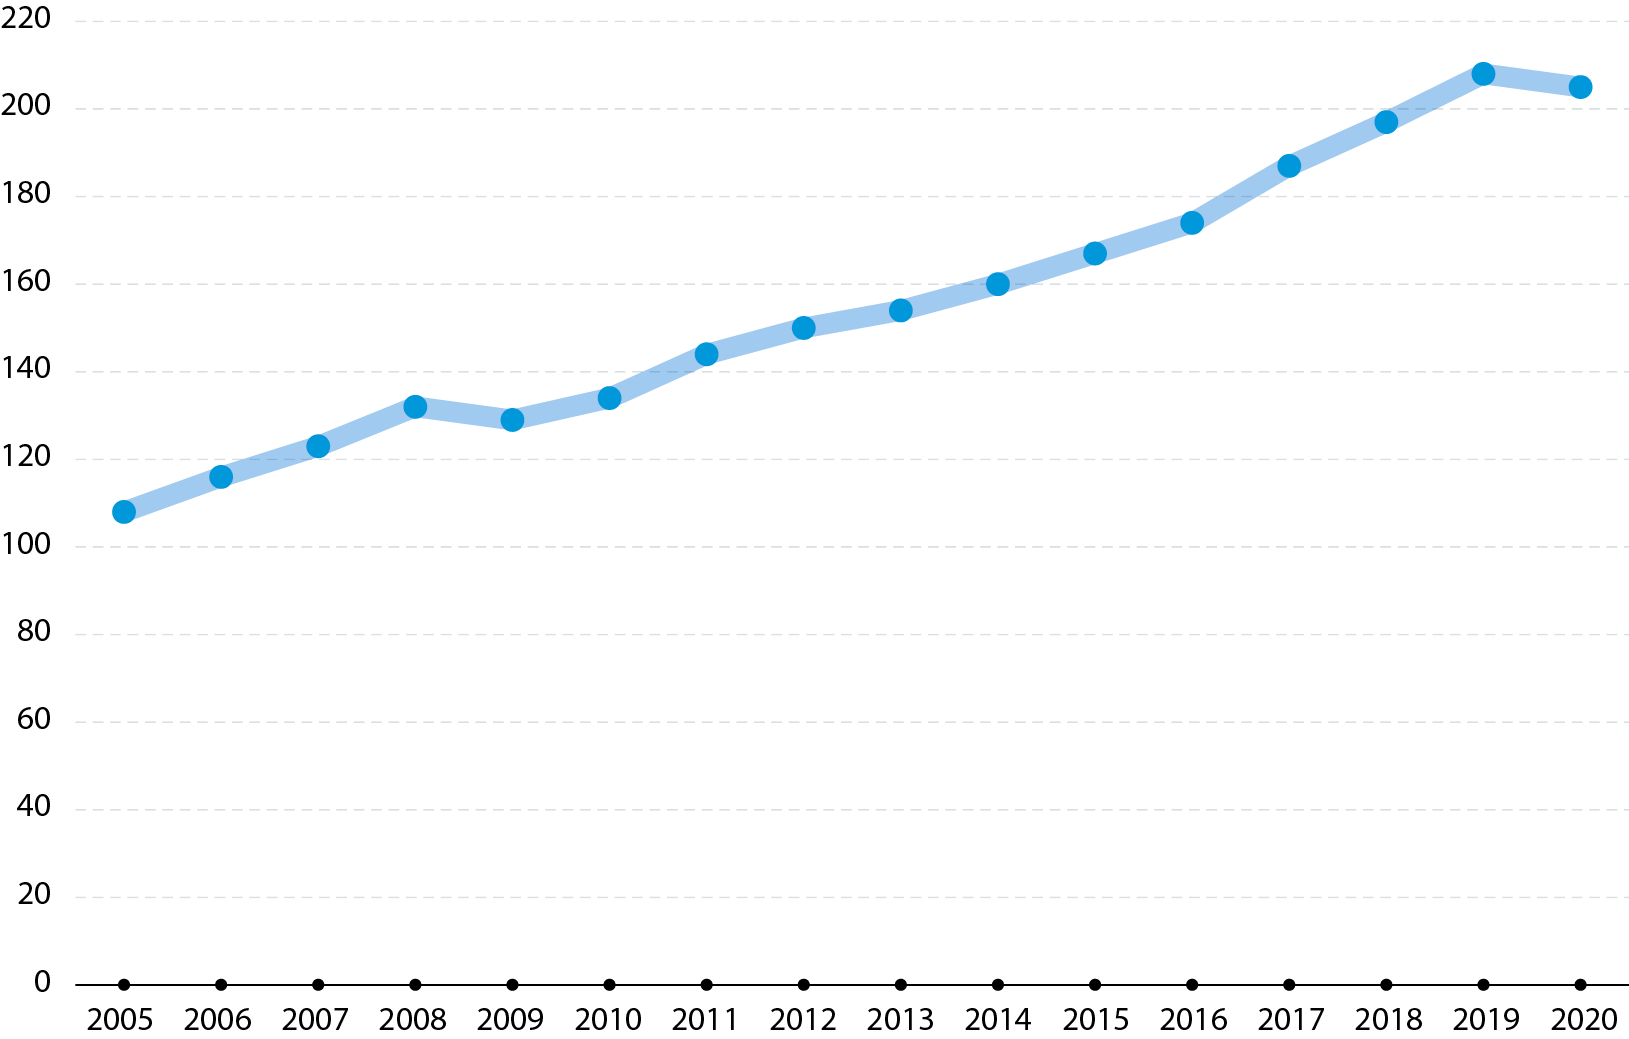
In 2019, there were 23.2 million enterprises in the EU’s non-financial business economy. Collectively they employed 131.5 million people and created €6 852 billion of wealth as measured by value added at factor cost.

Key business statistics in the non-financial business economy (%, share for each enterprise size class, EU, 2019)
Share of each enterprise size class based on the number of enterprises, number of persons employed and value added, in percent. Data for the EU. Annual data for 2019. Non-financial business economy. Enterprise size classes: micro and small; medium-sized; and large.

Note: estimates made for the purpose of this publication.

Source: Eurostat (online data code: sbs_sc_sca_r2)

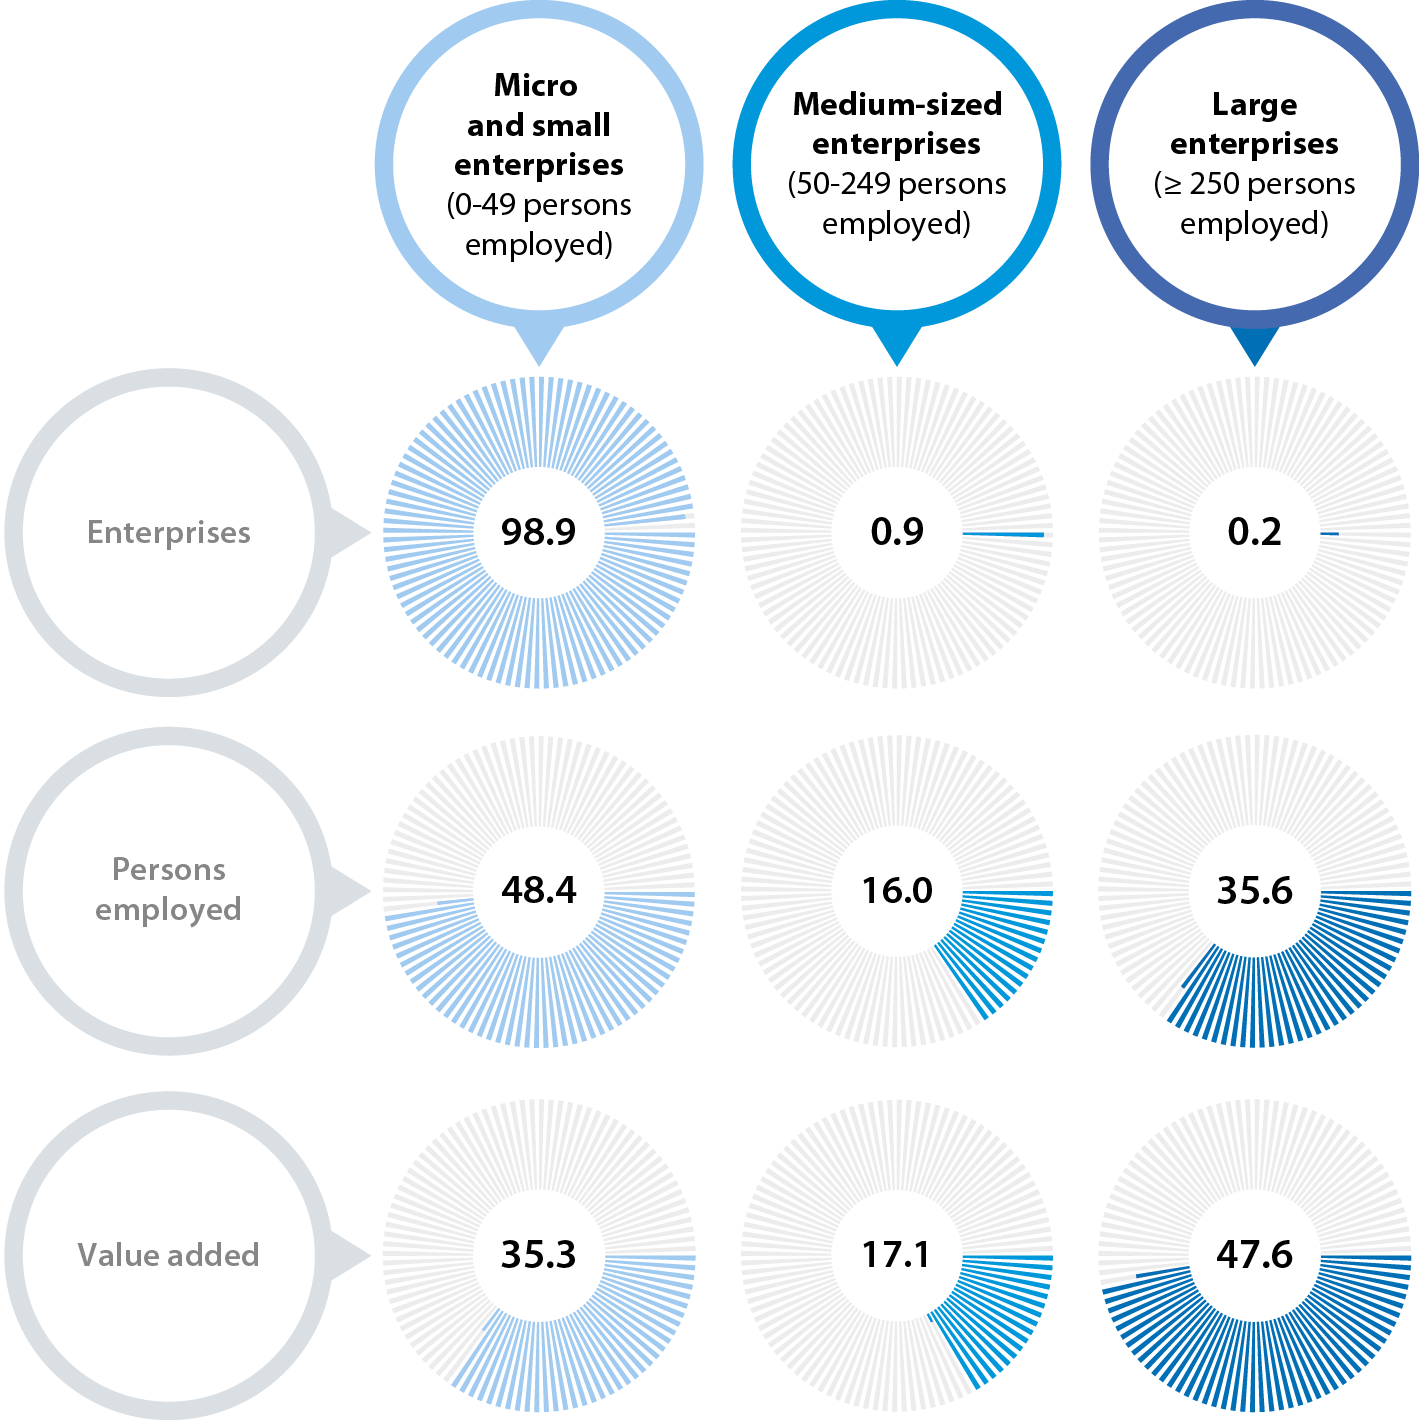
Data relating to enterprises that are active within the non-financial business economy can be presented according to enterprise size and measured in terms of the number of persons they employ. In 2019, the overwhelming majority (98.9 %) of EU businesses were micro or small enterprises employing fewer than 50 persons. Their economic weight was lower in terms of their contribution to employment or value added: micro and small enterprises employed just under half (48.4 %) of the EU’s non-financial business economy workforce, while they contributed just over one third (35.3 %) of the value added.

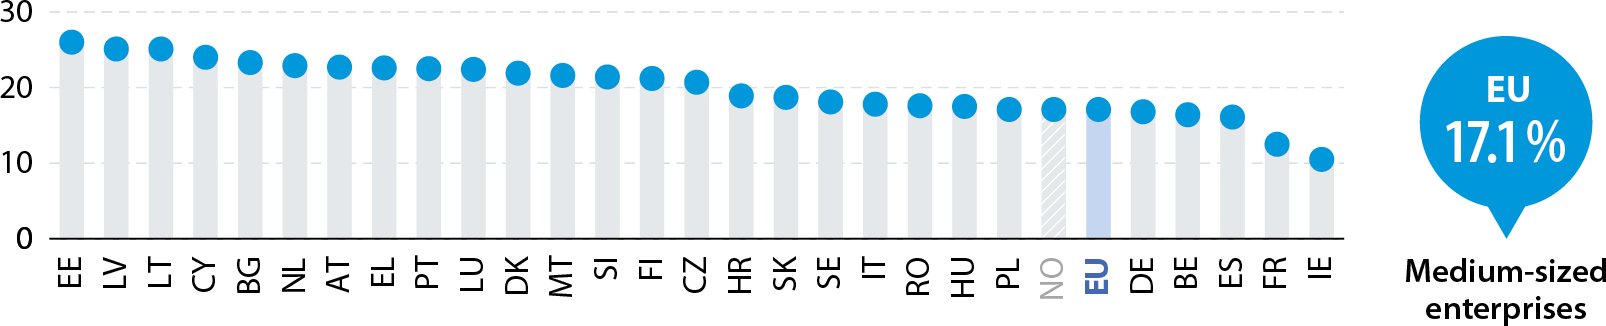
In 2019, there were 43 000 large enterprises (with 250 or more persons employed) in the EU’s non-financial business economy. These large enterprises represented just 0.2 % of the total number of enterprises. However, their economic weight was considerably greater: large enterprises employed more than one third (35.6 %) of the EU’s non-financial business economy workforce and generated an even higher share of its wealth (47.6 % of value added).

Value added in the non-financial business economy (%, share of the total value added for each enterprise size class, 2019)
Value added share of each enterprise size class, in percent. Data for the EU and national data for the EU Member States and EFTA countries. Annual data for 2019. Non-financial business economy. Enterprise size classes: micro and small Column charts In 2019, 35% of value added in the EU's non-financial business economy came from micro and small enterprises. Value added share of each enterprise size class, in percent. Data for the EU and national data for the EU Member States and EFTA countries. Annual data for 2019. Non-financial business economy. Enterprise size classes: medium-sized Column charts In 2019, 17% of value added in the EU's non-financial business economy came from medium-sized enterprises. Value added share of each enterprise size class, in percent. Data for the EU and national data for the EU Member States and EFTA countries. Annual data for 2019. Non-financial business economy. Enterprise size classes: large. Column charts In 2019, 48% of value added in the EU's non-financial business economy came from large enterprises.

Note: data for the EU are estimates made for the purpose of this publication. PT: excluding real estate activities. CY: excluding mining and quarrying, electricity, gas, steam and air conditioning supply, real estate activities, and repair of computers and personal and household goods. AT: 2016.

Source: Eurostat (online data code: sbs_sc_sca_r2)

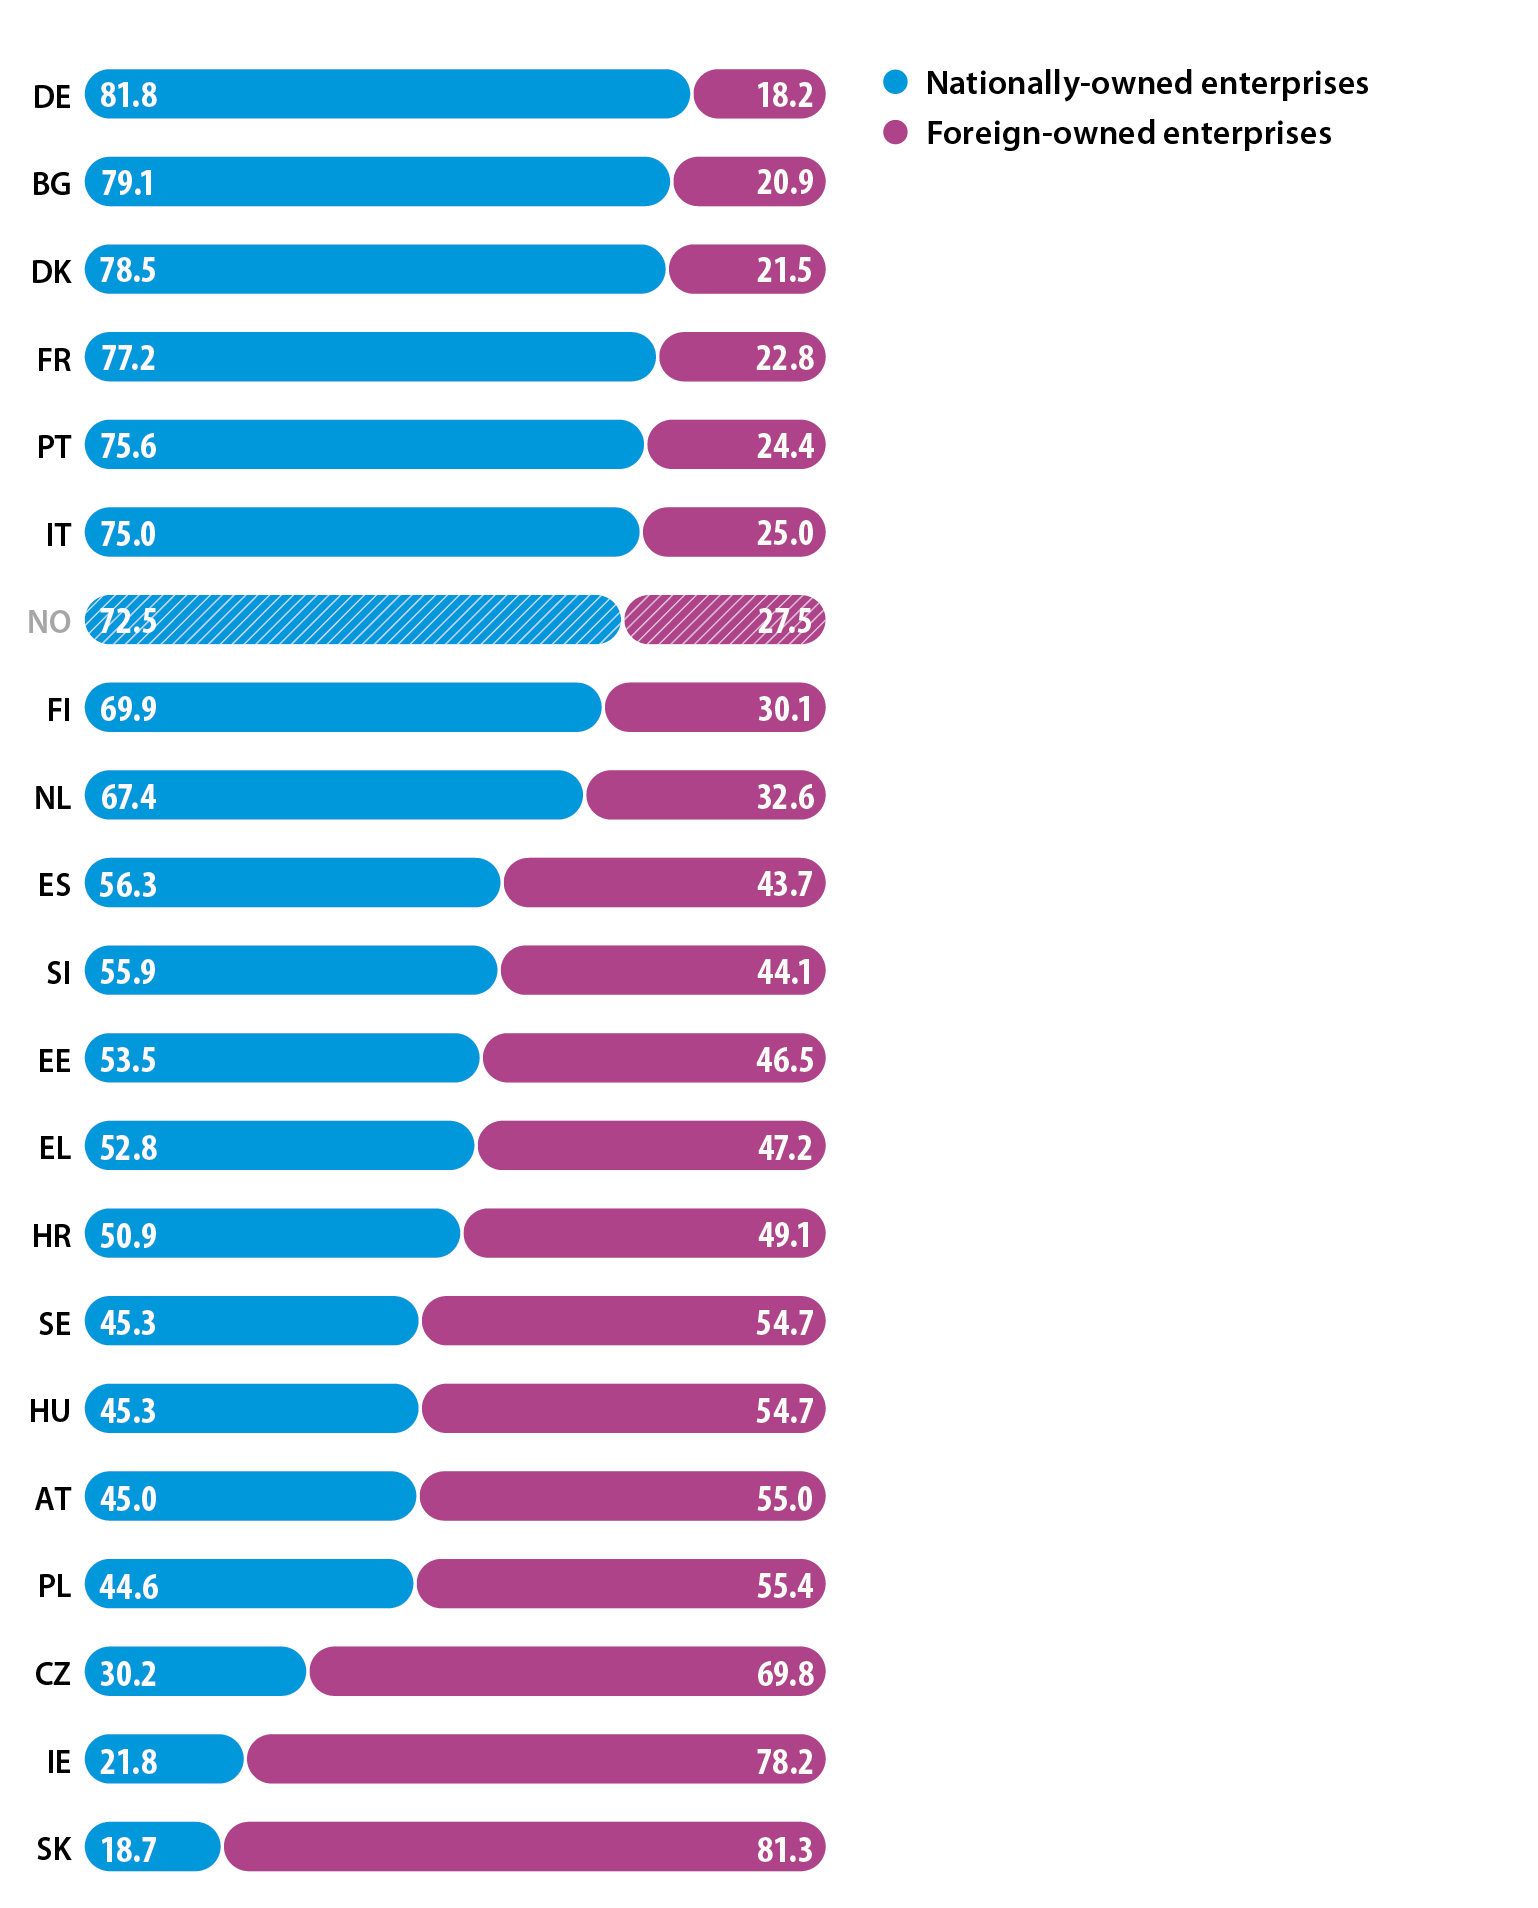
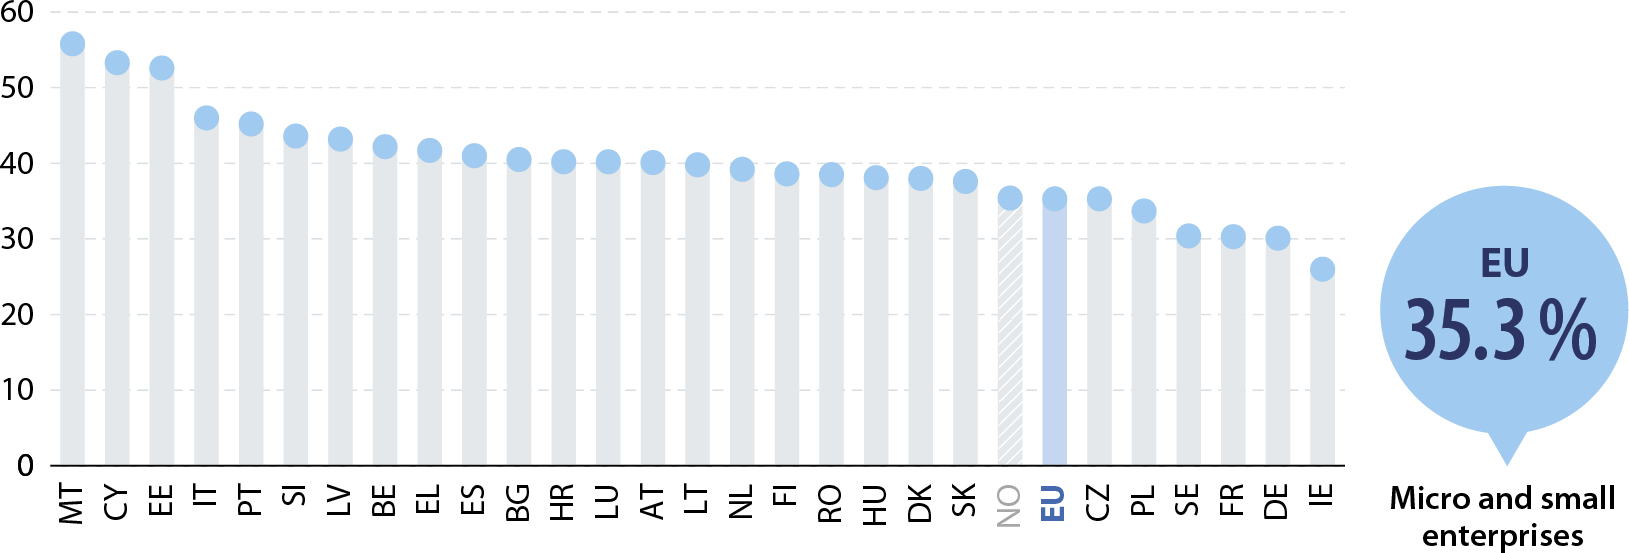
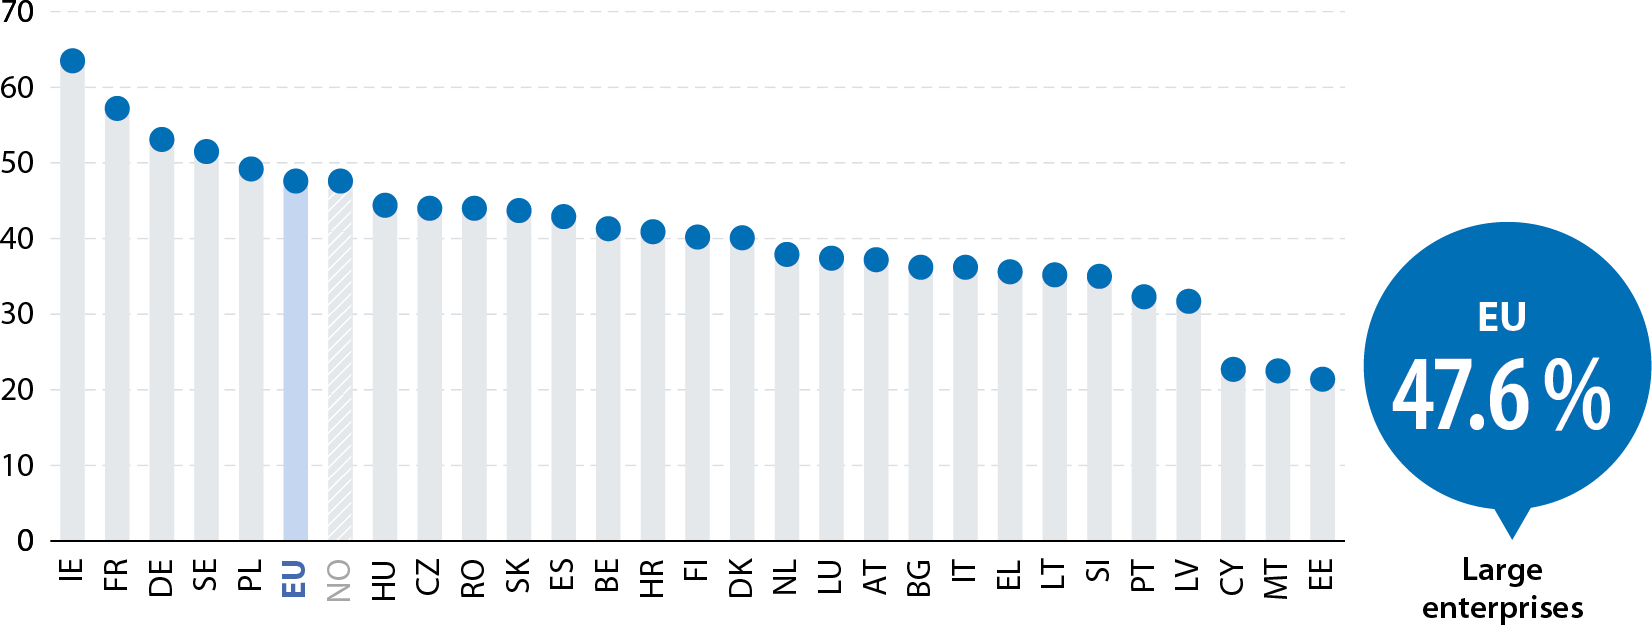
In 2019, micro and small enterprises contributed a relatively high share of the value added in the non-financial business economies of most of the southern EU Member States and Estonia. By contrast, large enterprises were responsible for approximately half of value added in the non-financial business economies of Poland and Sweden, 53.1 % in Germany and 57.2 % in France; this share peaked at 63.5 % in Ireland.

Previous section Next section

Entrepreneurship

Enterprise birth and death rates in the business economy (%, 2019)
Enterprise birth and death rates, in percent. Data for the EU and national data for the EU Menber States and EFTA countries. Annual data for 2019. Business economy.

Note: excluding the activities of holding companies (NACE Rev. 2 Group 64.2). IE and CH: 2018.

Source: Eurostat (online data codes: bd_9ac_l_form_r2 and bd_9bd_sz_cl_r2)

Business demography is a term used for studying the characteristics of the population of enterprises. The creation (or birth) of new enterprises and the closure (or death) of enterprises are important indicators for business dynamics.

In 2019, the EU enterprise birth rate (as measured by the number of births as a percentage of the number of active enterprises) in the business economy was 10.0 %. This ratio ranged from highs of 19.4 % in Lithuania and 15.8 % in Portugal down to 4.8 % in Greece.

Enterprise deaths concern the permanent closure of an enterprise. The information shown here therefore excludes changes resulting from mergers, take-overs, break-ups or other forms of restructuring such as a change of activity. In 2019, the preliminary enterprise death rate in the EU’s business economy was 8.3 %, ranging from highs of 29.5 % in Bulgaria and 22.5 % in Lithuania down to a low of 1.0 % in Ireland (2018 data).

Enterprise survival rates in the business economy (%, 2019)
One year and five year enterprise survival rates, in percent. Data for the EU and national data for the EU Member States and EFTA countries. Annual data for 2019. Business economy.

Note: excluding the activities of holding companies (NACE Rev. 2 Group 64.2). IE: 2018; five-year rate, not available. DE, HR and HU: rates reflect a break in series. BE and PL: five-year rate reflects a break in series.

Source: Eurostat (online data code: bd_9bd_sz_cl_r2)

While business dynamics are important for the overall performance of an economy, individual entrepreneurs are more likely to be concerned by the development and survival of their business. In 2019, four out of every five enterprises born in the previous year in the EU’s business economy had survived their first year: the one-year survival rate was 82 %. This rate was particularly high in Sweden and Greece (97 % of newly-born enterprises survived one year), while 96 % of new enterprises survived at least one year in the Netherlands and Belgium. By contrast, 63 % of new enterprises in Lithuania survived their first year.

The EU five-year survival rate for enterprises born in 2014 and still active in 2019 was 45 %; in other words, less than half of all newly-born enterprises from the 2014 cohort survived until 2019. Five-year enterprise survival rates were less than 50 % for a majority of the EU Member States, with the lowest rate recorded in Lithuania (29 %). The highest rates were in Belgium and Sweden (both 62 %), followed by the Netherlands (59 %).

High-growth enterprises (%, share of the total number of enterprises in each activity, EU, 2019)
Share of high-growth enterprises, in percent. Data for the EU. Annual data for 2019. Business economy and NACE Sections.

Note: a high-growth enterprise is defined within business demography statistics as one that had at least 10 employees at the beginning of the period studied and whose number of employees grew, on average, by more than 10 % per year over a three-year period. Data for the business economy exclude the activities of holding companies (NACE Rev. 2 Group 64.2). Mining and quarrying: 2018.

Source: Eurostat (online data code: bd_9pm_r2)

Enterprise creation and subsequent business growth can potentially have a considerable impact on employment.

In 2019, high-growth enterprises accounted for 11.5 % of all enterprises in the EU’s business economy. These enterprises were particularly common in the information and communication sector (17.9 %) and in administrative and support service activities (14.6 %). At the other end of the range, three capital-intensive activities – mining and quarrying (9.3 %; 2018 data), real estate activities (8.5 %), and electricity, gas, steam and air conditioning supply (8.2 %) – had the lowest proportions of high-growth enterprises.

High-growth enterprises (%, share of the total number of enterprises in the business economy, 2019)

In 2019, high-growth enterprises accounted for around one in six of all enterprises in the business economies of Greece (2018 data), Ireland (2018 data), Spain and Finland. By contrast, there were six EU Member States where high-growth enterprises accounted for less than 1 in 10 enterprises, with particularly low shares in Cyprus (3.5 %) and Romania (2.4 %).

Share of high-growth enterprises, in percent. Data for the EU and national data for the EU Merber States and EFTA countries. Annual data for 2019. Business economy. Modified bar chart (so-called ladder).

Note: see above for the definition of a high-growth enterprise. Excluding the activities of holding companies (NACE Rev. 2 Group 64.2). IE and EL: 2018. CH: 2017.

Source: Eurostat (online data code: bd_9pm_r2)

Business registrations and declarations of bankruptcy in the business economy (2015 = 100, EU, Q1 2015–Q4 2021)
Index of business registrations and declarations of bankruptcy. Data for the EU. Quarterly data for Q1 2015 to Q4 2021. Business economy. Line graph. Business registrations in the EU increased 1.6% between quarters 3 and 4 in 2021. Bankruptcy declarations decreased by 0.7% between quarters 3 and 4 of 2021.

Note: the business economy covers industry, construction, distributive trades and most other services (as defined by NACE Rev. 2 Sections B to N and P to R and NACE Rev. 2 Divisions 95 and 96). Business registrations excluding CZ, EL, CY, MT, AT, FI and SE. Declarations of bankruptcy excluding CZ, EL, IE, HR, MT, AT, FI and SE.

Source: Eurostat (online data code: sts_rb_q)

In contrast to data for enterprise births, business registrations are an administrative procedure that may be considered as a declaration of intent. Between the start of 2017 and the end of 2019, there was a relatively stable upward trend for the number of business registrations in the EU. This pattern ended abruptly in the first quarter of 2020 when the impact of the COVID-19 pandemic and related containment measures was felt; an even sharper fall was recorded in the second quarter of 2020. In the third quarter of 2020, the number of business registrations returned above the level recorded at the end of 2019. Thereafter there was a relatively stable development through to the end of 2021.

Bankruptcy declarations provide an early sign for measuring sentiment in the business economy. Some businesses that file for bankruptcy may be sold off and hence they do not necessarily close permanently, in contrast to the situation for an enterprise death. Having fallen between the start of 2015 and the end of 2016, the number of bankruptcy declarations in the EU remained relatively unchanged up until the first quarter of 2020 when the first impact of the pandemic and containment measures was felt. As for business registrations, the number of bankruptcy declarations fell further in the second quarter of 2020. Despite increasing in each of the next three quarters, the number of bankruptcy declarations in the first quarter of 2021 was still clearly below the level at the end of 2019. The number of bankruptcy declarations fell again during the rest of 2021 but remained above the low recorded in the second quarter of 2020.

Previous section Next section

Research and development

Business expenditure on R&D (€ billion, EU, 2005–2020)
Business expenditure on research and development, in billion euro. Data for the EU. Annual data for 2005 to 2020. Line graph.

Note: business expenditure across all economic activities.

Source: Eurostat (online data code: rd_e_berdindr2)

Business expenditure on R&D is a measure of intramural R&D. In contrast to global competitors such as Japan or the United States, business expenditure on R&D is relatively low in the EU. That said, the business enterprise sector usually accounts for the highest share of gross domestic expenditure on R&D when compared with the higher education, government and private non-profit sectors. Other than a slight reduction in 2009, EU business expenditure on R&D rose consistently (in current price terms) between 2005 and 2019. This generally upward development was not extended into 2020, as business expenditure on R&D fell 1.5 % to €205 billion.

Business expenditure on R&D (€ per inhabitant, 2020)
Business expenditure on R&D per inhabitant, in euro. Data for the EU and national data for the EU Member States and EFTA countries. Annual data for 2020. Column chart.

Note: business expenditure across all economic activities. CH: 2019.

Source: Eurostat (online data code: rd_e_berdindr2)

Sweden, Belgium, Denmark, Austria, Germany and Finland had the highest rates of business R&D expenditure per inhabitant, alongside the highest overall levels of R&D intensity (R&D expenditure relative to GDP).

Business enterprise expenditure on R&D in the EU averaged €458 per inhabitant in 2020. This ratio stood at more than €1 000 per inhabitant in Sweden and Belgium but was less than €200 per inhabitant in 14 of the EU Member States, the lowest ratios were in Latvia and Romania.

Intramural R&D expenditure in industry and construction (%, share of the total intramural expenditure according to the control of the enterprise, 2019)
Nationally-owned and foreign-owned enterprises' shares of in intramural R&D expenditure, in percent. National data for the EU Member States and EFTA countries. Annual data for 2019. Industry and construction combined. Stacked bar chart.

Note: intramural R&D expenditures are all current expenditures plus gross fixed expenditure for R&D performed within a statistical unit. EE, NL and SI: 2017. BE, CY, LV, LT, LU, MT and RO: not available.

Source: Eurostat (online data code: fats_g1a_rd)

Part of the globalisation phenomenon observed in recent decades has been the growing internationalisation of R&D expenditure. This can have benefits for host economies as well as for multinational enterprises that perform research abroad, especially in terms of a transfer of knowledge.

Within industry and construction, foreign-owned enterprises performed more than half of all intramural R&D expenditure in 2019 in seven of the EU Member States, namely, Sweden, Hungary, Austria, Poland, Czechia, Ireland and Slovakia. At the other end of the range, almost four fifths of total R&D expenditure in industry and construction was performed by nationally-owned enterprises in Denmark and Bulgaria, with an even higher share in Germany (81.8 %).

Previous section Next theme

Innovation

Innovation active enterprises (EU, 2018)
Number and share of enterprises that are innovation active, as a count and in percent. Data for the EU. Annual data for 2018. Core innovation activities. Enterprises with 10 or more persons employed. Infographic.

Note for all indicators on pages 20 and 21: based on core innovation activities; covers enterprises with 10 or more employees; Innovation active enterprises are those having any (ongoing or abandoned) innovation activity (including R&D activities), or that have completed or implemented any innovation.

Source: Eurostat (online data code: inn_cis11_bas)

The Community innovation survey (CIS) focuses on the innovation activities of enterprises. It concentrates on a set of core innovation activities and only covers enterprises with 10 or more persons employed. In 2018, there were 729 000 enterprises across the EU in this target population, of which approximately half (367 000) were innovation active.

Innovation active enterprises (%, share of enterprises that are innovation active for each enterprise size class, EU, 2018)
Share of enterprises that are innovation active, in percent. Data for the EU. Annual data for 2018. Core innovation activities. Enterprise size classes: small; medium-sized; and large.

Note: see the note for the chart at the top of this page.

Source: Eurostat (online data code: inn_cis11_bas)

In 2018, across core innovation activities more than three quarters of all large enterprises (with 250 or more persons employed) in the EU engaged in some form of innovative activity. By contrast, less than half of all small enterprises (with 10–49 persons employed) were engaged in some form of innovation.

Innovation active enterprises (%, share of enterprises that are innovation active for each activity, 2018)
Share of enterprises that are innovation active, in percent. Data for the EU and national data for the EU Member States and EFTA countries. Annual data for 2018. Industry and core innovation services. Enterprises with 10 or more persons employed. Double bar chart.

Note: see the note at the top of page 20. Ranked on the share for industry and core innovation services together. Industry is defined by NACE Rev. 2 Sections B to E. Core innovation services is defined by NACE Rev. 2 Sections H, J and K and Divisions 46 and 71 to 73.

Source: Eurostat (online data code: inn_cis11_inact)

Across the EU, in 2018 there appeared to be little difference between the share of enterprises within industry (53.1 %) and core innovation services (47.6 %) that were engaged in innovation.

In 2018, the proportion of industrial enterprises that were innovators peaked at 74.7 % in Estonia, while Belgium, Germany, Cyprus and Austria were the only other EU Member States to record shares of more than two thirds. By contrast, the lowest shares were recorded in Poland (26.1 %) and Romania (16.3 %).

In 2018, the proportion of core innovation service enterprises that were innovators peaked at 71.5 % in Estonia. The next highest shares – all within the range of 64–68 % – were recorded in Cyprus, Germany, Belgium and Sweden.

Persons employed working in innovation active enterprises (%, share of all persons employed, 2018)

The proportion of persons employed working in innovative enterprises reflects, at least to some degree, the specialisation and concentration of particular economic activities and the size structure of enterprises within each economy: larger enterprises tend to have a greater propensity to be innovators.

Across core innovation activities in 2018, more than 80.0 % of persons employed in Germany, Estonia, Belgium, Finland, Austria and Sweden worked for an enterprise engaged in some form of innovation activity. In all but one of the remaining EU Member States, more than half of all persons employed worked for an innovative enterprise. The exception was Romania, where approximately one quarter of all persons employed were in innovative enterprises.

Note: see the note at the top of page 20.

Source: Eurostat (online data code: inn_cis11_bas)

Previous section Next theme
Go to the top of the page