This chapter presents an overview of the structure and performance of the EU’s non-financial business economy. The subsequent chapters provide more detailed presentations.
Note: the largest and second largest activities are based on NACE Rev. 2 sections.
Source: Eurostat (online data code: sbs_na_sca_r2)
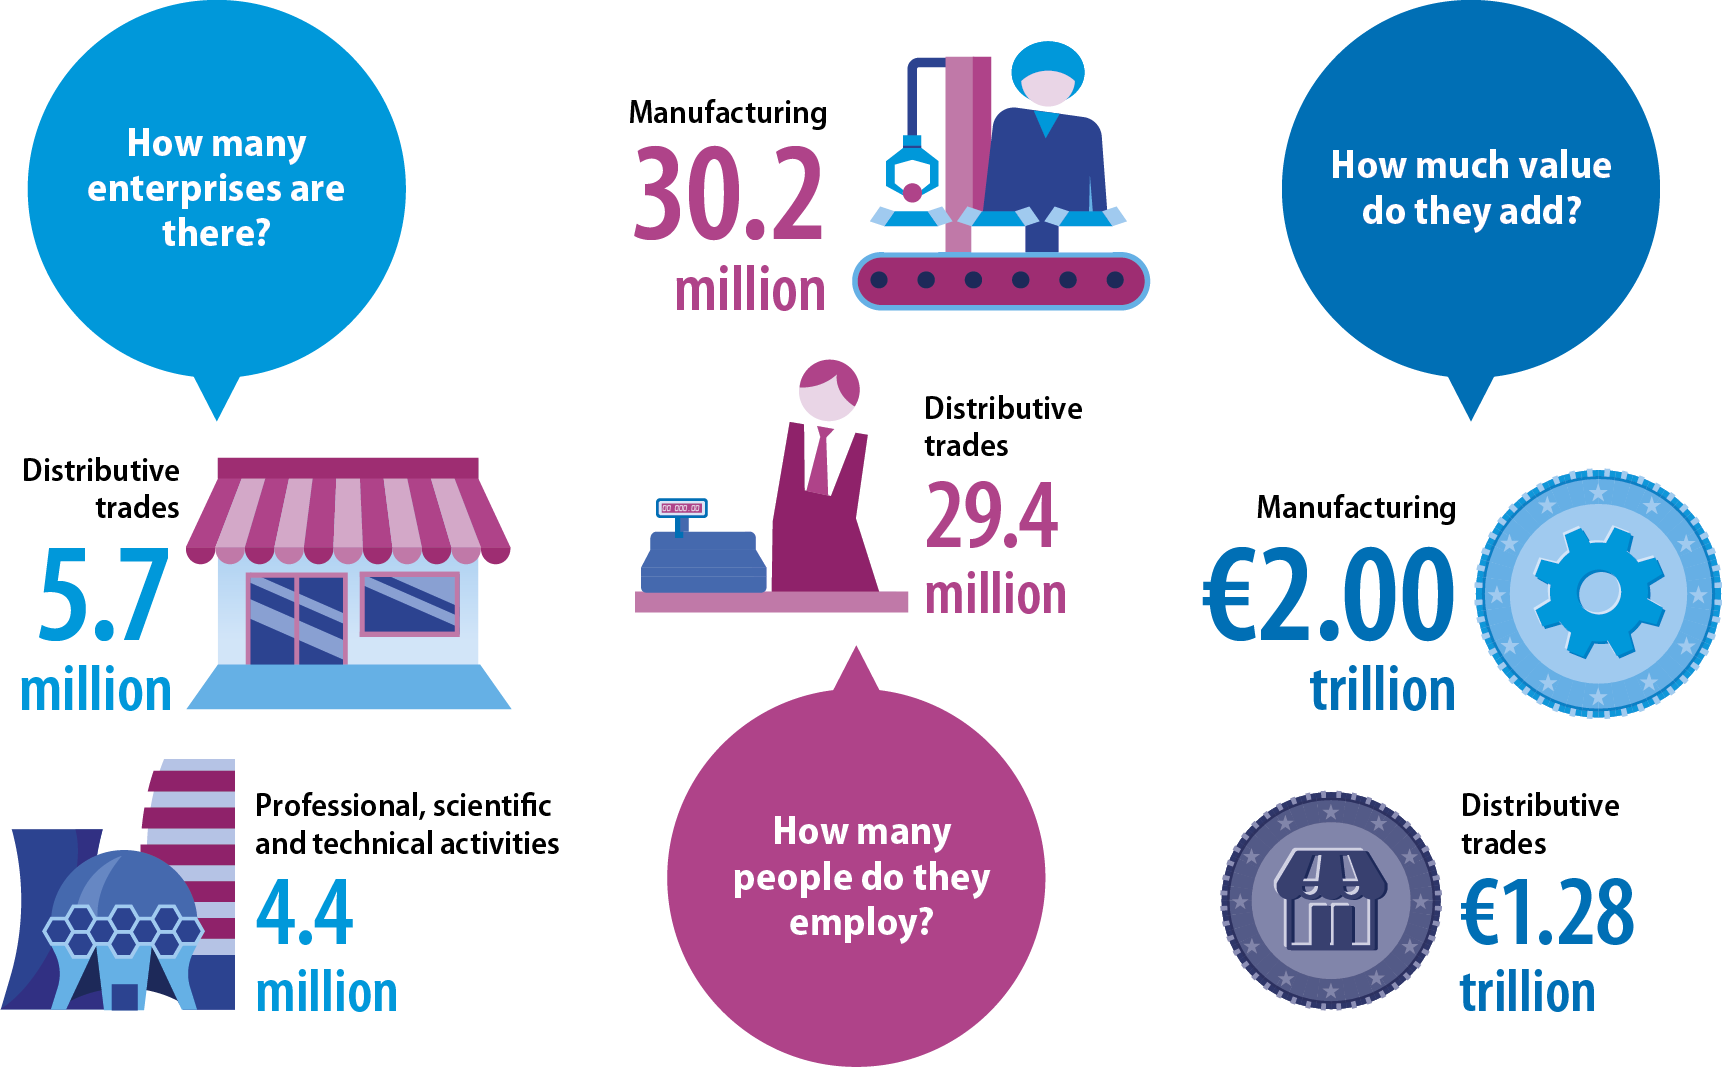
In 2019, the highest number of enterprises was recorded within the activity of distributive trades (5.7 million): approximately one in four enterprises within the EU’s non-financial business economy had a distributive trade as their principal activity. Distributive trades employed 29.4 million persons and added €1.28 trillion of value; these were the second highest values behind manufacturing, which had 30.2 million persons employed and €2.00 trillion of value added.
Note: the shares do not sum to 100.0 % due to rounding.
Source: Eurostat (online data code: sbs_na_sca_r2)
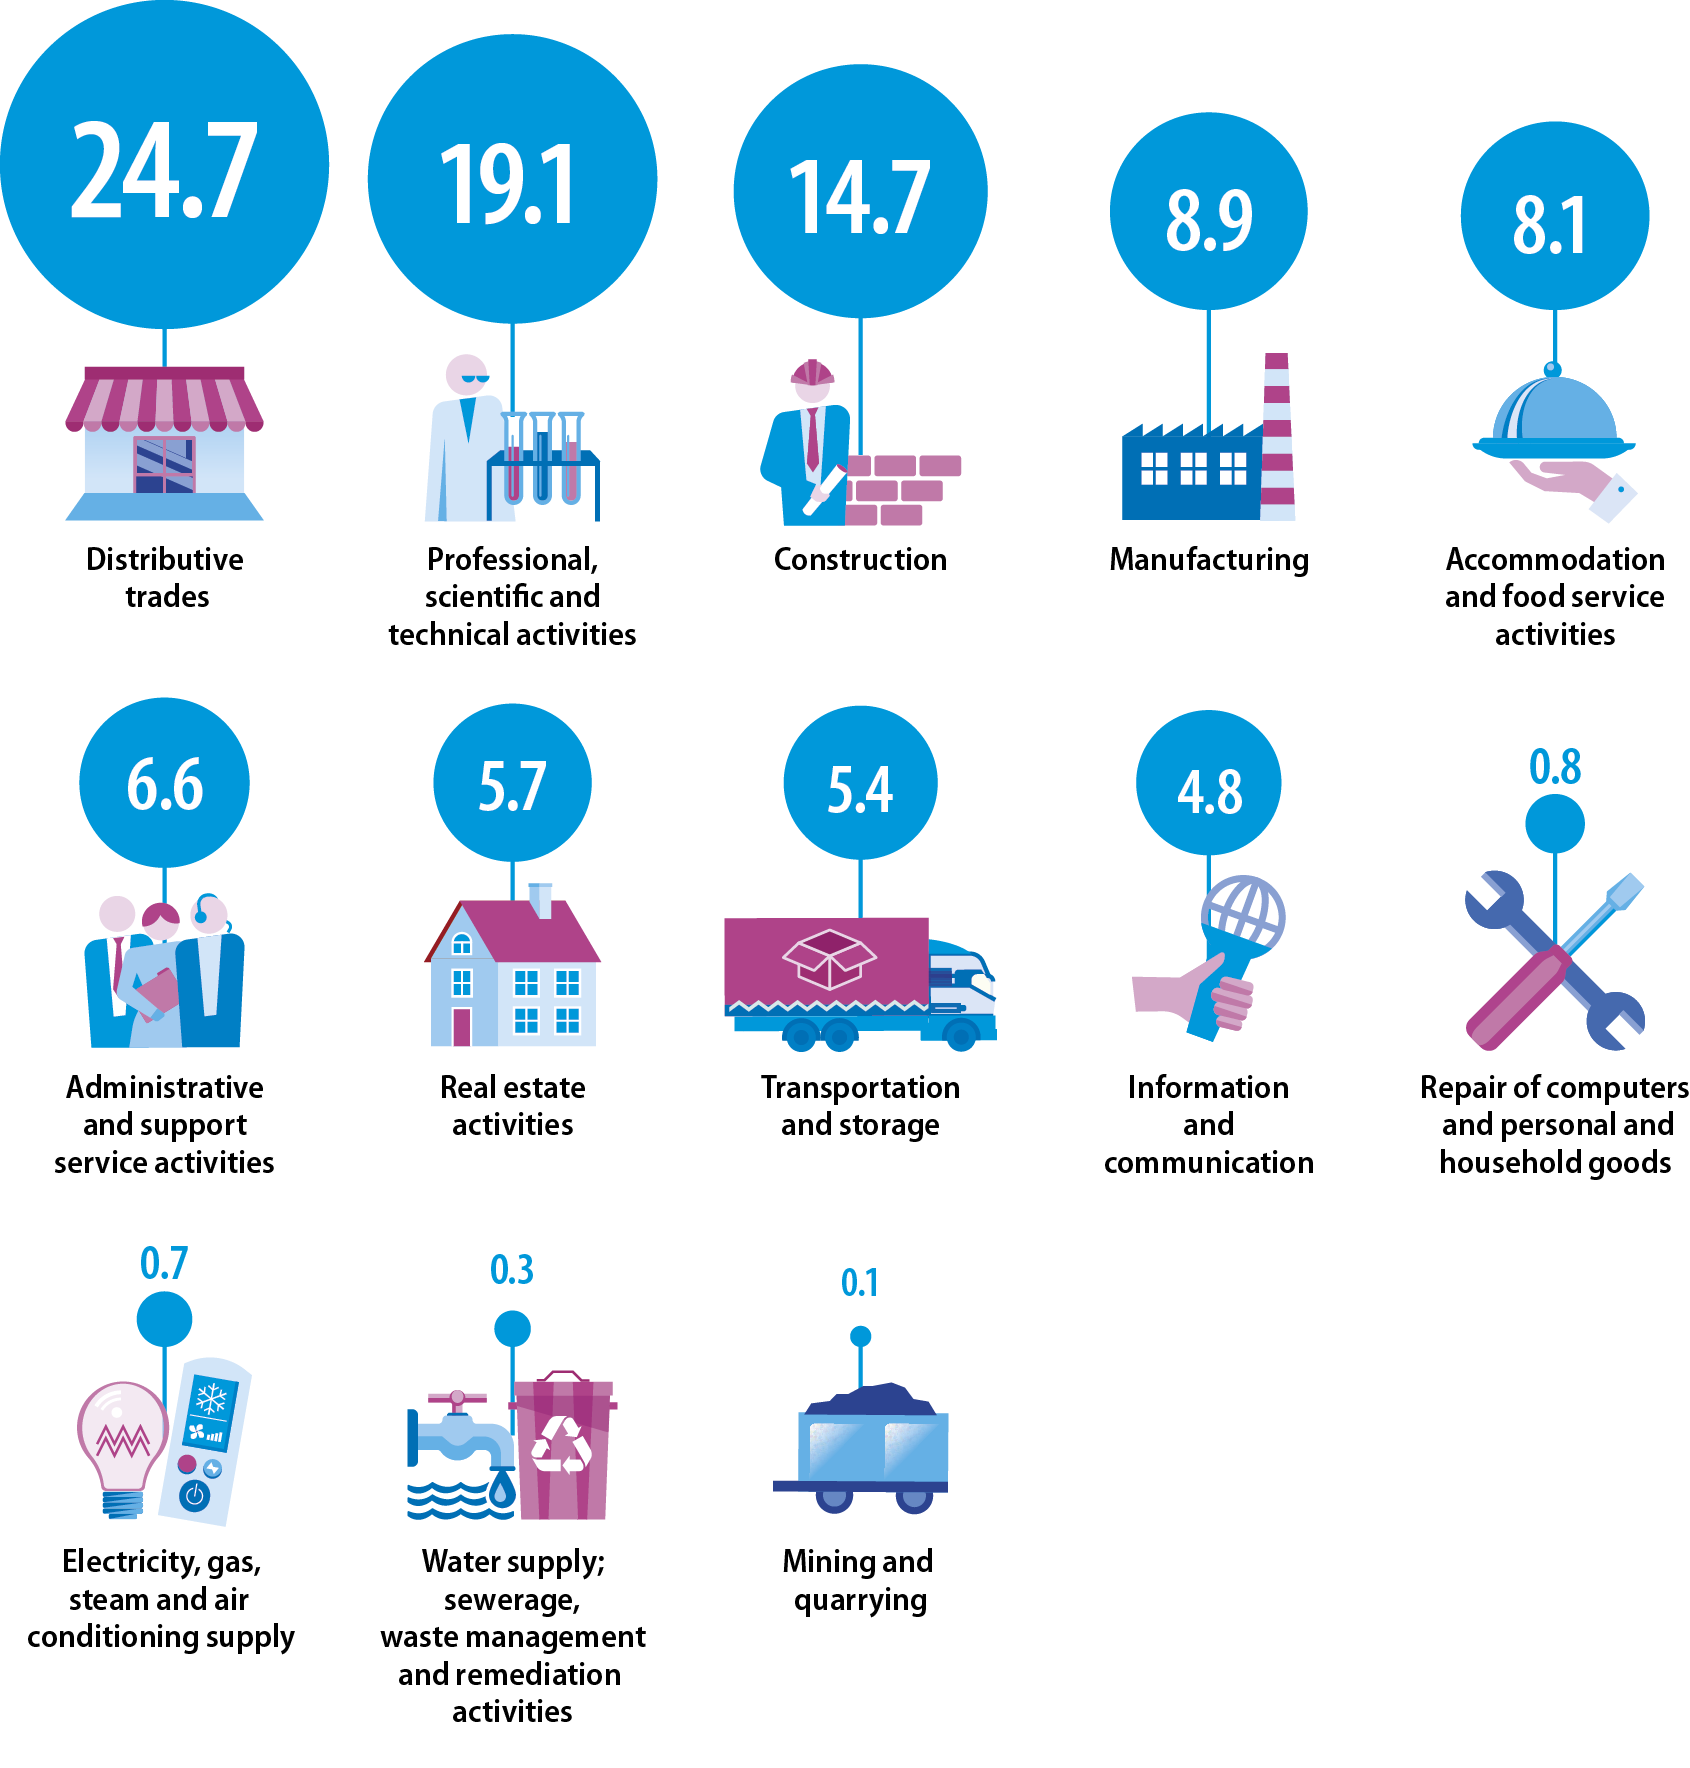
There were considerably more enterprises active within distributive trades (24.7 % of the total) than for any other sector of the EU’s non-financial business economy in 2019. Indeed, there were only two other sectors that recorded double-digit shares: professional, scientific and technical activities (a 19.1 % share of the total number of enterprises) and construction (14.7 %).
At the other end of the range, there were four activities which each contributed less than 1.0 % of the total number of enterprises in the EU’s non-financial business economy in 2019: the repair of computers and personal and household goods (0.8 %); electricity, gas, steam and air conditioning supply (0.7 %); water supply; sewerage, waste management and remediation activities (0.3 %); and mining and quarrying (0.1 %).
Note: the shares do not sum to 100.0 % due to rounding.
Source: Eurostat (online data code: sbs_na_sca_r2)
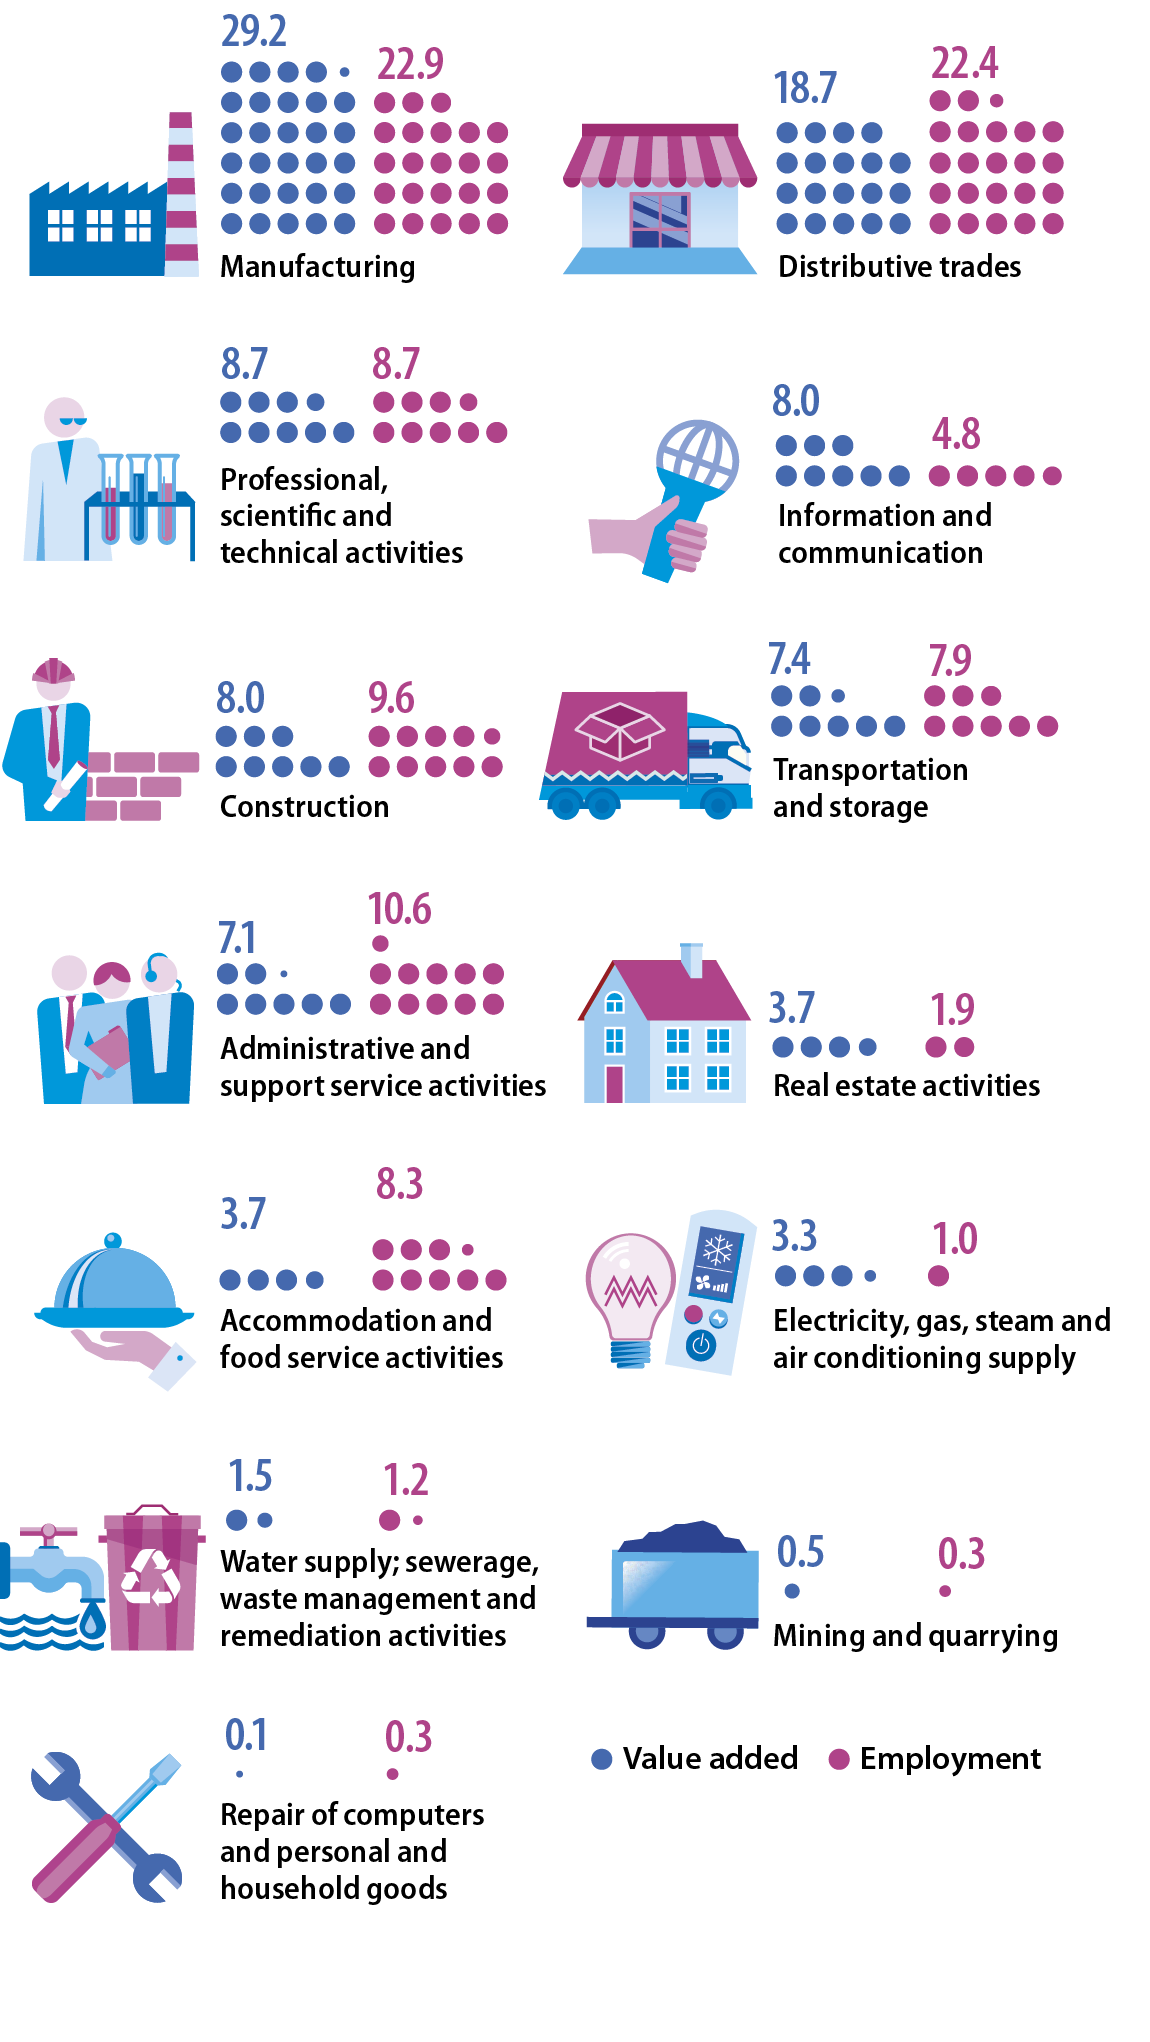
In 2019, some 29.2 % (or €2.0 trillion) of the added value in the EU’s non-financial business economy was contributed by the manufacturing sector. This was considerably greater than the second highest share, recorded for distributive trades (18.7 %), which in turn was much greater than the share registered for professional, scientific and technical activities (8.7 %).
More than one fifth of the EU’s non-financial business economy workforce in 2019 was employed in each of manufacturing (22.9 %) and distributive trades (22.4 %). Administrative and support service activities – which are relatively labour-intensive – employed just over one tenth (10.6 %) of the non-financial business economy workforce; this was the only other sector to record a double-digit share.
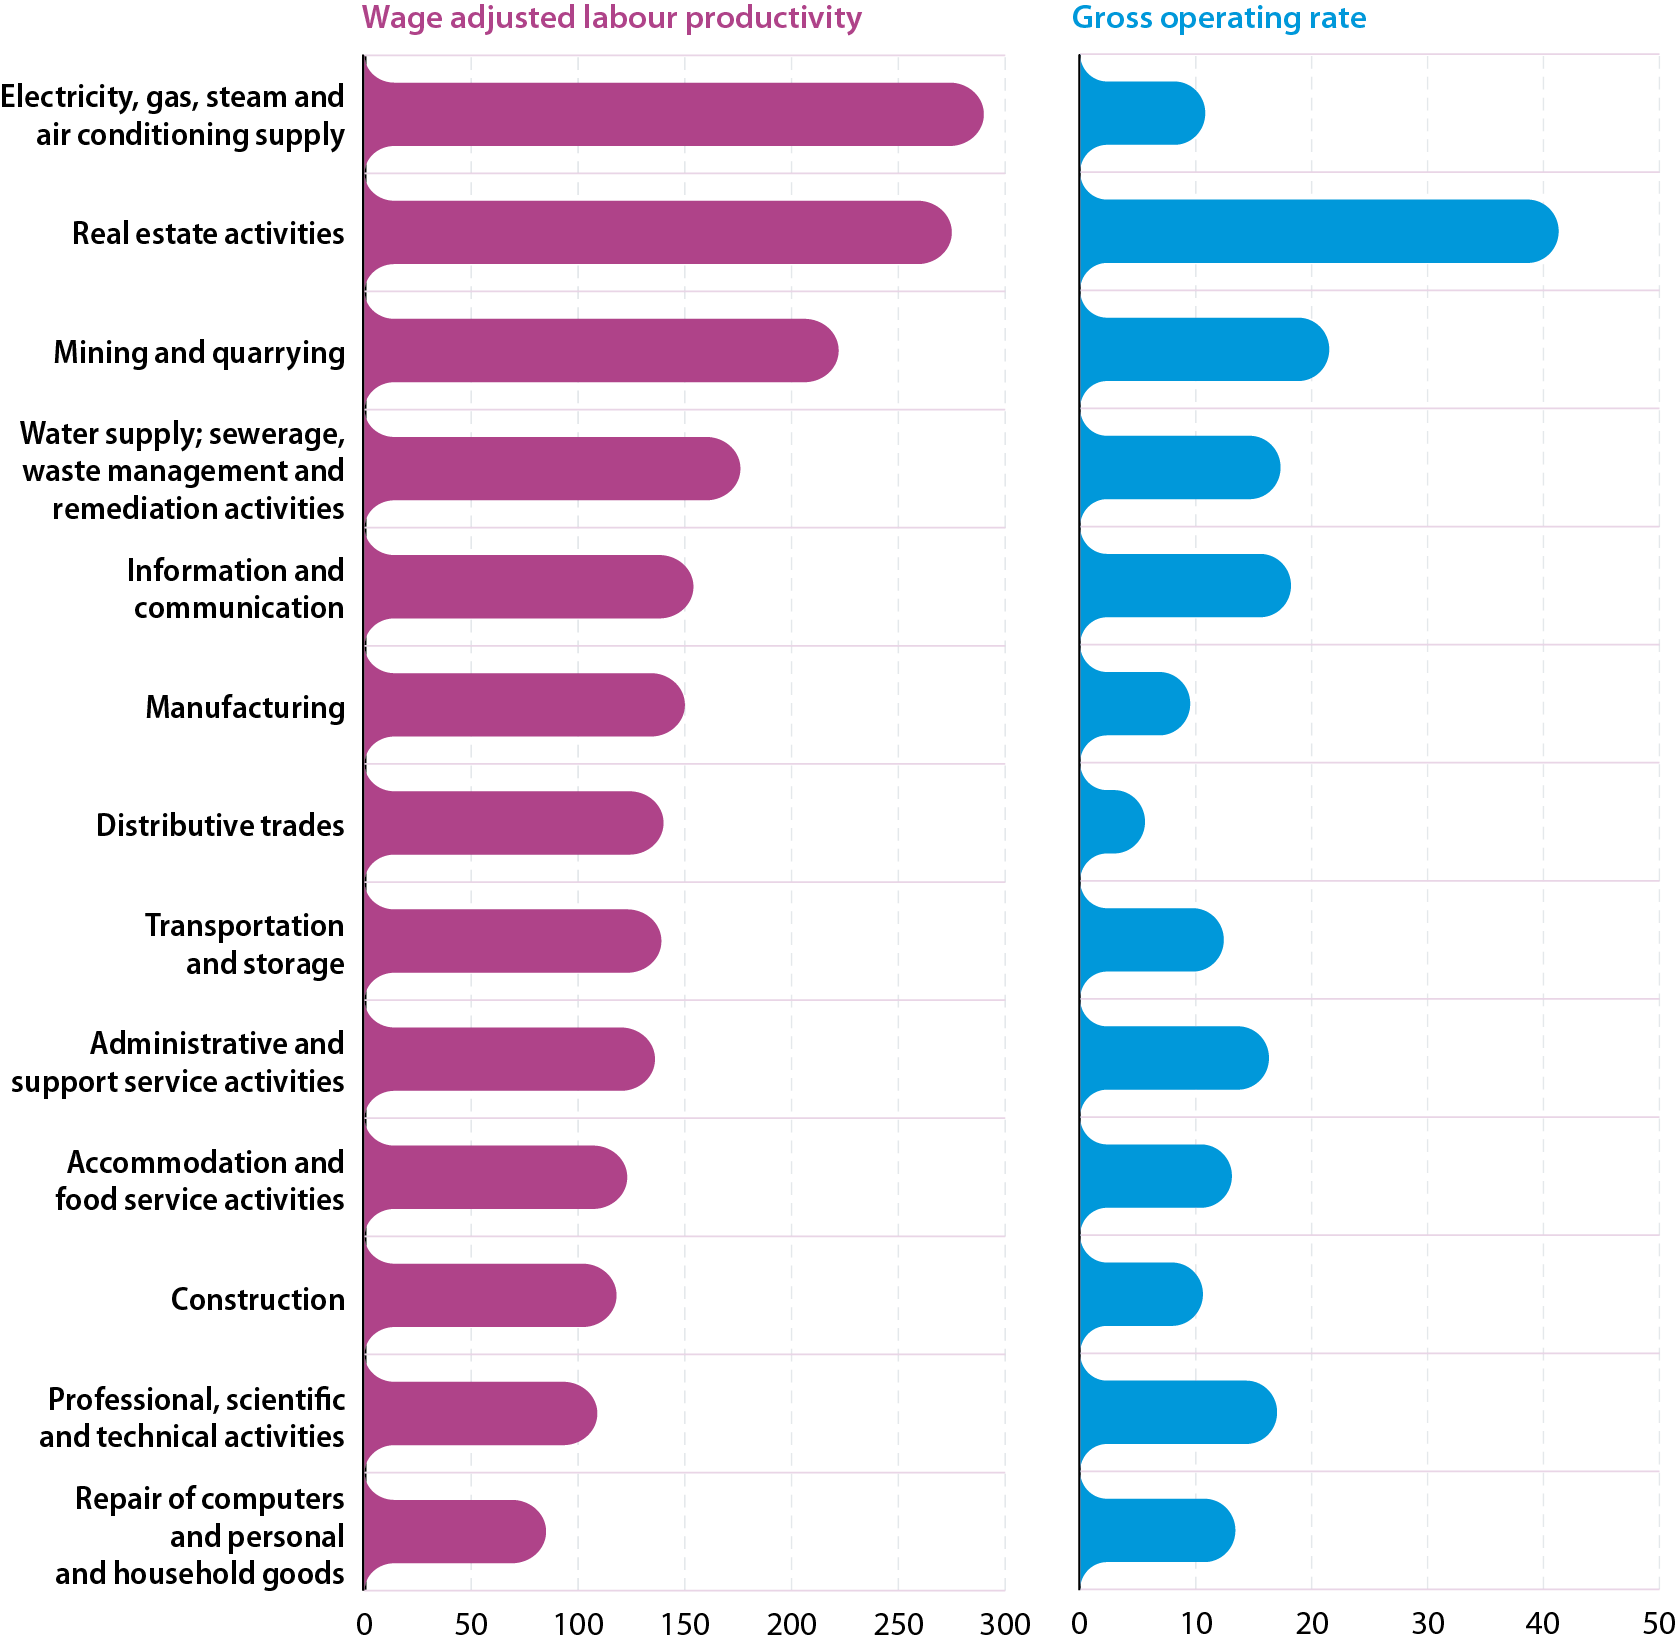
Note: different scales are used for the two indicators in the chart.
Source: Eurostat (online data code: sbs_na_sca_r2)
The wage-adjusted labour productivity ratio is defined as value added divided by personnel costs (subsequently adjusted by the share of paid employees in the total number of persons employed). The highest wage-adjusted labour productivity ratio in the EU’s non-financial business economy in 2019 was recorded for the capital-intensive activity of electricity, gas, steam and air conditioning supply: value added per person employed in this activity was 2.9 times as high as average personnel costs per employee. At the other end of the range, the repair of computers and personal and household goods was the only activity in the EU where value added per person employed did not cover average personnel costs per employee in 2019.
The gross operating rate is a measure of profitability and is defined as value added at factor cost minus personnel costs (the gross operating surplus) divided by total turnover. In 2019, the highest gross operating rate across the EU’s non-financial business economy was recorded for real estate activities (41.3 %) and the lowest for distributive trades (5.6 %).
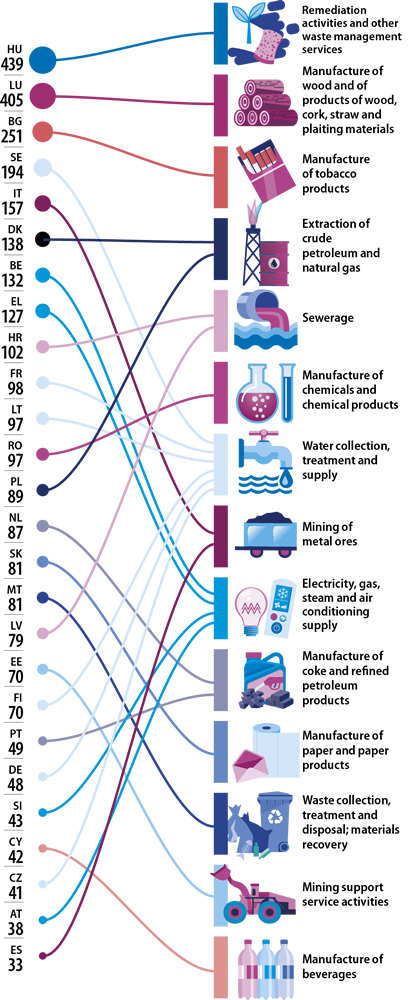
Industrial activities in which EU Member States recorded their highest investment rates (%, 2019)
The investment rate is defined as gross investment in tangible goods divided by value added at factor cost. Some of the highest investment rates in 2019 were recorded for capital-intensive activities. This was particularly the case for: water collection, treatment and supply; the extraction of crude petroleum and natural gas; and sewerage. Across the EU Member States, the highest investment rate among industrial activities in 2019 was recorded in Hungary for remediation activities and other waste management services (439 %), followed by Luxembourg for the manufacture of wood and of products of wood, cork, straw and plaiting materials (405 %).
Note: the highest investment rates for industrial activities are based on NACE Rev. 2 divisions. For nearly all EU Member States, some NACE Rev. 2 divisions are confidential. IE: not available.
Source: Eurostat (online data code: sbs_na_sca_r2)
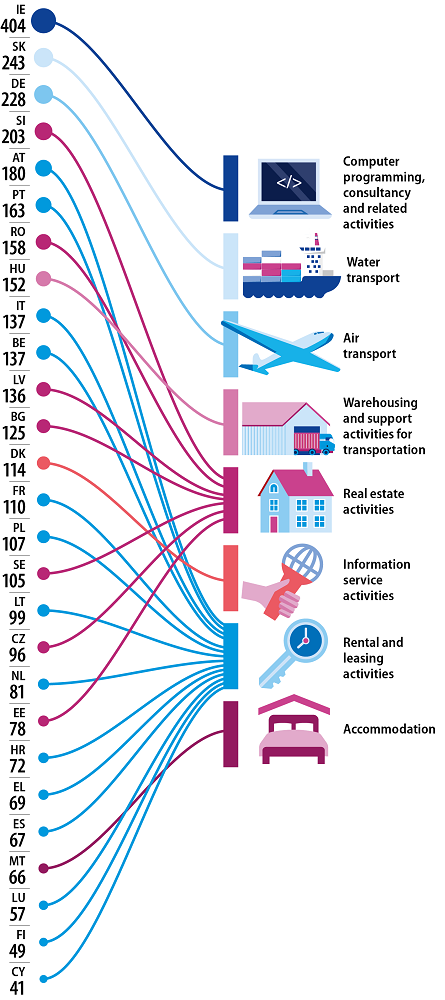
Non-financial service activities in which EU Member States recorded their highest investment rates (%, 2019)
Among the divisions that compose non-financial services, just over half of the EU Member States recorded their highest investment rate in 2019 for rental and leasing activities. However, the highest investment rates among non-financial services were recorded in Ireland for computer programming, consultancy and related activities (404 %), in Slovakia for water transport (243 %) and in Germany for air transport (228 %).
Note: the highest investment rates for non-financial service activities are based on NACE Rev. 2 divisions. For nearly all EU Member States, some NACE Rev. 2 divisions are confidential.
Source: Eurostat (online data code: sbs_na_sca_r2)