Inland waterway freight transport drops again in 2023

In 2023, the freight transport performance in the EU inland waterways decreased by 4.6% (or 6 million tonne-kilometres) compared with 2022.
Between 2013 and 2023, transport activity on the EU’s inland waterways was volatile. Activity decreased each year over the period 2014-2016. A slight increase was observed in 2017 (+0.5%) followed by a sharp fall in 2018 (-10.9%) and an immediate rebound in 2019 (+6.6%). In 2022, another sharp decline was recorded with a drop of 9.8%.
This information comes from data on inland waterway freight transport. The article presents a handful of findings from the more detailed Statistics Explained article.

Source dataset: iww_go_atygo
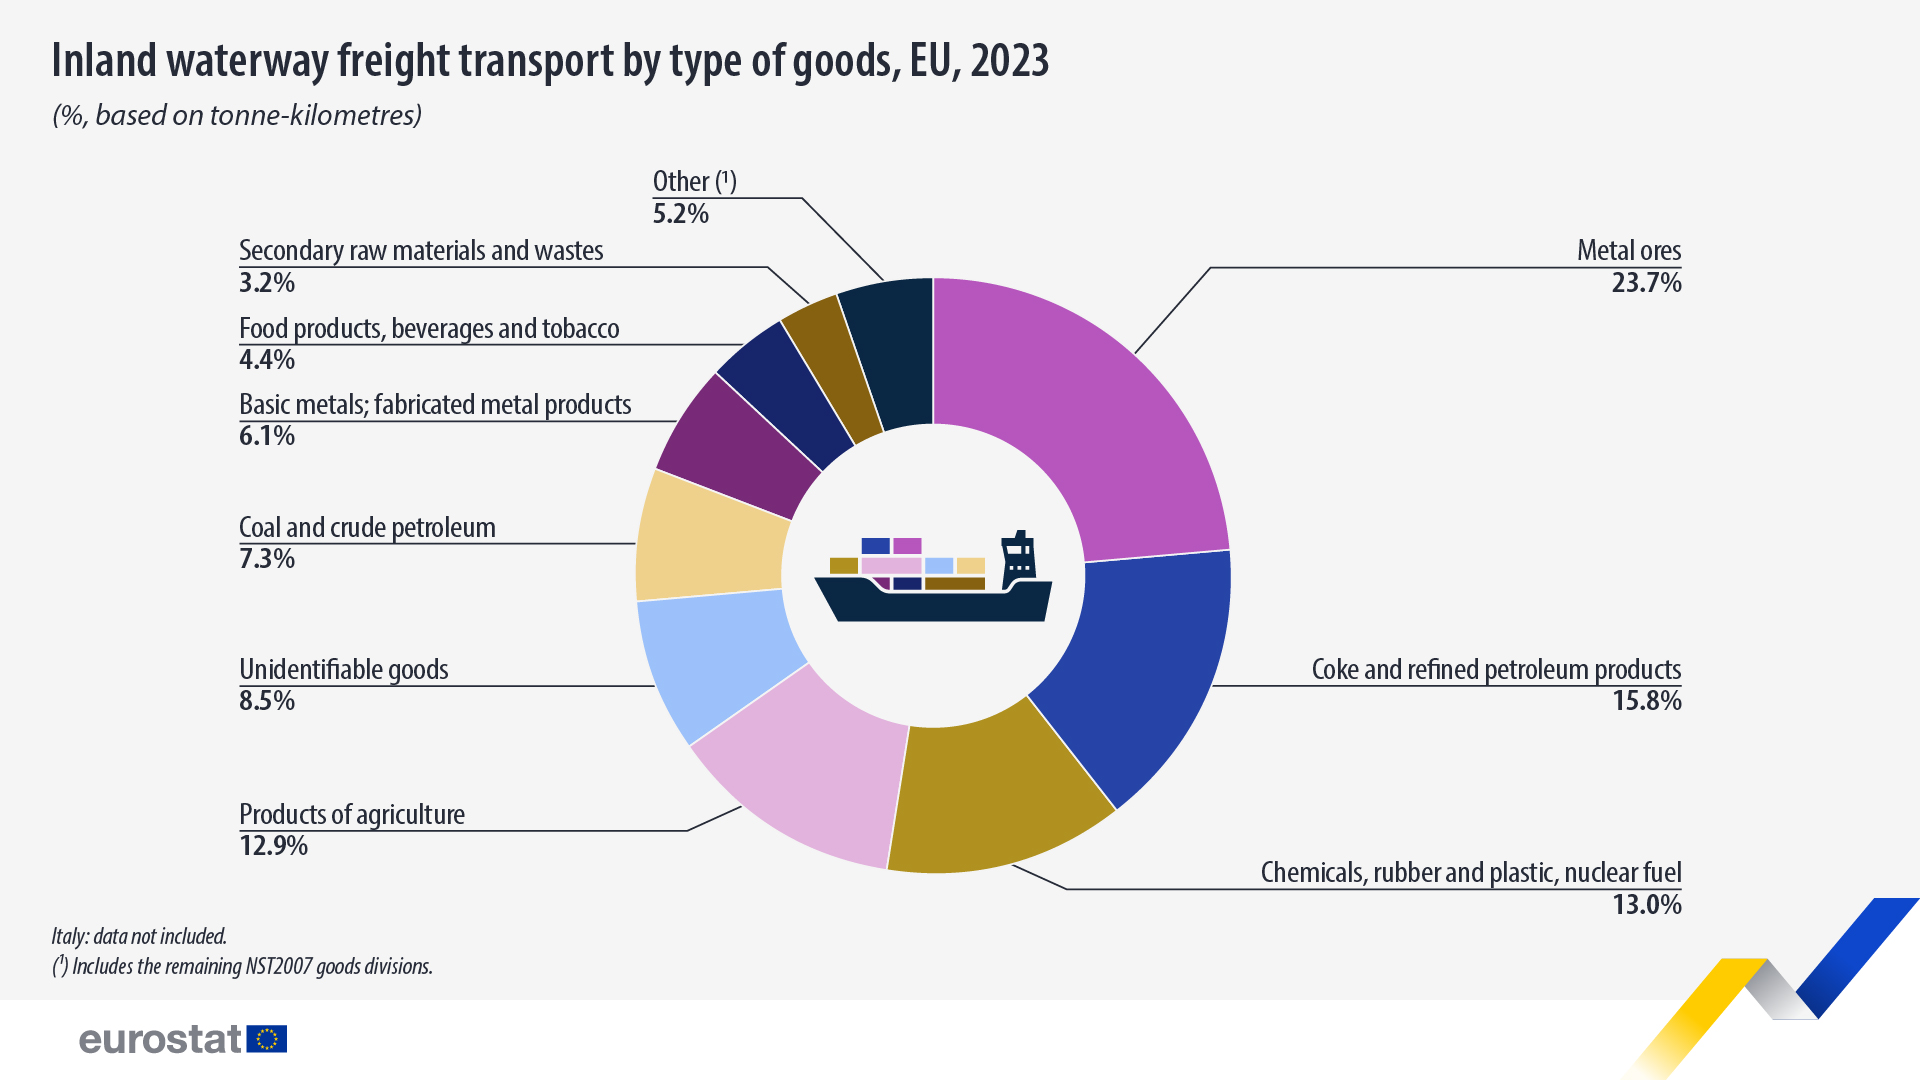
‘Metal ores’ largest goods category transported
The main types of goods transported in 2023 were ‘metal ores’, ‘coke and refined petroleum products’, ‘chemicals, rubber and plastic, nuclear fuel’ and ‘products of agriculture’. These categories accounted for almost two-thirds (65.3%) of all goods transport on EU inland waterways.
Compared with 2022, the largest changes in the share of the different goods types in total transport performance were recorded for ‘coal and crude petroleum’ with a decrease by 2.3 percentage points (pp), and ‘products of agriculture’ (increase by 1.3 pp).

Source dataset: iww_go_atygo
Highest volume per inhabitant in the Netherlands
Looking at the volume of freight transported per inhabitant, at EU level, on average 1.0 tonnes were transported on inland waterways. The Netherlands had the highest volume with 18.4 tonnes per inhabitant, followed by Belgium (13.6 tonnes per inhabitant) and Luxembourg (7.2 tonnes per inhabitant). All other countries registered less than 2.5 tonnes per inhabitant in 2023.
For more information
- Statistics Explained article on inland waterway freight transport
- Thematic section on transport
- Database on transport
- Reference Manual on Inland Waterway Transport Statistics
Methodological notes
• For inland waterway freight transport in the EU:
o Italy: data not included for 2023. As a result, the change rate between 2023 and 2022 has been calculated excluding data for Italy.
o Finland: data not included for 2017-2018.
o Sweden: data not included for 2013-2015.
• For inland waterway freight transport by type of goods:
o Italy: data not included.
If you have any queries, please visit our contact us page.
