
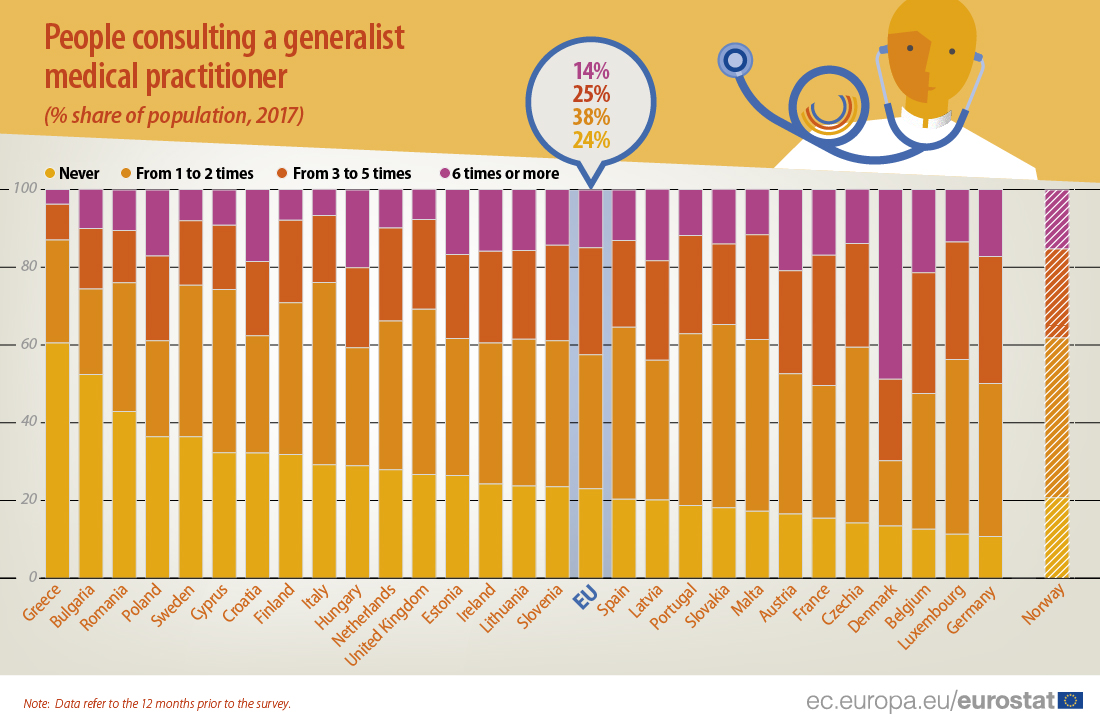
How often do you see a general practitioner?
In 2017, nearly four in ten people (38%) in the European Union (EU) went to see their generalist medical practitioner once or twice in the 12 months prior to the survey. A quarter (25%) consulted their generalist practitioner 3 to 5 times, while nearly another quarter (24%) did not go to see a generalist practitioner. 14% reported that they saw their generalist practitioner 6 times or more.
At EU level, the frequency of consultations of general medical practitioners was higher for women than for men. This was also the case for visits to dentists or general surgeons.
Denmark had the largest share of persons who saw their generalist practitioner 6 times or more (49%) during the previous 12 months, while France had the highest percentage of people (34%) going to the doctor 3 to 5 times. The share of persons consulting their doctor once or twice was largest in Slovakia (47%) and the share of persons who did not go to see the doctor was highest in Greece (61%).
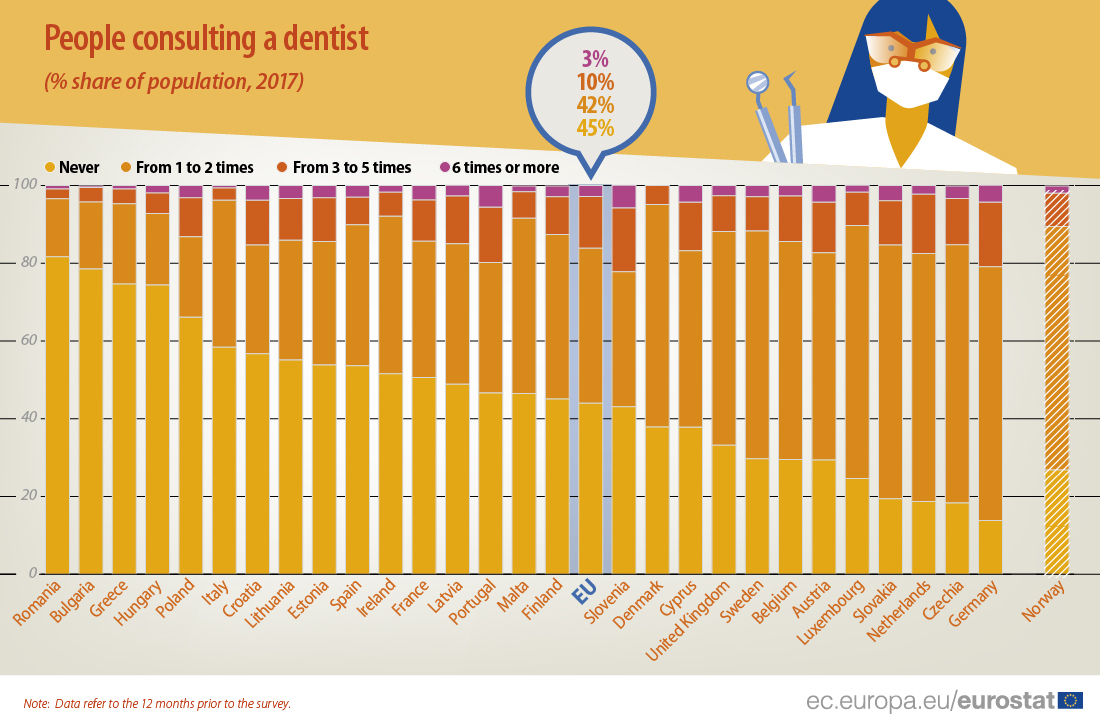
…a dentist?
45% of people in the EU did not consult a dentist in the 12 months prior to the survey, while 42% went once or twice to a dentist. 10% reported that they went to a dentist 3 to 5 times, and 3% 6 times or more.
Slovenia had the largest share of persons who went to the dentist 6 times or more (6%) during the previous 12 months, while Germany had the highest percentage of people (17%) going to the dentist 3 to 5 times. The share of persons who did not go to see the dentist was highest in Romania (82%).
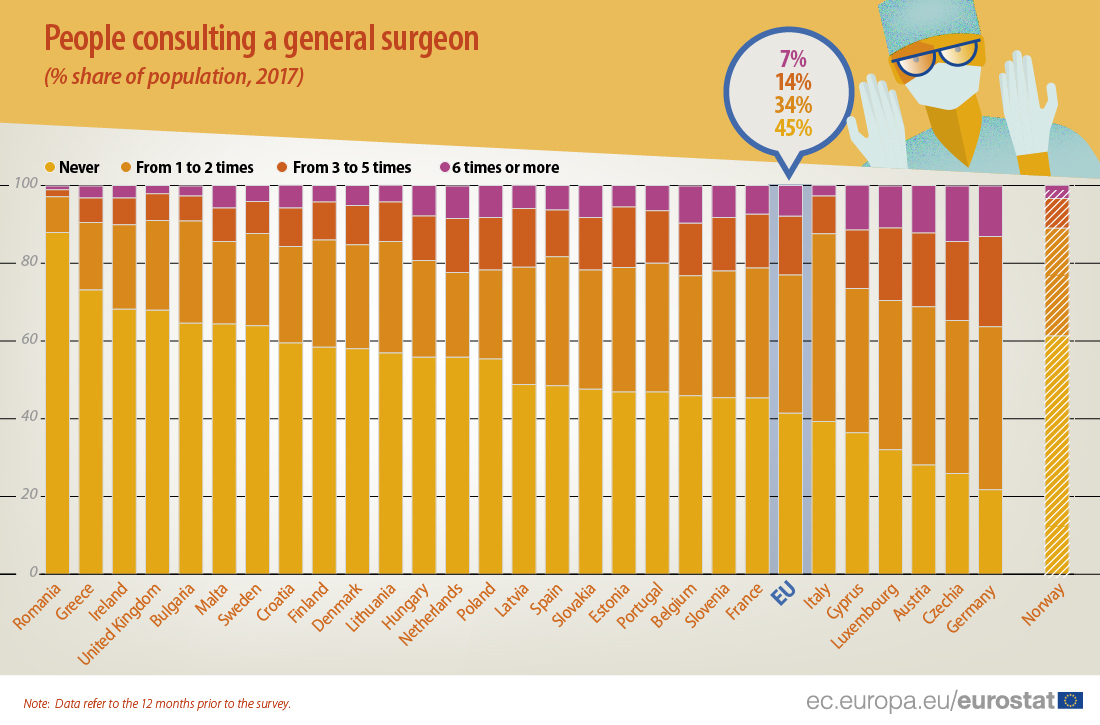
…a general surgeon?
While 45% of people in the EU did not consult a general surgeon in the 12 months prior to the survey, 34% did once or twice. 14% reported that they went to see a general surgeon 3 to 5 times, and 7% 6 times or more.
Germany had the largest share of people who consulted a general surgeon 3 to 5 times (23%). The share of persons who saw a general surgeon once or twice was largest in Italy (48%) and the share of persons who did not go to see a general surgeon was highest in Romania (88%).
The source dataset is accessible here.
To contact us: estat-user-support@ec.europa.eu.