Enlargement countries - labour market statistics
Data extracted in March 2024. Planned article update: March 2025.
Highlights
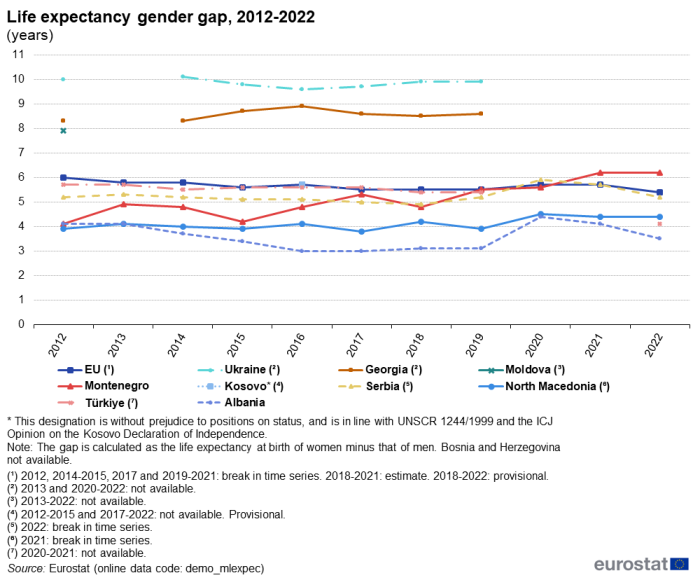
Montenegro had the widest life expectancy gender gap among the candidate countries and potential candidate in 2022, with newborn females expected to live on average 6.2 years longer than newborn males. This difference increased compared to 2012 when the gap was 4.1 years. In the EU the life expectancy gender gap was 5.4 years in 2022 (provisional data).
In 2022, the economic activity gender gap measured in the candidate countries and potential candidate was larger than in the EU, with the widest economic gender gap of 40.5 percentage points recorded in Türkiye.
Between 2012 and 2022, unemployment was higher for men than for women in North Macedonia for majority of the years, with a 0.8 percentage point lower rate for women in both 2012 and 2022.
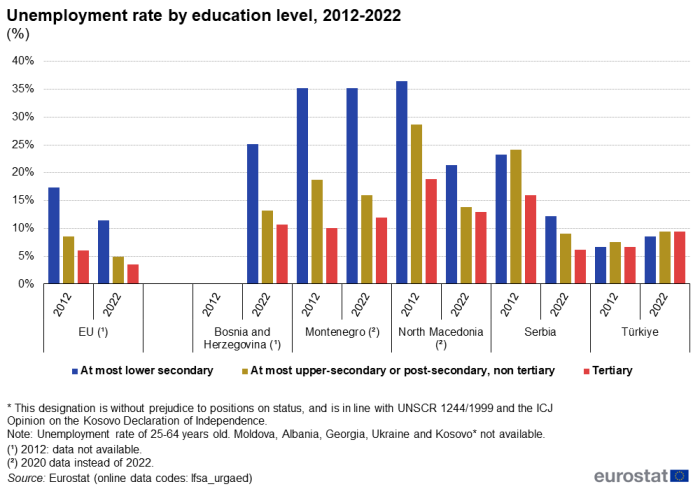
In Türkiye, which had the lowest unemployment rate of the candidate countries and potential candidate, there was no apparent correlation between the unemployment rate and the level of education. In 2012 the unemployment rates were 7% for low educated persons, 8% for medium educated and 7% for highly educated; in 2022 the unemployment rates were around 9 % for each of the three education levels.
This article is part of an online publication. It provides data on inequalities by gender, education and income in the candidate countries and potential candidate compared with the corresponding data for the European Union (EU).
The new candidate countries, Georgia, Republic of Moldova and Ukraine, are usually included in the set of articles covering the enlargement countries. However, for these articles only data which are submitted to and validated by Eurostat's subject matter units following the same process as data from Member States, are used. For Georgia, Moldova and Ukraine, data on economic activity gender gap, unemployment gender gap, unemployment rate by education level and inequality of income distribution are not yet transmitted this way and are therefore not available yet. However, these countries are also presented in the Statistics Explained articles for ENP-East countries, which are based on data supplied by and under the responsibility of the national statistical authorities of each country on a voluntary basis. Consequently, because of these separate processes, this inevitably leads to differences in data coverage between these two sets of articles.
Data shown for Georgia exclude the regions of Abkhazia and South Ossetia over which the government of Georgia does not exercise control. The data managed by the National Bureau of Statistics of the Republic of Moldova does not include data from the Transnistrian region over which the government of the Republic of Moldova does not exercise control. Since 2014, data for Ukraine generally exclude the illegally annexed Autonomous Republic of Crimea and the City of Sevastopol and the territories which are not under control of the Ukrainian government. Data on Ukraine for the year 2022 is limited due to exemption under the martial law from mandatory data submission to the State Statistics Service of Ukraine, effective as of 3 March 2022, following Russia’s war of aggression against Ukraine.
This article presents statistics on inequalities between men and women and between persons with different education level and income. Gender disparity is analysed with respect to life expectancy, activity rate and unemployment. The correlation between unemployment and education level is presented, as well as the distance between the highest and lowest income. These statistics highlight important issues with respect to equal opportunities for all and are relevant for monitoring and improving policies aiming to reduce inequalities in society. In addition to their relevance, the selection of indicators is based on data availability.
Full article
Life expectancy gender gap
Life expectancy at birth is the average number of years a newborn child can expect to live. The gender gap for life expectancy may reflect disparities between women and men with respect to living conditions and access to health services. The life expectancy gender gap is defined as the number of years that females can expect to live (at birth) less that of males and is expressed as percentage points (pp). Figure 1 presents the life expectancy gender gap for the candidate countries and potential candidate and the EU over the period from 2012 to 2022.
The life expectancy gender gap was higher than in the EU in Ukraine, Georgia, Moldova and Montenegro. While the gap in Montenegro was only slightly higher than in the EU (6.2 years compared to 5.4 years in 2022), newborn females were expected to live 9.9 years longer than males in Ukraine, 8.6 in Georgia (2019) and 7.9 in Moldova (2012, most recent data available).
In Kosovo [1] newborn females were expected to live 5.7 years longer than newborn males in 2016 (provisional; no data were available for the other years), exactly as in the EU in the same year.
In all other candidate countries and potential candidate, the life expectancy gender gap was lower than in the EU in 2022: 5.2 years in Serbia, 4.4 years in North Macedonia, 4.1 years in Türkiye and 3.5 years in Albania.
Throughout the period, the life expectancy gender gap was almost stable in most countries, while it grew considerably in Montenegro, from 4.1 years in 2012 to 6.2 years in 2022. In Albania, the life expectancy gender gap showed some fluctuations: it decreased from 4.1 years in 2012 to 3.0 years in 2016. After four years of stability, the gap widened to 4.4 years in 2020 and decreased again in the following years to reach 3.5 years in 2022.
The life expectancy gender gap decreased in the EU from 6.0 years in 2012 to 5.4 years in 2022 (provisional data), with fluctuations between 5.8 years (2013-2014) and 5.5 years (2017-2019) in-between.
Economic activity gender gap
The economic activity gender gap is calculated as the activity rate of men less the activity rate of women, where the activity rate is the percentage of active persons in relation to the total population. The active persons constitute the economically active population, which includes both employed and unemployed persons and excludes persons who are not working at all and not available or looking for work either, such as children, students, homemakers and pensioners.
Figure 2 shows the economic activity gender gap observed in the candidate countries and potential candidate and in the EU in the period from 2012 to 2022. Data for Moldova, Georgia, Albania, Ukraine and Kosovo were not available.
The economic activity gender gap measured in the candidate countries and potential candidate was wider than what was measured in the EU. In most countries the gap decreased during the observation period. In the EU the economic activity gap decreased gradually from 13.4 percentage points (pp) to 10.9 pp.
The widest economic gender gap was recorded in Türkiye, where the gap was 47.1 pp in 2012 and decreased gradually to 40.5 in 2022, with just a minor increase in 2020 compared to 2019. The figures are hence four times higher than the respective values in the EU.
Only data for the last two years were available for Bosnia and Herzegovina. The gap was 26.7 pp in 2021 and 27.4 pp in 2022.
In North Macedonia the gap fluctuated between 28.0 pp in 2012 and 24.3 pp in 2020 (last year for which data were available), with a peak at 28.9 pp in 2016.
Montenegro had fluctuations like North Macedonia but with lower values: the gap was 14.2 pp in 2012 and 14.7 pp in 2020 (last year for which data were available), with the tightest economic activity gap being 12.8 pp in 2015 and the widest gap being 16.1 pp in 2018.
In Serbia the gap decreased from 18.9 pp in 2012 to 14.6 pp in 2022.
Data for Albania, Georgia, Moldova, Ukraine and Kosovo were not available.
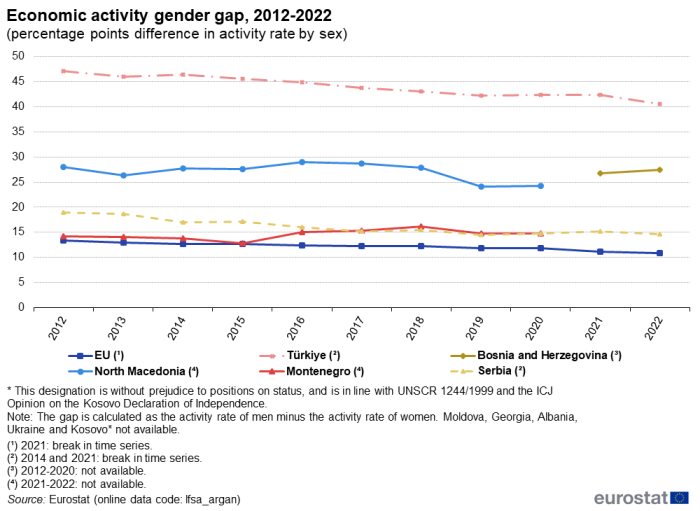
(percentage points difference in activity rate by sex)
Source: Eurostat (lfsa_argan)
Unemployment gender gap
The unemployment rate is calculated for the economically active population aged 20-64. The gender gap is obtained as the unemployment rate of women less the unemployment rate of men (percentage points difference in unemployment rate by sex). Positive values indicate a higher unemployment rate for women.
Figure 3 presents the unemployment gender gap observed in the candidate countries and potential candidate and in the EU in the period from 2012 to 2022. Data for Moldova, Georgia, Albania, Ukraine and Kosovo were not available.
Between 2012 and 2022, the unemployment gap fluctuated in most candidate countries and potential candidate and was in some cases negative (unemployment higher for men than for women), while it was quite stable and always slightly positive within a range between 0.3 and 0.6 in the EU.
Only data for 2021 and 2022 were available for Bosnia and Herzegovina and the unemployment gap was 7.9 pp in 2021 and 7.4 pp in 2022.
In Türkiye the gap value was positive throughout the observed period and fluctuated between a low of 1.9 pp in 2012 and a high of 4.8 pp in 2017. The gap value was 4.6 pp in 2022.
Fluctuations in Montenegro went between negative values of the gap (-1.2 pp in 2013, -0.4 pp in 2015 and -1.1 pp in 2016) and slightly positive values (0.3 pp in 2012 and 1.2 pp in 2022). Data for 2021 were not available.
In Serbia the unemployment gap narrowed from 1.9 pp in 2012 to 0.9 pp in 2022, with substantial fluctuations over the period and a peak value of 3.0 pp in 2013.
The unemployment gap was negative in seven of the ten years where data was available in North Macedonia with a value of -0.8 pp both in 2012 and 2022. The highest positive value was 2.1 pp in 2019. Data for 2021 were not available.
In the EU the gap was slightly positive and quite constant, ranging from 0.3 pp in 2012 and 0.2 pp in 2013 to a constant 0.6 pp from 2017 to 2022.
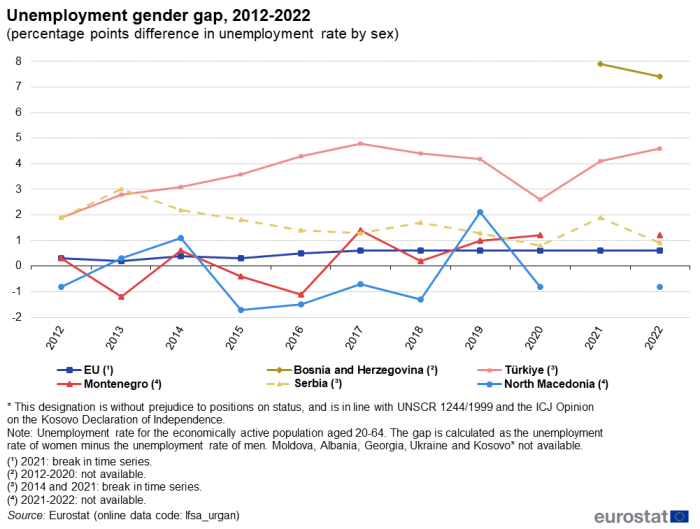
(percentage points difference in unemployment rate by sex)
Source: Eurostat (lfsa_urgan)
Unemployment rate by education level
Unemployment rate of 25-64 years old is analysed in Figure 4, by level of education of the unemployed persons in 2012 and in 2022. The levels of education considered are the three main aggregates of the International standard classification of education (ISCED): low (less than primary, primary and lower secondary), medium (upper secondary and post-secondary non tertiary) and high (tertiary) level of education. Data for Montenegro and North Macedonia refer to 2020, instead of 2022.
In general, the graph shows, with few exceptions, an inverse correlation between the level of education and unemployment: the higher the level of education, the lower the unemployment.
In 2022, in Bosnia and Herzegovina, the unemployment rate of persons with low education level was 25 %, which exceeds the sum of the unemployment rates for persons with medium and high education levels (respectively 13 % and 11 %). Data were not available for 2012.
In Montenegro the unemployment rate of persons with a low education level was 35 % both in 2012 and 2020 (last available data), while the rate for the medium education level decreased from 19 % to 16 % and the rate of unemployment for persons with high education level grew from 10 % to 12 %. The unemployment rates in 2020 were approximately three times higher than those recorded in the EU in 2022 for each level of education.
In North Macedonia there was a significant drop in the unemployment rate between 2012 and 2020 (last available data). It went from 36 % to 21 % for people with a low education level, it halved (from 29 % to 14 %) for persons with a medium education level and it decreased from 19 % to 13 % for persons with a high education level.
Serbia observed an even larger decrease in the unemployment rate, from an already lower level than North Macedonia in 2012 and approaching the EU level in 2022. Between 2012 and 2022 the fall in the unemployment rates by education level was as follows: from 23 % to 12 % for the low education level, from 24 % to 9 % for the medium level and from 16 % to 6 % for the high level.
Türkiye had the lowest unemployment rate between the candidate countries and potential candidate. In 2012 the rates for persons with a low education level was 7 %, the rate for a medium education level was 8 % and for a high education level the rate was 7 %; the rates for low and medium educational levels were even lower than in the EU. The unemployment rate was slightly higher in 2022 at around 9 % for all three educational levels. Thus, there was no apparent correlation in Türkiye between the unemployment rate and the level of education.
In the EU, the unemployment rates came down between 2012 and 2022 as follows: from 17 % to 11 % for low education level; from 9 % to 5 % for medium education level; from 6 % to 4 % for high education level.
Data for Bosnia and Herzegovina, Moldova, Georgia, Albania, Ukraine and Kosovo were not available.
Inequality of income distribution
The income quintile share ratio, also known as S80/S20 ratio, is a measure of inequality of income distribution. It is calculated as the ratio of total income received by the 20% of the population with the highest income (the top quintile) to that received by the 20 % of the population with the lowest income (the bottom quintile).
Figure 5 presents the trend of the S80/S20 ratio in the candidate countries and potential candidate and in the EU over the period 2012-2022. In general, it shows a reduction of the inequalities in the candidate countries and potential candidate, while in the EU the ratio remained more or less stable at around 5 (4.98 in 2012 and 4.74 in 2022).
Only 2018 data were available for Kosovo and reported the highest ratio observed: 15.58.
In Türkiye the indicator fluctuated around the value of 9 (almost double compared to the EU). It was 9.33 in 2012 and 8.80 in 2021, which was the highest value recorded in the candidate countries and potential candidate in the last two years.
In North Macedonia the ratio fell from 10.20 in 2012 to 5.92 in 2020.
Only data from 2017 to 2021 were available for Albania. They showed a reduction from 7.47 to 5.72.
Inequality decreased in Montenegro from a ratio 8.54 in 2013 to 5.58 in 2022.
In Serbia the ratio first increased from 8.59 in 2013 to 11.02 in 2016 and then decreased rapidly to 5.54 in 2022.
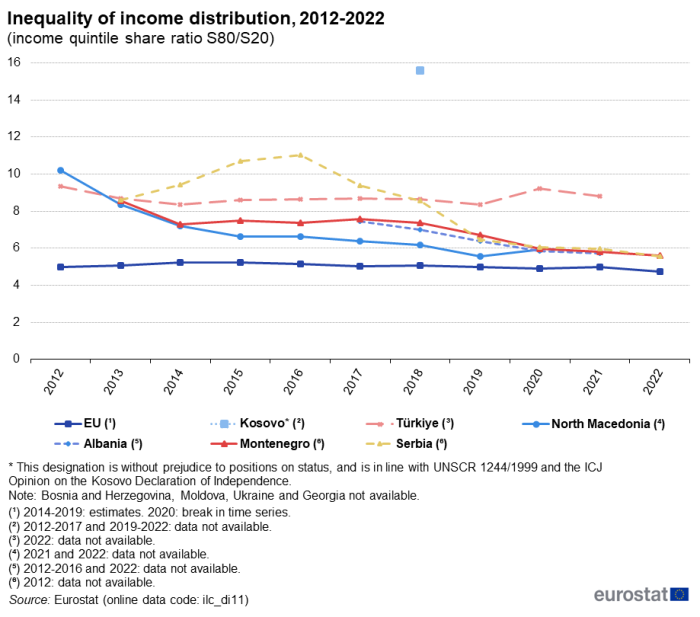
(income quantile share ratio S80/S20)
Source: Eurostat (ilc_di11)
Source data for tables and graphs
Data sources
The data used in this article are derived from EU statistics on income and living conditions (EU-SILC), data which are compiled annually and are the main source of statistics that measure income and living conditions in Europe.
EU-SILC is an instrument that aims to collect timely and comparable data on income, poverty, social inclusion and living conditions, in both monetary and non-monetary terms. The data are generally collected for private households and household members. EU-SILC provides both cross-sectional data and longitudinal data (typically over a four-year period).
The legal basis for this data collection exercise is Regulation (EU) 2019/1700 of the European Parliament and of the Council of 10 October 2019 establishing a common framework for European statistics relating to persons and households, based on data at individual level collected from samples (Integrated European Social Statistics – IESS).
Information concerning the current statistical legislation on income and living conditions can be found on Eurostat.
Context
This article presents a selection of indicators relevant to analysing inequalities between different sections of society, based on the policy relevance of the indicators as well as the availability of data. The indicators presented highlight in particular differences in the situation between women and men (i.e. gender gaps) with respect to life expectancy, opportunities in the labour market and in the opportunities to obtain a basic education at least.
The main policy framework in this field is the EU’s strategic agenda 2019-2024. The open method of coordination (Social OMC) for social protection and social inclusion aims to promote social cohesion and equality through adequate, accessible and financially sustainable social protection systems and social inclusion policies.
Through the Social OMC – and in collaboration with the Social Protection Committee – the EU provides a framework for national strategy development for social protection and social investment, as well as for coordinating policies between EU countries on issues relating to:
While basic principles and institutional frameworks for producing statistics are already in place, the candidate countries and potential candidate are expected to increase the volume and quality of their data progressively and to transmit these data to Eurostat in the context of the EU enlargement process. EU standards in the field of statistics require the existence of a statistical infrastructure based on principles such as professional independence, impartiality, relevance, confidentiality of individual data and easy access to official statistics; they cover methodology, classifications and standards for production.
Eurostat has the responsibility to ensure that statistical production of the candidate countries and potential candidate complies with the EU acquis in the field of statistics. To do so, Eurostat supports the national statistical offices and other producers of official statistics through a range of initiatives, such as pilot surveys, training courses, traineeships, study visits, workshops and seminars, and participation in meetings within the European Statistical System. The ultimate goal is the provision of harmonised, high-quality data that conforms to European and international standards.
Additional information on statistical cooperation with the enlargement countries is provided in the Statistics explained background article Enlargement policy and statistical cooperation.
Direct access to
- Candidate countries and potential candidates — statistical overview — online publication
- Statistical cooperation — online publication
- National accounts and GDP — online publication
- Statistical books/pocketbooks
- Key figures on enlargement countries — 2019 edition
- Key figures on enlargement countries — 2017 edition
- Key figures on the enlargement countries — 2014 edition
- Factsheets
- Basic figures on the candidate countries and potential candidates — Factsheets — 2023 edition
- Basic figures on Western Balkans and Türkiye — Factsheets — 2022 edition
- Basic figures on enlargement countries — Factsheets — 2021 edition
- Leaflets
- Basic figures on enlargement countries — 2020 edition
- Basic figures on enlargement countries — 2019 edition
- Basic figures on enlargement countries — 2018 edition
- Basic figures on enlargement countries — 2016 edition
- Labour market (labour), see:
- LFS series - detailed annual survey results (lfsa) (ESMS metadata file — lfsa_esms)
Notes
- ↑ This designation is without prejudice to positions on status, and is in line with UNSCR 1244/1999 and the ICJ Opinion on the Kosovo Declaration of Independence.
