Archive:Youth unemployment
Data extracted in August 2022.
Planned article update: September 2023.
Highlights
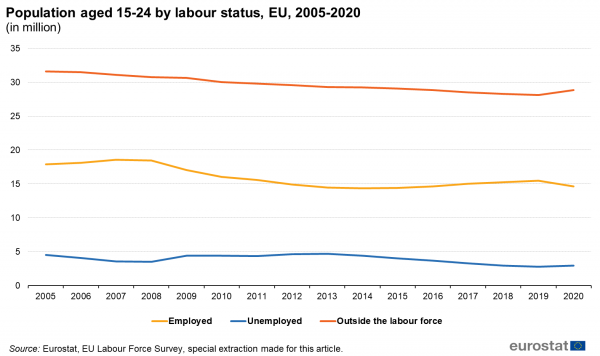
Population aged 15-24 by labour status, EU, 2005-2020
This article reports on unemployment of young people aged 15 to 29 in the European Union (EU), its Member States, three EFTA countries (Iceland, Norway and Switzerland) and one candidate countries (Serbia). It explains how unemployment rates of this age category are affected by the transition of young adults from formal education to labour market.
Young people, according to the United Nations definition, refer for statistical purposes to the age group 15-24. However, the age category 15-29 also deserves attention as it is considered the reference in the Year of Youth context. For this reason, the current article presents information specifically for young people aged 15-29.
Two factors are particularly relevant. First, the majority of 15-19 year olds are predominantly in formal education and there is a steep rise in participation in the labour market between the ages of 15 and 29. Second, young people in formal education are sometimes also employed or unemployed, so there is an overlap between the education and the labour market.
This article is a supplement to a companion article called "Participation of young people in education and the labour market" which further develops on the interplay between formal education and labour market participation. The latest monthly Eurostat data on youth unemployment can be found in the article Unemployment statistics. For annual results, visit the article Unemployment statistics and beyond. An analysis of the regional aspects of youth unemployment is provided in the chapter Labour market statistics at regional level in Eurostat regional yearbook.
Full article
Definition of unemployment and youth unemployment indicators
A person's labour force status falls into one of three categories: employed, unemployed or outside the labour force. Eurostat follows the employment and unemployment definitions from the International Labour Organisation (ILO). The labour force, which may also be referred to as the active population, consists of employed and unemployed persons. An employed person is a person aged 15 to 89 who during the reference week for the survey performed work, even if just for one hour, for pay, profit or family gain, or had a job or business from which they were temporarily absent due to illness, holiday, industrial dispute or education and training. On the other hand, an unemployed person is not employed, is currently available for work and actively seeking work. A thorough explanation of these concepts is available in an article on the EU-LFS methodology.
The same definitions apply to young people as to any other age group. In 2021, 71.0 million young people aged 15-29 resided the EU. Among them, 33.6 million were employed, and 5.0 million were unemployed. As those two groups offer their work in the labour market, they are considered part of the so-called labour force. Alternately, the remaining 32.4 million who are neither employed, nor unemployed comprised the group of people outside the labour force.
Figure 1 shows the long-term trend of the share of young people according to their labour status over the period from 2009 to 2021. Over that period, the consequences of two global crises are visible: the financial and economic crisis of the late 2000s and the more recent crisis triggered by the COVID-19 pandemic. Both crises caused a decrease in employment. However, the decrease in employment during the financial and economic crisis led primarily to an increase in unemployment (see years 2009 to 2013). By contrast, the decrease in employment during the COVID-19 crisis in 2020 was accompanied by a much higher increase in the proportion of people outside the labour force than in unemployment.
People are classified as being employed or unemployed irrespective of whether they are in formal education or not. In other words, Eurostat unemployment statistics, in line with ILO standards, do not exclude students from unemployment just because they are students. The same criteria that apply to the rest of the population also apply to them. This means that whether someone is in formal education or not is irrelevant for his/her status regarding employment or unemployment. However, participation in education of the population as a whole has an indirect effect on youth unemployment indicators.
The main indicator of youth unemployment is the youth unemployment rate for the age group 15-24 or 15-29. This uses the same standard definition as the unemployment rate for the working-age population. For a given age group, it is the number of those unemployed divided by the total number of people in the labour force (employed plus unemployed). In the EU in 2021, there were 5.0 million unemployed persons aged 15-29 and 38.6 million persons of that age group in the labour force, according to the EU Labour Force Survey. This gives a youth unemployment rate of 13.0 %.
Given that not every young person is in the labour force, the youth unemployment rate does not reflect the proportion of young adults who are unemployed among all young people. Youth unemployment rates are frequently misinterpreted in this sense. For example, when the youth unemployment rate equals 25 %, it does not mean that 'one quarter of the whole young population is unemployed' but it means that among the young people in the labour force, so either employed or unemployed, one quarter is unemployed and three quarters are employed. Young people outside the labour force are not included (or not taken into account) in this rate, they are neither in the numerator nor in the denominator. Also, the youth unemployment rate may be high even if the number of unemployed persons is limited, the rate depending on the number of young persons who are employed. This issue is not present for the unemployment rate of the whole working age population due to the higher participation of that population in the labour market.
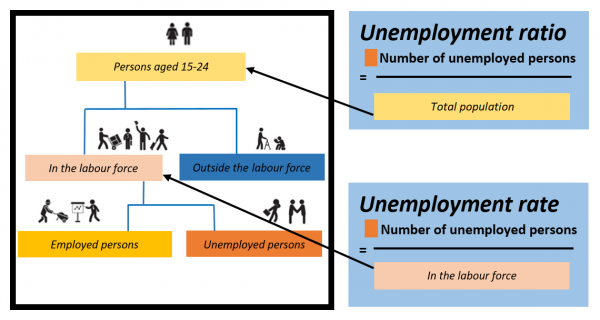
Another indicator of youth unemployment published by Eurostat is the youth unemployment ratio. This has the same numerator as the youth unemployment rate, but the denominator is the total population aged 15 to 29. It thus gives an unemployment-to-population measure. The size of the young labour force only triggers minor effects in the youth unemployment ratio, contrary to the unemployment rate.
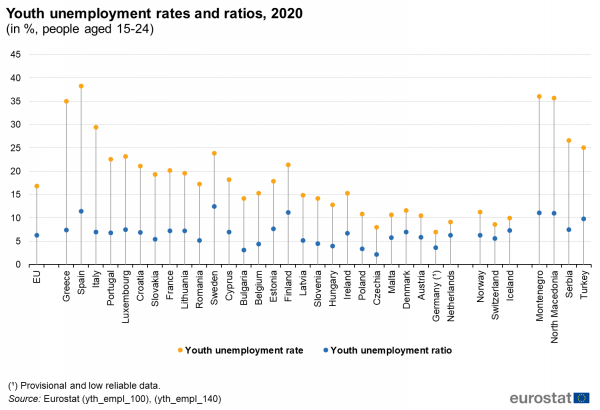
In 2021, in the EU there were 71.0 million persons aged 15-29, of whom 5.0 million were unemployed. This gives a youth unemployment ratio of 7.1 %. Figure 2 shows youth unemployment rates alongside youth unemployment ratios for 2021 for each country. Data is based on the EU labour force survey.
The youth unemployment ratio is by definition always smaller than the youth unemployment rate, typically around half of it. This difference is entirely due to the different denominators. However, it is worth noticing that in some countries the values of the rate and ratio are closer to each other than in others, meaning that in some instances young people in the labour force overlap more closely with the total population of the same age. See for example Austria, Czechia, Germany, Malta and the Netherlands, where the difference between the youth unemployment rate and the youth unemployment ratio is less than 3.0 percentage points. By contrast, this difference exceeds 13.0 percentage points in Greece, Spain and Italy.
Figure 3 below shows the different denominators involved in the calculation of the youth unemployment rate and youth unemployment ratio. As can be seen, both indicators use the same numerator but the denominators differ.
Young persons' participation in the labour force
As explained above, the unemployment rate and unemployment ratio differ because the unemployment rate includes in the denominator only the part of the population that is in the labour force. There is also a strong link between labour force participation and educational status, which becomes particularly clear when looking at young people's situation at different ages. This section analyses this issue in detail.
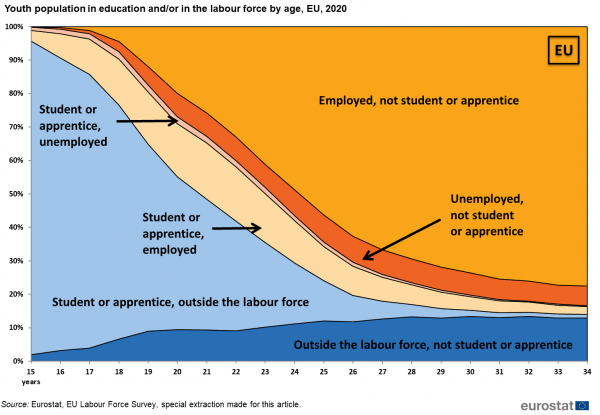
At 15 years of age, nearly 100 % of the population in the EU and its Member States are still at school. As the young grow older, many move into the labour force, becoming employed or unemployed, or remain outside the labour force. Not all young people make this transition at the same age, so there is a gradual rise in the number of young people in the labour force.
Figure 4 below shows the proportion of young people in formal education and/or in the labour force at each year of age (data for EU, 2020). All those who state they have been in formal education or training during the previous four weeks are considered as being a student or apprentice and are represented by a light colour shade (light blue or light orange). Those not in formal education are coded in a darker colour shade. Each colour corresponds to a labour status (orange for employed, red for unemployed, and blue for outside the labour force). As can be seen from Figure 4, there is a steep rise in the labour force participation (dark and light orange and red), from 4.4 % at age 15 to 70.7 % at age 24. This steep increase explains the difference between the youth unemployment rates and youth unemployment ratios, introduced in the previous section. This is a distinctive feature of the young population and it has no equivalent at other ages, except for the gentle decrease in labour participation by older workers as they retire.
Figure 4 is based on EU-LFS data and it counts all those who state they have been in formal education or training during the previous four weeks as being in education, and does not include people who participated exclusively in non-formal training sessions such as attending a course, a seminar or taking private lessons.
A second feature in Figure 4 is that many young people join the labour force before they finish their studies or they participate in formal education while already in the labour force. This means that people can be simultaneously in education and in the labour force. (It is noted that participation in the labour force, according to ILO definitions, occurs by working as little as 1 hour in the week, or looking and being available for such work). Otherwise said, those in formal education and those in the labour force are not always different groups as an overlap exists between the two groups. The transition from education to the labour market is not a simple switch of status but a complex overlap of different situations. This is developed further in the article Participation of young people in education and the labour market.
Source data for tables and graphs
Data sources
Source: The European Union Labour Force Survey (EU-LFS) is the largest European household sample survey providing quarterly and annual results on labour participation of people aged 15 and over as well as on persons outside the labour force. It covers residents in private households. Conscripts in military or community service are not included in the results. The EU-LFS is based on the same target populations and uses the same definitions in all countries, which means that the results are comparable between the countries.
Reference period: Yearly results are obtained as averages of the four quarters in the year.
Coverage: The results from the survey currently cover all European Union Member States, the EFTA Member States of Iceland, Norway, Switzerland, as well as the candidate countries Montenegro, North Macedonia, Serbia and Turkey. For Cyprus, the survey covers only the areas of Cyprus controlled by the Government of the Republic of Cyprus.
European aggregates: EU refers to the sum of 27 EU Member States. If data are unavailable for a country, the calculation of the corresponding aggregates takes into account the data for the same country for the most recent period available. Such cases are indicated.
Country note: In Germany, since the first quarter of 2020, the Labour Force Survey (LFS) has been integrated into the newly designed German microcensus as a subsample. Unfortunately, for the LFS, technical issues and the COVID-19 crisis has had a large impact on the data collection processes, resulting in low response rates and a biased sample. Changes in the survey methodology also led to a break in the data series. The published German data are preliminary and may be revised in the future. For more information, see here.
Country codes: Belgium (BE), Bulgaria (BG), Czechia (CZ), Denmark (DK), Germany (DE), Estonia (EE), Ireland (IE), Greece (EL), Spain (ES), France (FR), Croatia (HR), Italy (IT), Cyprus (CY), Latvia (LV), Lithuania (LT), Luxembourg (LU), Hungary (HU), Malta (MT), the Netherlands (NL), Austria (AT), Poland (PL), Portugal (PT), Romania (RO), Slovenia (SI), Slovakia (SK), Finland (FI), Sweden (SE), Montenegro (ME), North Macedonia (MK), Serbia (RS) and Turkey (TR).
Definitions: The concepts and definitions used in the survey follow the guidelines of the International Labour Organisation.
Employed persons are persons aged 15 years and over who, during the reference week performed work, even for just one hour a week, for pay, profit or family gain or who were not at work but had a job or business from which they were temporarily absent because of something like, illness, holiday, industrial dispute or education and training.
Unemployed persons are persons aged 15-74 who were without work during the reference week, but who are currently available for work and were either actively seeking work in the past four weeks or had already found a job to start within the next three months.
The labour force comprises employed and unemployed persons. People outside the labour force are those classified neither as employed nor as unemployed.
People in education in this article refers to people in formal education during the four weeks preceding to the interview. Formal education and training is defined by UNESCO as ‘education that is institutionalised, intentional and planned through public organisations and recognised private bodies and — in their totality — constitute the formal education system of a country [1].
Non-formal education and training, i.e. any organised and sustained learning activities outside the formal education system are excluded from the analyses of this article. For further information on participation in non-formal education and training see the article on adult learning statistics.
Different articles on detailed technical and methodological information are available through: EU labour force survey.
Context
Young people are a priority for the European Union’s social vision, and the COVID-19 crisis further highlighted the need to sustain the young human capital.
The European Pillar of Social Rights sets out 20 key principles and rights essential for fair and well-functioning labour markets and social protection systems. Principle 4 (‘Active support to employment’) states that ‘young people have the right to continued education, apprenticeship, traineeship or a job offer of good standing within four months of becoming unemployed or leaving education’.
In 2012, a specific Youth employment package was launched, which led to an increased focus on providing quality traineeships and apprenticeships for young people and called for the introduction of a ‘Youth guarantee’, designed to ensure that all young people up to the age of 25 should receive a quality job offer, continued education, an apprenticeship or a traineeship within four months of leaving formal education or becoming unemployed. In 2013, the ‘Youth employment initiative’ was launched: it was designed to specifically support young people not in education, employment and training in regions where the youth unemployment rate was over 25 %.
In October 2020, all EU countries have committed to the implementation of the reinforced Youth guarantee in a Council Recommendation which steps up the comprehensive job support available to young people across the EU and makes it more targeted and inclusive, also when it comes to the challenges caused by the COVID-19 pandemic.
Direct access to
- All articles on labour market
- Participation of young people in education and the labour market (background article)
- Education and training statistics introduced
- Unemployment statistics and beyond
- Employment - annual statistics
- People outside the labour force
- Labour market in the light of the COVID 19 pandemic — online publication
- EU Labour Force Survey — online publication
- Labour market in the light of the COVID 19 pandemic — online publication
- EU Labour Force Survey — online publication
- Youth in Europe
- Labour force survey in the EU, EFTA, United Kingdom and candidate countries — Main characteristics of national surveys, 2019, 2021 edition
- Quality report of the European Union Labour Force Survey 2019, 2021 edition
- ↑ International Standard Classification of Education 2011, paragraph 36, page 11.


