Agri-environmental indicator - livestock patterns
Data from January 2023.
Planned update: 26 January 2026 (with data from the Farm Structure Survey 2023).
Highlights
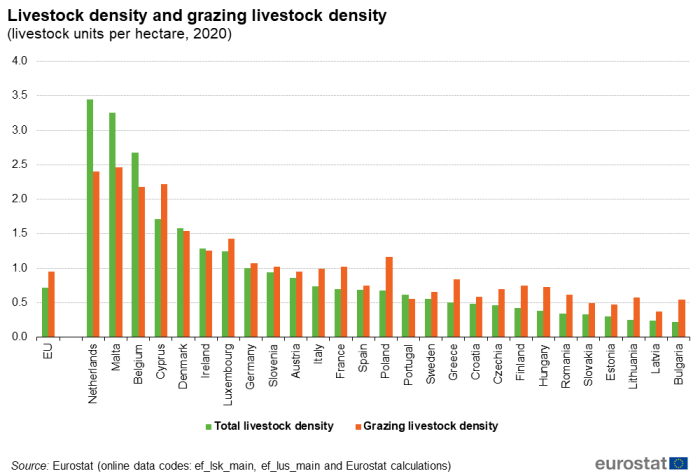
In 2020, average livestock density in the EU was 0.7 livestock units per hectare (LSU per ha) of agricultural area and ranged from 0.2 LSU per ha in Bulgaria, Latvia and Lithuania to 3.4 LSU per ha in the Netherlands.
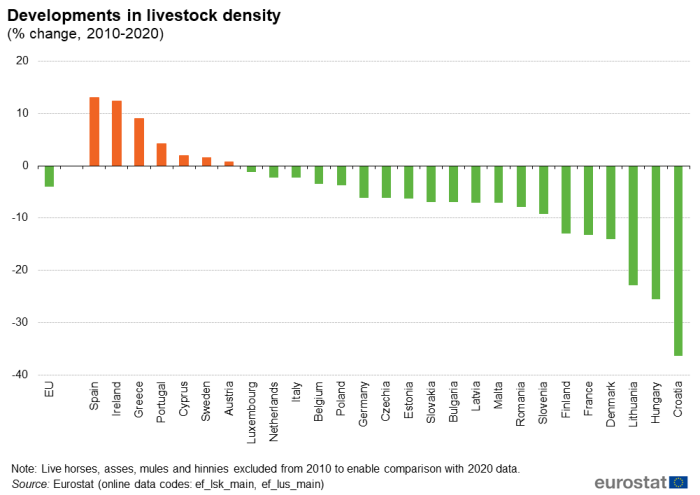
Between 2010 and 2020, the vast majority of EU countries lowered their livestock densities. The sharpest rates of reduction were in Croatia (-36.3%) and Hungary (-25.6%). The main exceptions were noted in Greece (+9.0%), Ireland (+12.4%) and Spain (+13.0%).
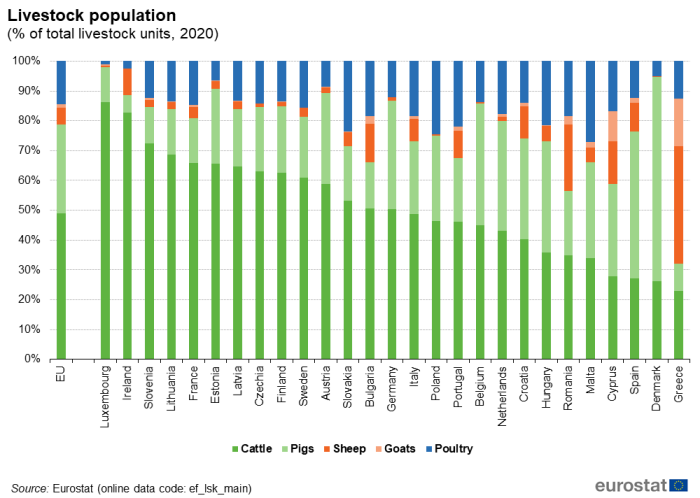
Almost half of the EU's livestock population (as measured in livestock units) in 2020 was cattle, about 30% was pigs and about 15% was poultry.
The number of farms with livestock fell sharply between 2010 and 2020, continuing a long downward trend. The share fell from 55.7% of all farms in 2010 to 44.9% in 2020.
Livestock density, EU, 2020
This article provides a fact sheet of the European Union (EU) agri-environmental indicator livestock patterns. It consists of an overview of data, complemented by information needed to interpret these data. This article on livestock patterns in the EU is part of a set of similar fact sheets, providing a comprehensive picture of the integration of environmental concerns into the Common Agricultural Policy (CAP).
Livestock patterns are defined as trends in the share of major livestock types (cattle, sheep, goats, pigs and poultry) and in the density of livestock units (LSU) on agricultural land.
Full article
Livestock density at EU level in 2020
The livestock density index gives an indication of the pressure that livestock farming places on the environment. In 2020, the livestock density in the EU was 0.7 livestock units (LSU) per hectare of utilised agricultural area (UAA). This was slightly lower than the corresponding ratio from the Agricultural Census of 2010.
The grazing livestock density index gives an indication of the environmental pressure of livestock grazing on fodder area, which consists of fodder crops grown on arable land as well as permanent grassland. The livestock counted as grazing animals are cattle, sheep and goats. For the EU as a whole, the grazing livestock density in 2020 dipped to 0.9 LSU of grazing livestock per hectare of fodder area (Figure 1).
(livestock units per hectare, 2020)
Source: Eurostat (ef_lsk_main), (ef_lus_main)
Livestock density at country level in 2020
The Netherlands had the highest livestock density of EU countries
Three countries had much higher livestock densities than any others (see Figure 1). The Netherlands remained the EU country with the highest livestock density (3.4 LSU/ha) in 2020. Malta and Belgium also reported high livestock densities (3.3 and 2.7 LSU/ha respectively). No other EU country had a density above 1.7 LSU/ha.
Malta had the highest density of grazing livestock in 2020 (2.5 grazing LSU/ha fodder area), closely followed by the Netherlands (2.4 LSU/ha fodder area). Cyprus and Belgium both had grazing livestock densities of 2.2 LSU/ha of fodder area, the only other EU countries with a ratio above 1.5 LSU/ha of fodder area.
The lowest total livestock densities among the EU Member States in 2020 were recorded in Bulgaria, Latvia and Lithuania (all 0.2 LSU/ha), followed by Estonia, Slovakia and Romania (all 0.3 LSU/ha).
In the majority of EU Member States, the grazing livestock density was higher than total livestock density with exceptions in Malta, the Netherlands and Belgium, as well as Denmark, Ireland and Portugal.
Between 2010 and 2020, there was a general trend of reduced livestock densities (see Figure 2). Across the EU as whole, the livestock density fell by 4.0 % between 2010 and 2020. A majority of EU countries recorded lower densities, the sharpest falls being recorded for Lithuania (-22.9 %), Hungary (-25.6 %) and Croatia (-36.3 %). However, there were higher densities in a few EU countries during this period, the sharpest rises being in Greece (+9.0 %), Ireland (+12.4 %) and Spain (+13.0 %).
(% change, 2010-2020)
Source: Eurostat (ef_lsk_main), (ef_lus_main)
Livestock density at regional level in 2020
Strong concentration of livestock in the regions of south and central Netherlands and the bordering regions of Germany and north Belgium
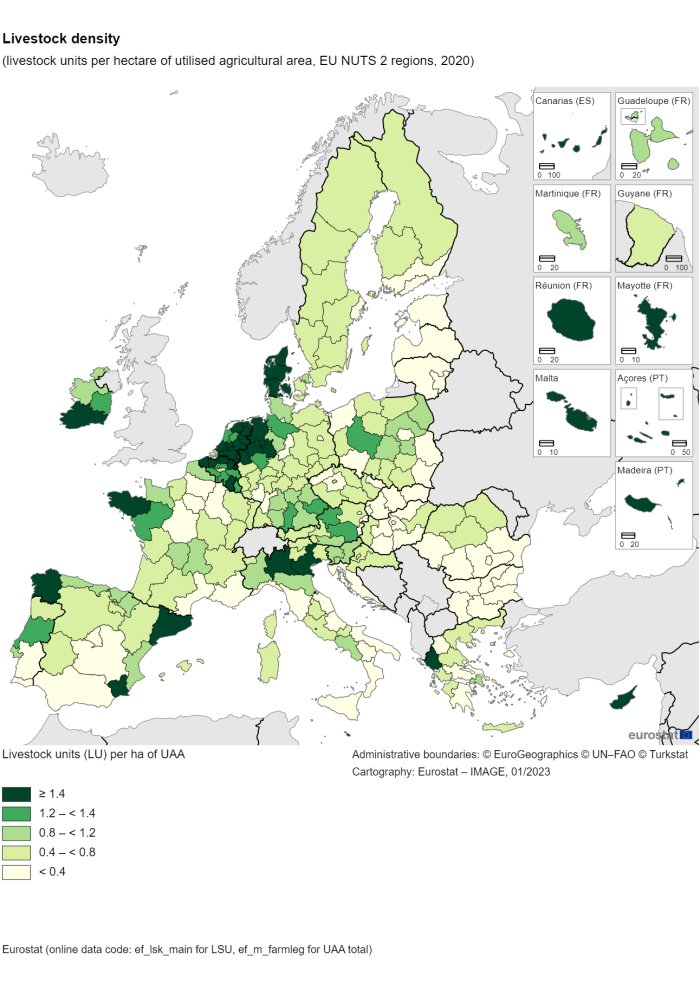
From a regional perspective, the highest livestock densities were reported in a cluster of regions in south and central Netherlands, north Belgium and west Germany. In the Netherlands, Nord-Brabant (7.4 LSU/ha), Limburg (6.7 LSU/ha), Gelderland (5.0 LSU/ha), Overijssel (4.5 LSU/ha) and Utrecht (3.5 LSU/ha) reported the highest livestock densities. These densities were all slightly lower than were calculated for 2010. In Belgium, the livestock density was highest in West-Vlaanderen (6.2 LSU/ha), Antwerpen (6.1 LSU/ha) and Oost-Vlaanderen (3.5 LSU/ha). In West-Vlaanderen and Antwerpen, the densities in 2020 were slightly higher than in 2010, but lower in Oost-Vlaanderen. In Germany, the Münster and Weser-Ems had the highest densities (both 3.4 LSU/ha).
There were also no other comparable geographical clusters of regions with high livestock densities. The only other regions to have a density above 3.0 LSU/ha were Malta (3.3 LSU/ha, which at NUTS2 level is a single region) and Cataluña in Spain (3.0 LSU/ha, up sharply from the density of 2.4 LSU/ha in 2010). Other individual regions, like Bretagne in France, Lombardia in Italy, Galicia and Murcia in Spain and Madeira in Portugal, as well as Limburg in Belgium and Friesland in the Netherlands also had livestock densities that ranged between 2.2 LSU/ha and 2.7 LSU/ha.
By contrast, many of the lowest livestock densities were registered in regions with capital cities such as Vienna, Paris, Bucharest, Budapest, Helsinki and Stockholm.
(livestock units per hectare of utilised agricultural area, EU NUTS 2 regions, 2020)
Source: Eurostat (ef_lsk_main), (ef_lus_main)
Focus on the structure of the livestock population
The total number of livestock units in the EU declined by 6 million between 2010 and 2020, although the relative structure of the livestock population was broadly unchanged
In 2020, there was a total of 113 million livestock units (LSU) in the EU. About half (48.9 %) were cattle, 30.0 % were pigs and about one-seventh (14.5 %) were poultry. Despite the decline in livestock units from 119 million in 2010 (adjusted to exclude equidae like live horses and donkeys), the relative structure of the EU livestock population in 2020 was broadly the same as in 2010.
In absolute terms, France had the highest number of total livestock units in 2020 (19.0 million LSU), followed by Spain (16.6 million LSU), Germany (16.3 million LSU), Poland (10.0 million LSU) and Italy (9.3 million LSU). All other EU countries were in the range down from 6.3 million LSU in the Netherlands to 32 000 LSU in Malta.
Almost half of the livestock population in the EU in 2020, as measured by livestock units, were cattle
There were more cattle (in terms of LSU) than any other type of livestock in the vast majority of EU countries and they accounted for a majority of total LSU in 14 EU countries. Indeed, national livestock populations were dominated by cattle in Luxembourg (86.2 % of total LSU), Ireland (82.7 %), Slovenia (72.5 %) and Lithuania, France, Estonia and Latvia (all about two-thirds of their respective LSUs). By contrast, less than one-quarter of the livestock population in Greece was accounted for by cattle (see Figure 3).
Pigs accounted for about two-thirds (68.5 %) of the livestock population in Denmark in 2020 and about half (49.2 %) of the livestock population in Spain. Pigs also accounted for more than one-third of the livestock populations of Belgium (40.8 %), Hungary (37.3 %), the Netherlands (36.8 %), Germany (36.3 %) and Croatia (33.7 %). As well as Denmark and Spain, pigs were also the largest livestock category in Cyprus (31.0 % of total LSUs). By contrast, pigs accounted for less than 10% of total livestock in Greece (9.2 %) and Ireland (6.0 %).
Poultry accounted for the third largest share of the livestock population in most EU countries and sheep accounted for the largest share in Greece
Poultry was the third most numerous category of livestock in a majority of the EU Member States. The highest share of poultry within a national livestock population was in Malta (27.1 %). There were a number of other countries where poultry represented more than one-fifth of the national livestock population, these were Poland (24.6 %), Slovakia (23.5 %), Portugal (21.9 %) and Hungary (21.4 %). It should be noted that there was a considerable structural change in the livestock population in Hungary, poultry accounted for 40.3 % of the national livestock population in 2010 with 1.0 million poultry LSU, a figure that declined to 0.4 million poultry LSU in 2020.
Greece was the only country where sheep constituted the largest category of livestock (a 39.4 % share of the total). The next highest shares were in Romania (22.2 %) and Cyprus (14.3 %). In 22 EU countries the share of sheep in the total livestock population was less than 10 %.
Goats were a relatively small part of the overall livestock population of most EU countries. Only in Greece (16.1 %) and Cyprus (10.1 %) were the shares above 3 % of total LSUs in 2020.
Focus on the agricultural holdings with livestock in 2020
About 45 % of agricultural holdings in the EU kept livestock
There were 4.1 million agricultural holdings (farms) with livestock in the EU in 2020 out of a total of 9.1 million farms, the equivalent of 44.9 % of all farms. This share was much lower than in 2010 (55.7 %), reflecting a sharper rate of decline (-39.3 %) from the the loss of 2.6 million livestock farms than the rate of decline (-24.8 %) from the overall loss of 3.0 million farms (see Figure 4).
In Ireland, about nine in ten farms kept livestock in 2020
As many as nine in ten farms (91.2 %) in Ireland kept livestock in 2020, a rate almost unchanged from that in 2010. This was a substantially higher share than that of any other EU country. The next highest were recorded in Luxembourg (72.3 %) and Austria (70.9 %), with a further jump down to Romania (62.5 %), Slovenia (60.8 %) and Belgium (60.7 %).
By contrast, less than 30 % of farms kept livestock in Finland (26.0 %), Cyprus (23.9 %), Greece (23.4 %), Malta (22.9 %), Spain (18.5 %) and Italy (16.9 %).
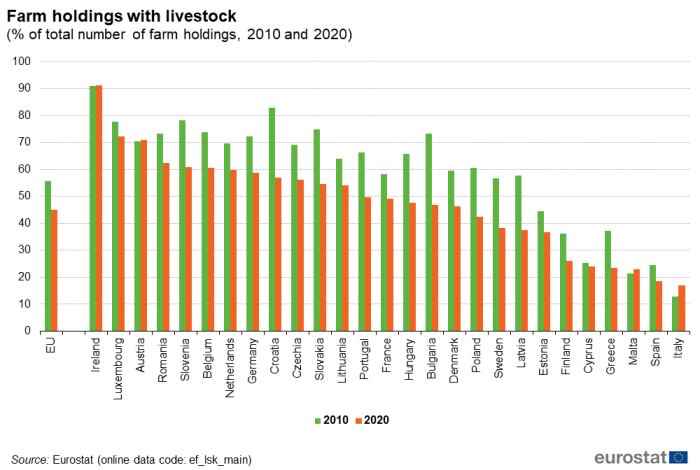
(% of total number of farm holdings, 2010 and 2020)
Source: Eurostat (ef_lsk_main)
The number of agricultural holdings as a whole and those with livestock both fell sharply between 2010 and 2020 in most EU countries
In all EU countries the total number of farms and the number of farms with livestock declined between 2010 and 2020, with the exception of Czechia (where an increase in 470 farms with livestock was part of a broader increase of 6 050 farms). As with the EU as a whole, the rate of decline in farms with livestock was faster than the rate for all farms as a whole in most EU countries. This was arguably clearest in Latvia, where the rate of decline in farms with livestock between 2010 and 2020 (-46.2 %) was more than twice as fast as the rate for all farms (-17.3 %). Italy was one of the few EU countries where the rate of decline in farms with livestock (-7.3 %) was much less than that of all farms (-30.1 %).
The sharpest declines in the number of farms with livestock were calculated for Bulgaria (-77.1 %) and Hungary (-70.6 %), with the number also more than halving in Croatia, Greece and Estonia.
Source data for tables and graphs
Data sources
Indicator definition
Livestock patterns are defined as trends in the share of major livestock types (cattle, sheep, goats, pigs and poultry) and density of livestock units (LSU) on agricultural land.
Main indicator
Supporting indicator
- Number of animals (cattle, sheep, goats, pigs and poultry)
- Share (%) of major livestock types (cattle, sheep, goats, pigs and poultry) in total livestock population
- Grazing livestock density (grazing livestock units/hectares of fodder area)
Links with other indicators
This indicator has links to a number of other AEI indicators that describe developments in some of the main contributory factors.
Data used
Livestock patterns are described on the basis of data from the Farm structure survey (FSS). The FSS is carried out by all EU Member States, it is conducted consistently throughout the EU with a common methodology at a regular base and therefore provides comparable and representative statistics on livestock and land use across countries and time, at regional levels (down to NUTS 3 level). Every three or four years the FSS is carried out as a sample survey and once in ten years as a census.
The unit underlying the FSS is the agricultural holding, a technical-economic unit under single management engaged in agricultural production. Until 2007, the FSS covered all agricultural holdings with a UAA of at least one hectare (ha) and those holdings with a UAA of less than one hectare if their market production exceeded certain natural thresholds. From 2008 onwards, the thresholds for agricultural holdings changed to cover a range of physical thresholds. This has an impact on the comparability of data across time. More information about the thresholds can be found in the background article Farm structure survey – survey coverage.
Data on livestock are also available from annual livestock statistics. The livestock survey, a frequent and specialised survey, provides information about the livestock population in the European Union (EU) at national and regional level. It is conducted once a year, in December, in all Member States.
Data on land use are also available from crop statistics. Crop statistics are collected consistently throughout the EU with a common methodology annually and therefore provide comparable and representative statistics on land use across countries and time, at national level. Data on land use from this data source might however differ from data collected by FSS, due to differences in data collection methods and populations.
Methodology
In this article, holdings are counted as holdings with livestock when they have cattle, goats, sheep, pigs, poultry and rabbits. The total number of livestock units (LSU) is calculated as the sum of the LSU of cattle, goats, sheep, pigs, poultry and rabbits. In this article, holdings with livestock exclude holdings with zero LSU.
The total livestock density measures the stock of animals (cattle, sheep, goats, pigs, poultry and rabbits) expressed in LSU per hectare of utilised agricultural area. Livestock numbers are converted into livestock units using specific coefficients. A livestock unit (LSU) is a reference unit which facilitates the aggregation of livestock from various species and ages. Livestock units are not calculated for bees and other livestock.
The utilised agricultural area (UAA) is the total area taken up by arable land (including temporary grassland and fallow land), permanent grassland, permanent crops and kitchen gardens. It should be noted that common land is included in FSS in some countries and this has an impact on the comparability of data on land use. More information on this can be found in the background article on Farm structure survey – common land.
The grazing livestock density measures the stock of grazing animals (cattle, sheep, goats) expressed in livestock units (LSU) per hectare of fodder area. The fodder area is the sum of fodder brassicas and roots, forage plants and permanent grassland (excluding permanent grassland no longer used for production or eligible for subsidies).
Context
Introduction
Livestock patterns help to interpret the relationship between agricultural livestock production and the environment by describing the types and numbers of animals raised in an area. This article uses livestock density as an indicator of the pressure of livestock farming on the environment. The impacts of livestock farming vary depending on the intensity of farming. Extensive grazing regions can be, for example, biodiversity hotspots[1], but when the pressure of livestock production has gone beyond the adsorptive capacity of the resource base, water and air pollution occur.
Total livestock density, defined as the ratio of total livestock (including battery (indoor) animals such as pigs and poultry) to the total utilised agricultural area (UAA) of a farm, region, or country, is therefore an indicator of the intensity of livestock production. Livestock management and the area needed for it differs between farming systems. While grazing of herbivorous livestock (bovines, sheep and goat) is a mandatory feature of organic farming, in 'zero hectare' farms[2] animals are kept indoors and are fed with harvested fodder, or a concentrated diet of grain, soy and other supplements. Granivores (pig and poultry) are usually fed with specific feedstuffs. As a result, farms raising granivores do not necessarily need agricultural land.
Policy relevance and context
The Common Agricultural Policy (CAP) consists of several instruments that affect livestock patterns in different ways. Farmers are encouraged to continue playing a positive role in the maintenance of the countryside and the environment. Livestock units (LSU) are one of the forty-five CAP context indicators that were identified to describe the general context in which policy measures are designed, planned and implemented. They form part of the Monitoring and Evaluation Framework for the CAP 2014-2020 and are used in Rural Development Programmes for a comprehensive overall description of the current situation of the programming area.
Agri-environmental context
Cropping and livestock patterns influence natural resources (soil, water and air) and delivery of ecosystem services (carbon sequestration, water quality and quantity, air quality, etc.). A mosaic of different types of crops and grassland, such as mixtures of arable and permanent crops can make EU landscapes more attractive and provide greater habitat diversity for farmland species[3].
Grazing by livestock has created the landscape and habitat diversity of pastoral farming systems, which remain particularly important in the mountainous regions of Europe[4]. Without grazing by livestock, especially cattle and sheep, most of these valued agricultural landscapes would disappear. Extensively managed permanent grassland with low grazing livestock densities provide habitats for many specialised plant and animal species[5][6]. But low total and grazing livestock densities could also indicate a risk of land abandonment which may result in the loss of environmental diversity, while high grazing livestock densities could indicate overgrazing with increased risks of soil erosion and nutrient surpluses.
The total livestock density reflects the pressure on the environment from manure. Exports of manure and manure processing to reduce nutrients are non-significant in most countries and storage capacity of manure is limited, so increases in livestock units per ha UAA lead to increased manure-spreading on the area concerned. Excessive manure-spreading could increase nutrient surpluses. Intensive livestock systems, especially pig and poultry production, are one of the main sources of potential nutrient surpluses, with associated environmental impacts on air and water.
A high number of animals per ha could also lead to intensification of fodder production and imports of animal feedstuffs to meet the feed requirements of the animals. Such imports are an external source of nutrients and therefore leads to additional emissions of NH3 and nutrient surplus of soils. High total livestock densities are therefore associated with pressure on the environment in general and air and water quality in particular. Low total livestock densities could indicate high specialisation on crop production and insufficient provision of manure, which could increase the need for industrial fertilisers which contribute to GHG emissions through its production.
Storage, management and application of manure also leads to emissions of air pollutants such as NOx and NH3 and emission of fine particles with a diameter of 2.5 μm or less (so-called PM2.5). Release of ammonia from animal husbandry and fertilizer use is a leading cause of air pollution, especially in large parts of Europe [7]
Livestock production generates the largest share of food-related greenhouse gas (GHG) emissions[8] both directly through enteric fermentation in ruminants and through emission related to manure. Livestock farming is a food production process with relatively low calories or proteins produced per area (as compared with vegetal protein crops such as cereals or pulses). On the other hand, ruminants are able to convert for humans inedible biomass into high quality food on land that otherwise not always could be brought into agricultural production[9].
Direct access to
- Cross-cutting topics - Agri-environmental indicators
- Farm structure (t_ef)
- Agricultural production (t_apro)
- Agriculture and environment (aei)
- Farm structure (ef)
- Main farm indicators by NUTS 2 regions (ef_mainfarm)
- Farm land use by NUTS 2 regions (ef_landuse)
- Farm livestock (ef_livestock)
- Farm structure - 2008 legislation (from 2005 onwards) (ef_main)
- Key farm variables (ef_kv)
- Overview - Farm livestock (ef_ols)
- Livestock: number of farms and heads of animals by type of farming (2-digit) (ef_olslsuft)
- Livestock: number of farms and heads of animals of different types by agricultural size of farm (UAA) and NUTS 2 regions (ef_olsaareg)
- Livestock: number of farms and heads of animals by livestock units (LSU) of farm and NUTS 2 regions (ef_olslsureg)
- Farm structure - 2008 legislation (from 2005 onwards) (ef_main)
- Agricultural production (apro)
- Animal production (apro_anip)
- Poultry farming (apro_ec)
- Livestock and meat (apro_mt)
- Animal production (apro_anip)
- Agriculture, forestry and fishery statistics - 2018 edition
- Structure of agricultural holdings (ef_esms)
- Commission Communication COM(2006)508 final - Development of agri-environmental indicators for monitoring the integration of environmental concerns into the common agricultural policy
- Commission Staff working document accompanying COM(2006)508 final
- European Commission
- DG Agriculture and Rural Development
- DG Environment
Notes
- ↑ Jedicke, E., Metzner, J., Unse, L., Extensive grazing – Sustainable nature conservation on pastures in the EU, the German federation and its federal states, 2010.
- ↑ ,Farms with livestock but no utilised agricultural area.
- ↑ Beaufoy, G., Baldock, D., Clark, J., The Nature of Farming: Low intensity farming systems in nine European countries. London, Institute for European Environmental Policy, 66, 1994.
- ↑ Bignal, E.M., McCracken, D.I., 'The nature conservation value of European traditional farming systems'. Environmental Reviews, No 8, 2000, pp. 149-171.
- ↑ Brak, B.H., Hilarides, L., Elbersen, B.S., van Wingerden, W., Extensive livestock systems and biodiversity: The case of Islay. Alterra Report 1100, Wageningen, 2004.
- ↑ Beaufoy, G., Baldock, D., Clark, J., The Nature of Farming: Low intensity farming systems in nine European countries. London, Institute for European Environmental Policy, 66, 1994.
- ↑ Andrea Pozzer et al. , 'Impact of agricultural emission reductions on fine-particulate matter and public health', Atmospheric Chemistry and Physics, 2017. (DOI: 10.5194/acp-17-12813-2017)
- ↑ Gerber P. J. et al., Tackling climate change through livestock: a global assessment of emission and mitigation opportunities, Food and Agriculture Organization of the UN, 2013.
- ↑ Parodi, A., Leip, A., De Boer, I.J.M., Slegers, P.M., Ziegler, F., Temme, E.H.M., Herrero, M., Tuomisto, H., Valin, H., Van Middelaar, C.E., Van Loon, J.J.A., Van Zanten, H.H.E., Future foods: towards a sustainable and healthy diet for a growing population, Nature Sustainability (in print), 2018.
