Archive:Nitrogen balance in agriculture
- Data from September 2011, most recent data:: Further Eurostat information, Database.
This article presents recent statistics on the gross nitrogen balance in agriculture at the level of the European Union (EU), its Member States and some of the EFTA countries. The gross nitrogen balance indicator provides an insight into the links between agricultural nitrogen (N) use, losses of N to the environment, and the sustainable use of soil N resources; it indicates the total potential risk to the environment (air, water and soil).
Nitrogen is important to all life. Nitrogen in the atmosphere or in the soil can go through many complex chemical and biological changes, be combined into living and non-living material, and return back to the soil or air in a continuing cycle. This is called the nitrogen cycle.
Source: Eurostat (aei_pr_gnb)
Main statistical findings
Source: Eurostat (aei_pr_gnb)
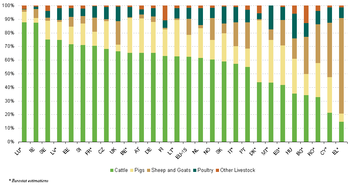
Source: Eurostat (aei_pr_gnb)
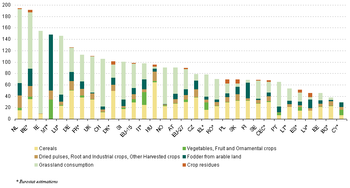
Source: Eurostat (aei_pr_gnb)
Gross nitrogen balance trends
Most countries reduced the gross nitrogen balance per ha in the period 2005-2008
All the figures in this article are presented as averages over a period of 5 years. Meteorological conditions have a big impact on the annual estimated gross nitrogen balances. The amount of nutrients removed with the harvest and grazing of crops and fodder, is depending on the nutrient content of crops and fodder and the yields of crops and fodder. The nutrient content of fodder and crops is estimated to be more or less constant in most countries. The amount of nutrients removed with the harvest and grazing of crops and fodder is therefore mainly depending on yields. Yields are depending on farmer practices (like pesticide and fertiliser use, irrigation etc) and on meteorological conditions. Metereological conditions vary significantly from year to year and these fluctuations can also be seen in the estimated nutrient output and surplus. In 2003 and 2007 for instance, large parts of Europe were hit by extreme weather causing significant drops in crop production, a peak in the balance can be noted for these years in some Member States. Variations in the nutrient surplus between years should therefore be interpreted with care. To limit the impact of metereological conditions on the trend, the trend can best be analysed looking at averages over a period of a few years.
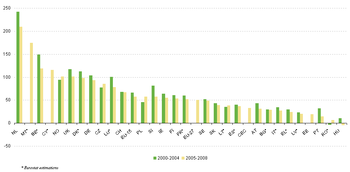
Between 2005 and 2008, the gross nitrogen balance for the EU-27 remained relatively stable, with an estimated average of 50 kilograms of N per hectare of agricultural area. In the EU-15 the gross nitrogen balance fell from an estimated average of 66 kg/ha over the period 2000-2004 to an estimated average of 58 kg/ha over the period 2005-2008. In the ten former Central European candidate countries (CEC) which joined the EU in 2004 and 2007 (PL, SI, SK, EE, LT, LV, CZ, HU, RO and BG - see country codes) the gross nitrogen balance was much lower than in the EU-15, with an estimated average of 33 kg/ha over the period 2005-2008.
The nitrogen surplus is highest in countries in the North-West of Europe (BE, NL, NO, UK, DE, DK) and the Mediterranean islands (MT and CY), while the Mediterranean countries (PT, IT, ES, EL) and many of the former CEC countries belong to the countries with the lowest nitrogen surpluses. Figure 1 shows the average gross nitrogen balance per hectare of agricultural land (the total of arable land, land under permanent crops and permanent grassland) for the periods 2000-2004 and 2005-2008. Most countries reduced the gross nitrogen balance per ha in the period 2005-2008 compared to the period 2000-2004. Exceptions were CZ, PL, RO and NO. The average gross nitrogen balance could not be estimated for the period 2000-2004 for CY, MT and EE due to missing data.
Nitrogen inputs
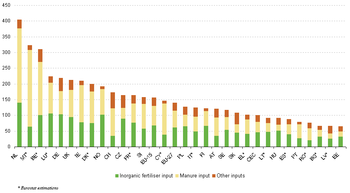
Many of the countries with a high average nitrogen surplus between 2005 and 2008 also have a relative high nitrogen input per ha (for instance NL, MT, BE), see Figure 2. A high input does however not necessarily lead to a high nitrogen balance, as the balance is also determined by the output. The nitrogen input per ha of IE (estimated at 210 kg N per ha) for instance is comparable to that of the UK (estimated at 212 kg N per ha), but the N surplus of IE is 45 % lower, as the nitrogen output per ha in IE was estimated on average 155 kg N per ha and the output in the UK only 111 kg N per ha.
Fertilisers
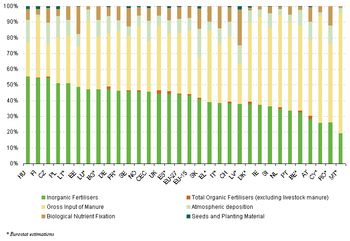
Inorganic fertilisers and manure account for more than 80 % of the nitrogen input in the EU-27 between 2005 and 2008, see Figure 3. The recovery of nitrogen through the use of compost, sewage sludge, industrial waste etc is insignificant at the moment. Data on other organic fertilisers are however lacking in many countries, the significance of these fertilisers could therefore be underestimated. The fixation of nitrogen by leguminous crops and free living organisms contributes on average 7 % to total nitrogen input in the EU-27. The biological nitrogen fixation in grasslands mixed with leguminous crops is however not included in the estimations, the significance of biological fixation might therefore be underestimated. The level of atmospheric deposition is depending on NH3 emissions (of which agriculture is the main source) and nitrogen oxides emissions (where the contribution of agriculture is negliglible) and climate conditions (transport through air to other regions). Atmospheric deposition contributed on average to 9 % of total inputs in the EU-27.
The choice of fertiliser type (manure, mineral fertilisers, other organic fertilisers) has different impacts on the environment:
- Nitrogen volatilises from manure in animal housing, storage and with the application to the land. These emissions mainly depend on the type of manure, farm management practices like type of animal housing, manure storage, timing and application techniques.
- N emissions from mineral fertilisers during the application to the land depend on type of fertiliser, farm management practices like application techniques, timing and other factors such as soil type, and weather conditions.
- The N is not available to the plant in the same rate for different types of manure and mineral fertilisers.
- Other potential fertilisers like urban wastes often include health hazards (to both plants and humans) and procedures commonly used to reduce these hazards - such as composting - tend to reduce the fertiliser value (leaching/volatilisation).
- Nitrogenous fertilisers are produced using gas, the production of N fertilisers contributes therefore to GHG emissions and fossil fuel depletion.
Manure input
The share of manure in total inputs was on average for 2005-2008 smaller in the former CEC countries (32 %) than in the EU-15 (40 %). Manure withdrawals and imports are significant only in a very few countries (BE, NL, HU). This means that for most countries the manure input is mainly determined by the amount of manure produced in the country. The manure production in kg N per ha was almost twice as high on average in the EU-15 as in the former CEC countries in the period 2005-2008. The manure nitrogen production is determined by the amount and the type of livestock in the country. Figure 4 in Agri-environmental statistics show the livestock density in the EU in 2007. MT, NL, BE, DK, CY and IE have the highest livestock densities and also have the highest rates of manure input per ha (>=100 kg N per ha). RO, BG, LT, SK, EE and LV have the lowest livestock densities and also belong to the countries with the lowest rates of manure input per ha (<40 kg N per ha). The countries with the highest livestock densities also belong to the countries with a high share (>=50 %) of manure in total input. PT and RO, two countries with a relative low livestock density have a relative high share of manure in total input as well, due to a low use of fertilisers.
Figure 2 shows that some of the countries (NL, BE) with the highest use of manure per ha also have a high use of mineral fertilisers (>100 kg N per ha), while some of the countries (RO, ES, LT, SK, BG, LV, EE) with the lowest rates of manure per ha (<40 kg N per ha) also belong to the countries with a relative low use (<50 kg N per ha) of mineral fertilisers per ha.
Figure 4 shows that cattle is the main source of manure production and more than 50 % in all countries except in DK (where pigs have the highest share), in MT, ES, HU, BG, RO (where different livestock types are important), and in CY and EL (where sheep and goats have the highest share).
Nitrogen outputs
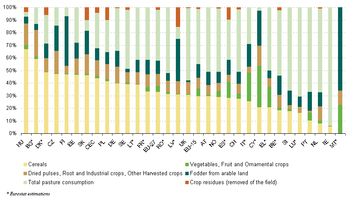
The removal of N with harvest and grazing of crops and forage per ha varies between crops and countries as can be seen in Figure 5. Per ha, grassland and cereals production have the highest N removal rates, though great variation exists between countries due to differences in yields and N content per tonne of product. The N content per tonne product is among others depending on farmer practices like fertilisation, irrigation, mowing vs grazing etc.
The dominant share of total N output in the EU-27 (2005-2008) is the uptake of N with cereal production (ca 1/3) and grassland (40 %), see Figure 6. N output is depending on cropping patterns, yields, farm management practices (tillage, irrigation etc), climate etc. Figure 1 in Agri-environmental statistics shows the cropping pattern in 2007, when permanent and temporary grassland covered 39 % of the UAA in 2007 (38 % in 2005) and cereals 34% (same as 2005). There are however significant differences between countries, in some countries (for example UK, SI, IE, NO) grassland dominates the UAA, where for instance in BG, HU and DK cereals are the dominating crop. Permanent crops are significant in Mediterranean countries.
Data sources and availability
Methodology
The methodology of the gross nitrogen balance is described in the Eurostat/OECD Nitrogen Balance Handbook. The Nitrogen input and Nitrogen output is estimated for each item of the balance by multiplying basic data (such as crop area, crop production, livestock numbers etc) with coefficients to convert the data into Nitrogen contents.
Please note that in the current methodology no corrections are made to exclude N emissions to the air. N is emitted to the air from manure in stables, from manure and fertilisers in storage and with the application of manure and fertilisers to the agricultural soils. The total inputs, and therefore the estimated balance include these emissions. To provide a better estimator of the risk of Nitrogen leaching and run-off into water bodies, the gross nitrogen balance needs to be corrected for the N emissions to the air. At the moment it is not possible to estimate a balance corrected for the N emissions to the air. The methodology is being discussed with the Member States to allow a better indication of the risk of N leaching and run-off to the water.
Data availability
The Gross Nitrogen Balances are estimated by the countries and validated by Eurostat. Data have been received, validated and approved from AT (1985-2009), CH (1990-2008), CZ (1985-2009), DE (1990-2008), EE (2004-2008), FI (1985-2009), HU (1990-2008), IE (1985-2009), NL (1985-2008), NO (1985-2009), PL (1985-2009), PT (1995-2008), SE (1985-2009), SI (1992-2008), SK (1985-2009), UK (1990,1995,2000-2009).
Data were not available and have been estimated by Eurostat for EL (1990-2008), LU (1990-2008), IT (1990-2008), BG (1996-2008), RO (1992-2008), CY (2005-2008), LT (1997-2008), LV (2000-2008),
Due to methodological differences data have been estimated by Eurostat for BE (1990-2008), ES (1996-2008), FR (1990-2008), DK (1985-2009).
Partial data was available for MT (crop production, livestock number, agricultural area, excretion coefficients, crop coefficients). Eurostat has estimated the balances for MT (2002-2008) based on the data received by MT and other sources.
Data are available or have been estimated for the main inputs and outputs of the balance. These include: consumption of inorganic fertilisers, manure production of total livestock, biological fixation of nitrogen, atmospheric deposition of nitrogen, removal of nutrients by the harvest of crops, removal of nutrients by the harvest and grazing of fodder.
Data are less available for: consumption of organic fertilisers (excluding manure), manure withdrawals, manure stocks, manure imports and seeds and planting material.
Data sources
Inorganic fertilisers
Most countries use data based on sales and/or production and trade statistics. Some countries use farmer surveys. Data based on sales and/or production and trade statistics may be biased due to the inclusion of fertilisers not used in agriculture (private/public sector use, explosives, intermediate products etc). Reliability and accuracy of farmer surveys depend a.o. on the sampling design and size. For countries who did not submit data to Eurostat, data from Fertilisers Europe have been used and of the FAO in the case of MT.
Organic fertilisers (excluding manure)
Data on organic fertilisers (excluding manure) are only available in a limited amount of countries (AT, BE, DE, ES, FI, IE, NL, SE, UK, CZ, HU, SK, CH, NO, DK). Data from these countries show that organic fertilisers are not very significant in the N balance (<3 % of total inputs on average between 2005-2008), the effect of missing data on organic fertilisers is therefore likely to be minor on the gross nitrogen balance.
Manure production
Manure production is estimated from animal numbers and excretion coefficients. Animal numbers should reflect the average amount of animals present during the year. Data on cattle, pigs, goats and sheep are available from European harmonised data sources such as the annual livestock statistics, the FSS and livestock registers. The data reported by the countries have been verified with available data sources in Eurostat. Livestock surveys may however not represent the average amount of animals well as they refer to a specific day, which means that offspring for instance may not be included very well, however a correction can be made in the excretion coefficients to take into account the offspring. For poultry and other livestock data is less available. Some poultry types and equidea are counted in the FSS, Countries may have other data sources available to estimate poultry and other livestock types. The available data show that poultry is of some importance in some countries (UK, NL, SK, IT, MT, HU, CY >10 % of total N manure production between 2005-2008), while other livestock is not significant in most countries (<5 %, except DK (6 %), FI (11 %), HU (6 %), BG (13 %)). Missing data on poultry and other livestock could lead to a minor underestimation of the balance.
As manure is a large input in the balance, excretion coefficients have a big impact on the final outcome. Excretion coefficients vary widely between countries, partly this reflects differences in farming practices and partly differences are caused due to the applied methodology and availability of data to calculate the coefficients. The coefficients reported by the countries are not always consistent with coefficients reported to the UNFCCC GHG submissions. It is necessary to establish guidelines on the excretion coefficients to be used, to improve the transparency and the comparability of the balances between countries. For some countries N excretion coefficients were not available, for these countries the manure production has been estimated based on the data reported to the UNFCCC GHG Inventory 2010.
Manure withdrawals
Available data on manure withdrawals show that manure withdrawals are significant in BE (Flanders region) and NL (ca 7 % of total manure production between 2005-2008), HU (20 %), while non-significant (<5 % ) in other countries (AT, CH, ES, UK, NO, EE and CZ). Most countries however do not have data or only limited data available on manure withdrawals, in the case when there are significant withdrawals this may lead to some overestimation of the manure input.
Change in manure stocks
Almost none of the countries have data available on changes in manure stocks. Under normal circumstances it can be assumed the change in manure stocks is on average zero.
Manure imports
Data on manure imports were only available from NO, CH, AT, NL and BE (Flanders). Manure imports were insignificant (<1 % of total manure input average 2005-2008) for these countries. Trade of manure occurs mainly from high surplus countries to neighboring countries. It is known that there are exports from for instance the NL to FR and DE. It is likely that countries with a high nutrient surplus like BE and DK may export manure as well. The exact amounts which goes to which country are not available, however from the size of the exports of the Netherlands it can be assumed that the effect on the balance of DE and FR is very limited, the manure imports are likely to be less than 5 % of the total manure input.
Biological fixation
Biological fixation by leguminous crops is calculated based on the area of leguminous crops and fixation coefficients. Biological fixation by free living organisms is calculated by the area of arable land, permanent grassland and land under permanent crops multiplied with a coefficient. Data on areas of leguminous crops are generally available from landuse statistics. There is a wide variation in coefficients of biological fixation by leguminous crops between countries, partly this reflects differences climate and partly differences are caused due to the applied methodology (measurements, scientific research, expert judgements). It is necessary to review the coefficients used in relation to climate and crop N uptake.
Estimation of fixation by clover (and other leguminous plants mixtures) in pastures have not been included in the current version of the nutrient balances. This is because methodological improvements are necessary for the estimation of fixation by leguminous crops in pastures and not all Member States are able to estimate the fixation by leguminous crops in pastures at the moment. Data available from DK show that N fixation by grass-clover mixtures by DK contributes to ca 5 % of total inputs in 2000-2009 of DK.
Atmospheric deposition
Atmospheric N deposition is estimated from landuse data and deposition rates. Some countries annually update deposition rates. Countries use different methodologies to estimate deposition rates (models, measurements, expert judgment, scientific research). Data on national N deposition should be available for all signatories to the UNECE Convention on Long-Range Transboundary Air pollution. Modeled data is also available from EMEP at http://webdab.emep.int/Unified_Model_Results/.
Seeds and planting materials
Data on seeds and planting material are not available from all countries. Available data show however that seeds and planting material are of negliglible importance to the gross nitrogen balance (<2 % of total N input, average 2005-2008).
Harvested crop production
Data on harvested crops are available from annual statistics.
Coefficients of nutrient contents of crop production vary between countries, partly this reflects differences in farming practices and climate and partly differences are caused due to the applied methodology (measurements, scientific research, expert judgements). It is necessary to review the coefficients used in relation to fertiliser and manure input and climate.
Crop residuals
Data on crop residuals removed from the field are limited available. Available data shows that the share of crop residuals in total N output ranges from <1 % till ca 15 % (average 2005-2008). Missing data on crop residuals could therefore lead to an overestimation of the balance outcome.
Fodder
Data on fodder production is partly available from European data sources. The estimates of grassland production and consumption have a big impact on the balance outcome. At the moment approaches to estimate grassland production and consumption varies significantly between countries and the uncertainty in the estimates is significant. Grassland production includes fresh matter, grass silage, hay and grass grazed by ruminants. The yield and nutrient content of grassland can be estimated from measurements, scientific research, and expert judgements. Grassland consumption can also be estimated from a fodder balance, based on feed requirements and statistics on other feed. The estimation of grass grazed is particularly difficult. Data are in many countries only limited available (in respect with grassland areas and products taken into account). There is a need to improve the estimation of grassland production and consumption.
Reference Area
Data on arable land, land under permanent crops and permanent grassland are available from Eurostat Crop Statistics. In principle only potential fertilized areas should be included in the balance and very extensive areas should be excluded from the balance. Only the UK and CH have identified extensive areas and excluded these from the balance. A clear definition of the areas to be excluded from the balance is lacking. Improvement in the definition of the reference area is needed as well as the methodology to correct for agricultural production taking place on these areas.
Context
Gross nitrogen balances and the agri-environment
The gross nitrogen balance provides an insight into the links between agricultural Nitrogen (N) use, losses of N to the environment, and the sustainable use of soil N resources. The gross nitrogen balance indicates the total potential risk to the environment (air, water and soil).
Sustainability could be defined by preserving and/or improving the level of production without degrading the natural resources. Nitrogen is important to all life. Nitrogen in the atmosphere or in the soil can go through many complex chemical and biological changes, be combined into living and non-living material, and return back to the soil or air in a continuing cycle. This is called the nitrogen cycle.
Oversimplifying the nitrogen cycle of the soil in an ecosystem: Plants use N available in the soil to grow, animals eat plants, with the death of plants and animals and with animal excretion N is returned to the soil. Agriculture breaks this cycle as N is removed from the soil of the ecosystem with the harvest of crops for human and industrial purposes and the harvest of fodder and the grazing by livestock for livestock production. The N removed from the soil does not (or only partly) return to the soil of the ecosystem. Example: a part of the N in the crops consumed by humans ends up as human excretion in the sewage. Without replenishing the N removed, the soil looses its fertility as the N stock becomes depleted and plants need N to grow. Therefore, to sustain soil fertility and the growing and harvesting of crops and fodder, fertilisation with fertilisers and manure is needed to provide the crops with the necessary N to grow. The N removed with the harvest and grazing of crops and fodder should be compensated, to preserve the level of soil fertility.
The nitrogen cycle is in reality however much more complex, it includes many flows of N between air, water and soil, and includes many transformations of N. N can be lost from the soil and leach to water or volatilise to the air:
- Bacteria in the soil transform N in Nitrate (NO3-), this proces is called nitrification. Nitrate is a form of N which is used by plants to grow. Nitrate is however also higly soluble. Depending on the amount of Nitrate in the soil, the type of soil and the amount of rainfall and use of water and Nitrate by plants, Nitrate can leach into surface and groundwater. N leaching contributes to pollution of drinking water and eutrophication of surface waters. Excessive use of manure and fertilisers can increase the amount of Nitrates in the soil and therefore increase the risk of leaching.
- Other bacteria in the soil transform N in Nitrous oxide (N2O) and dinitrogen (N2) gasses, which are emitted into the air, this proces is called denitrification. N2O is a potent greenhouse gas and contributes to climate change. Denitrification depends on the amount of organic matter, soil water content, soil oxygen supply, soil temperature, soil nitrate levels and soil pH. Excessive use of manure and fertilisers can increase the amount of Nitrates in the soil and therefore increase N2O volatilisation.
- A part of N in fertilisers and manure applied to the soil, and in a lesser degree in decaying plants, is transformed into ammonia (NH3) and emitted into the air. Ammonia emissions contribute to acidification, eutrophication and atmospheric particulate pollution. This process also occurs in manure and fertilisers during storage and in animal housings. Farmer practices such as direct incorporation of fertilisers and manure into the soil can decrease the risk of ammonia volatilisation.
There are also interactions between these processes. For instance, measures applied by farmers to reduce N emissions to the air may increase the risk of N leaching and run-off. Reducing the possibility of N to volatilise during animal housing, storage and application of manure to the land, means that a higher amount of N is available in the manure applied to the soil, increasing the potential risk of N leaching and run-off. The other way around, if more N is lost from manure due to volatilisation, a lower amount of N would be available in the manure reducing the potential risk of N leaching and run-off but increasing the potential risks of climate change, acidification etc.
The gross nitrogen balance provides an indication of all the environmental risks of N leaching, run-off and volatilisation to water, soil and air. A persistent N surplus indicates a potential risk of N leaching, run-off and volatilisation to water, soil and air. A persistent deficit indicates a potential risk of decline in soil fertility.
The gross nitrogen balance can only indicate a potential risk to the environment. The actual risk of N leaching, run-off and volatilisation depends on many factors such as metereological conditions, soil characteristics, farmer management practices etc. Not all of these factors are taken into account in the estimation of the gross nitrogen balances. The actual risks to the environment are better represented by the agri-environmental indicators 18 Ammonia emissions, 19 GHG emissions and 27.1 Water quality (Nitrate pollution). The gross nitrogen balance shows the link between agricultural activities and the environmental impact, identifying the factors determining nitrogen surpluses or deficits and the trends over time.
Gross Nitrogen Balance and policies
This indicator relates to several policies such as:
- Rural Development Programme (RDP): Various agri-environment measures tackle the problem of excess nutrients through reduced fertiliser use. Nitrogen balances are required for the RDP 2007-2013 (Council Regulation No 1698/2005) as part of the EU’s Common monitoring and evaluation framework to assess the impact of RDP.
- The Water Framework Directive (2000/60/EC) (WFD) is a legal obligation to protect and restore the quality of waters across Europe. Measures applied under the Water Framework Directive affecting the use of nitrogen in agriculture relate to best environmental practices and include the reduction of nutrient application, the modification of cultivation techniques and the proper handling of fertilisers. Most measures suggested in this context are aimed at reducing the influx of nutrients, such as nitrogen, phosphorus as well as pesticides to the groundwater as well as surface waters. The N balance surplus (every 6 years at level of water body catchment) is a commonly used indicator for identifying areas vulnerable to nutrient pollution in the WFD pressures and impacts analysis.
- The Nitrates Directive (91/676/EEC) (ND), established in 1991, aims to reduce water pollution caused or induced by nitrates from agricultural sources and prevent further such pollution. The directive requires the Member States to monitor nitrate concentrations in surface water and groundwater, identify waters affected by pollution and waters which could be affected by pollution if no measures are taken and designate vulnerable zones, defined as all known areas of land which drain into the waters identified. For these vulnerable zones, action programmes containing measures to reduce and prevent nitrate pollution must be developed, implemented and revised every four years. The action programmes of MS should contain rules relating to the limitation of the land application of fertilisers based on a balance between the foreseeable nitrogen requirements of the crops, and the nitrogen supply to the crops from the soil and fertilization. These balances should be calculated at farm level every 4 years.
- The 6th Environmental Action Programme (Decision No 1600/2002/EC) encourages the full implementation of both the ND and WFD, in order to achieve levels of water quality that do not give rise to unacceptable impacts on, and risks to, human health and the environment.
Further Eurostat information
Publications
- Agricultural statistics: Main results - 2009-10
- Environmental statistics and accounts
- Farm data needed for agri-environmental reporting
- Food: from farm to fork statistics 2011
Database
- Farm Management (aei_fm)
- Consumption estimate of manufactured fertilizers (source: Fertilizers Europe) (aei_fm_manfert)
- Pressures and risks (aei_pr)
- Gross Nutrient Balance (aei_pr_gnb)
- Agriculture (agri), see:
- Structure of agricultural holdings (ef)
- Structure of agricultural holdings: historical data (1990-2007) (ef_h)
- Land Use (ef_lu)
- Land use overview (ef_lu_ov)
- Farmland: Number of farms and areas by size of farm (UAA) and region (ef_lu_ovcropaa)
- Land use overview (ef_lu_ov)
- Livestock (ef_ls)
- Livestock overview (ef_ls_ov)
- Livestock: Number of farms and heads by size of farm (UAA) and region (ef_ls_ovaareg)
- Livestock overview (ef_ls_ov)
- Land Use (ef_lu)
- Structure of agricultural holdings: historical data (1990-2007) (ef_h)
- Agricultural products (apro)
- Crops products (apro_cp)
- Crops products: areas and productions (apro_cpp)
- Crops products (excluding fruits and vegetables) (annual data) (apro_cpp_crop)
- Fruits and vegetables (annual data) (apro_cpp_fruveg)
- Land use - 1 000 ha (annual data) (apro_cpp_luse)
- Crops products: areas and productions (apro_cpp)
- Animal production (apro_mt)
- Livestock (apro_mt_ls)
- Cattle population (annual data) (apro_mt_lscatl)
- Goats population (annual data) (apro_mt_lsgoat)
- Sheep population (annual data) (apro_mt_lssheep)
- Pig population (annual data) (apro_mt_lspig)
- Livestock (apro_mt_ls)
- Crops products (apro_cp)
Dedicated section
Methodology / Metadata
- Gross Nutrient Balances ESMS metadata
- Gross Nutrient Balances detailed metadata
- Eurostat/OECD Nitrogen Balance Handbook
Source data for tables, figures and maps on this page (MS Excel)
Other information
- Communication from the Commission to the Council and the European Parliament Development of agri-environmental indicators for monitoring the integration of environmental concerns into the common agricultural policy
- Commission staff Working Document SEC(2006) 1136 on the development of agri-environmental indicators for monitoring the integration of environmental concerns into the common agricultural policy
External links
See also
- Agri-environment indicators - essential tools to assess EU agricultural policy
- Supporting sustainable agriculture policies with multiple statistical answers
- Agri-environmental statistics
- Fertiliser consumption and nutrient balance statistics
