Enlargement countries - energy statistics
Data extracted in May 2024.
Planned article update: June 2025.
Highlights
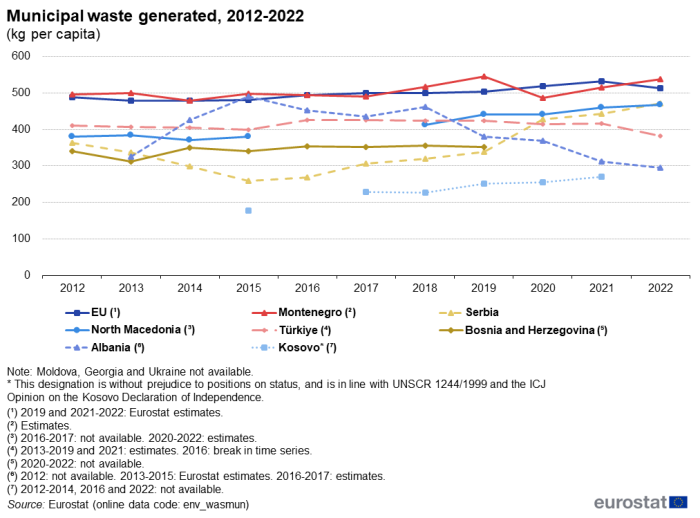
Among the candidate countries and potential candidate, Montenegro was the largest generator of municipal waste relative to population size in 2022, at 537 kg per capita.
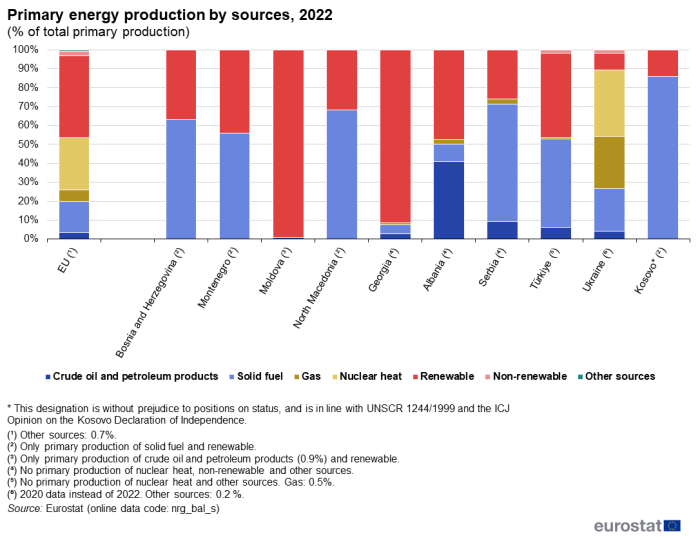
Solid fuels were the main source of primary energy production in 2022 in the candidate countries and the potential candidate, except for Moldova, Georgia, Albania and Ukraine.
In 2022, Albania had the highest share of renewables in gross final energy consumption, with a share of 44.1% of total energy consumption.
This article is part of an online publication and provides information on a range of environment statistics for the candidate countries and potential candidate, compared with the corresponding data for the European Union (EU).
The new candidate countries, Georgia, Republic of Moldova and Ukraine, are usually included in the set of articles covering the enlargement countries. However, for these articles only data which are submitted to and validated by Eurostat's subject matter units following the same process as data from Member States, are used. For Georgia, Moldova and Ukraine, data on municipal waste generation and energy productivity are not yet transmitted this way and are therefore not available yet. However, these countries are presented in the Statistics Explained articles for ENP-East countries, which are based on data supplied by and under the responsibility of the national statistical authorities of each country on a voluntary basis. Consequently, because of these separate processes, this inevitably leads to differences in data coverage between these two sets of articles.
Data shown for Georgia exclude the regions of Abkhazia and South Ossetia over which the government of Georgia does not exercise control. The data managed by the National Bureau of Statistics of the Republic of Moldova does not include data from the Transnistrian region over which the government of the Republic of Moldova does not exercise control. Since 2014, data for Ukraine generally exclude the illegally annexed Autonomous Republic of Crimea and the City of Sevastopol and the territories which are not under control of the Ukrainian government. Data on Ukraine for the year 2022 is limited due to exemption under the martial law from mandatory data submission to the State Statistics Service of Ukraine, effective as of 3 March 2022, following Russia’s war of aggression against Ukraine.
The article presents a range of indicators on resources and green transformation, such as municipal waste generated, primary energy production, net import of energy, gross inland energy consumption, the share of renewable energy in energy consumption, and energy productivity.
Full article
Municipal waste
Municipal waste is mainly produced by households, though similar wastes from sources such as distributive trades, offices and public institutions are included in the data presented. Waste from agriculture and from industry is excluded from this indicator. Municipal waste consists of waste collected by or on behalf of municipal authorities and disposed of through the waste management system. For areas not covered by a municipal waste collection scheme, the reporting countries estimate the amount of waste generated.
Among the candidate countries and the potential candidate, the quantity of municipal waste generated ranged in 2022 from 270 kilogramme (kg) per capita in Kosovo [1] (2021 – most recent data available) to 537 kg per capita in Montenegro. The quantity of municipal waste generated per capita increased from 2012 to 2022 in Serbia (+29.7 %), North Macedonia (+22.6 %), Montenegro (+8.3 %) and in Bosnia and Herzegovina (+3.5 %, between 2012 and 2019 – most recent data available) while it fell in Türkiye (-6.8 %) and Albania (-9.2 % - between 2013 – oldest data available – and 2022). In 2022, the amount of municipal waste generated per capita in the EU was 513 kg. This was more than the amount generated per capita in 2012, at 488 kg (+5.1 %).
Primary energy production by sources
Energy commodities extracted or captured directly from natural resources are called primary energy sources, while energy commodities which are produced from primary energy sources in transformation plants are called derived products. Primary energy production covers the national production of primary energy sources and takes place when natural resources are exploited, for example, in coal mines, crude oil fields, hydropower plants, or in the fabrication of biofuels. Whenever consumption exceeds primary production, the shortfall needs to be accounted for by imports of primary or derived products.
The level of primary energy production may fluctuate considerably from one year to the next because of changes in energy demand, reflecting, for example, the number of heating days; because of changes in energy prices, which are affected by international market supply and demand; and because of the weather, particularly for hydroelectric power. Developments in primary energy production may also reflect new energy sources and existing energy resources becoming depleted or being replaced.
The structure of primary energy production is largely determined by a territory's natural resources but also by its strategic policy decisions which affect the development of specific energy sources, such as the renewable energy sources. Among the candidate countries and potential candidate, solid fuels were the predominant energy source in 2022. A total of 85.9 % of Kosovo's energy production was from solid fuels and this was also the main source of primary energy production in North Macedonia (68.3 %), Bosnia and Herzegovina (63.0 %), Serbia (62.1 %), and Montenegro (55.9 %). Türkiye and Ukraine's energy production from solid fuels were lower, at 46.8 % and 22.2 % (in 2020 – most recent data available) respectively. For Albania and Georgia, solid fuels contributed only 9.2 % and 4.7 % of primary production respectively, and there was no solid fuel production in Moldova. In Albania, the contribution of petroleum products was 40.9 %, far higher than in any of the other candidate countries and potential candidate, while the shares were 9.2 % in Serbia, 6.2 % in Türkiye, 4.3 % in Ukraine (in 2020– most recent data available), 2.9 % in Georgia and 0.9 % in Moldova (Bosnia and Herzegovina, Kosovo, Montenegro and North Macedonia do not produce petroleum products). Almost all primary production in Moldova and Georgia was from renewables, with 99.1 % and 91.4 % respectively, the highest among the candidate countries and potential candidate. Almost half of the primary production was from renewables in Albania (47.5 %), Türkiye (44.6 %) and Montenegro (44.1 %). They were followed by Bosnia and Herzegovina (37.0 %), North Macedonia (31.7 %) and Serbia (26.0 %). The lowest primary energy production from renewables was observed in Kosovo (14.1 %) and Ukraine (8.9 % in 2020 – most recent data available). Ukraine is the only candidate country for which nuclear heat is a source of primary energy production as well as being its main energy source at 35.1 %, which is higher than in the EU where nuclear heat accounted for 27.6 % of its primary energy production in 2022. Ukraine's second largest source of primary energy production was gas (27.8 %), far higher than any other candidate countries and potential candidate, and higher than in the EU (6.2 %).
In 2022, renewable energy sources accounted for 43.2 % of the energy production in the EU, followed by nuclear, with 27.6 %. By contrast, only 16.4 % of its primary energy production came from solid fuels and 3.3 % from petroleum products.
(% of total primary production)
Source: Eurostat (nrg_bal_s)
Energy trade
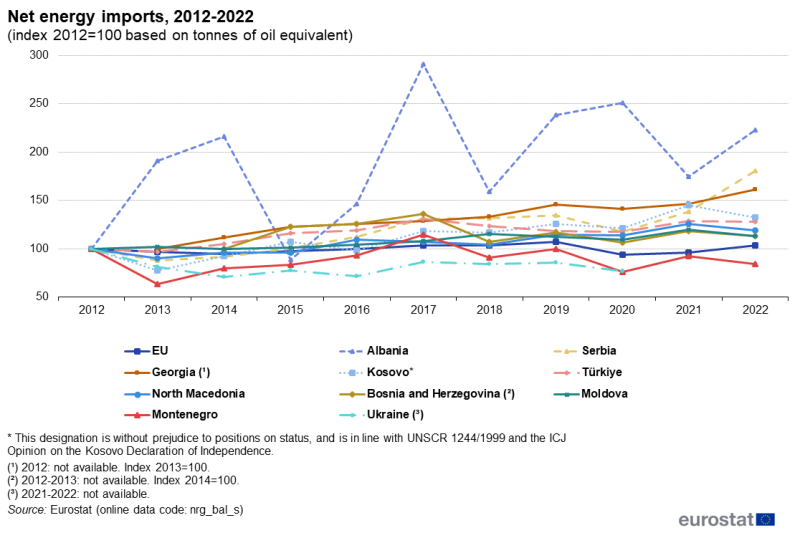
Net imports are calculated as the total quantity of imports minus the total quantity of exports. Imports represent all entries into the national territory excluding transit quantities; exports similarly cover all quantities exported from the national territory. In the following description of developments between 2012 and 2022, the 2012 value for each country is regarded as the base value (100 points) to which other years' values are compared. Albania recorded the highest increase of the net energy imports among all candidate countries and potential candidate, with a rise of 122.9 percentage points (pp) between 2012 and 2022. Moreover, the net imports in Albania varied significantly over this period. There was an increase of 115.8 pp between 2012 and 2014, followed by a decrease of 127.4 pp in 2015. Net imports then rose by 202.5 pp between 2015 and 2017, to decrease again by 131.9 pp in 2018. In contrast, net imports in the other candidate countries and potential candidate followed either a relatively steady growth or decrease. Net energy imports in Serbia and Georgia recorded significant increases, with +80.8 pp between 2012 and 2022 and +61.5 pp between 2013 (oldest data available) and 2022 respectively. Increases in net energy imports between 2012 and 2022 were also observed in Kosovo (+32.1 pp) and Türkiye (+27.6 pp). The increases were less pronounced in North Macedonia (+19.3 pp), Bosnia and Herzegovina (+13.5 pp) and Moldova (+13.1 pp). Montenegro and Ukraine were the only countries that saw a decrease of their net energy imports between 2012 and 2022, with drops of 15.8 pp and 23.4 pp (between 2012 and 2022 – most recent data available) respectively. In the EU, the net energy imports were stable over the period from 2012 to 2022, with an increase of 3.4 pp between these two reference years.
Energy consumption
Gross inland energy consumption is an indicator of the overall energy needs of an economy, these being met by primary production and net imports (with data also reflecting changes in stocks and bunkers).
In 2022, the gross inland energy consumption among the candidate countries and the potential candidate ranged from 791 kilogramme of oil equivalent per capita (kgoe per capita) to 2 417 kgoe per capita. Between 2014 (oldest data available) and 2022, the gross inland consumption increased by more than half in Georgia (+57.9 %), which was the highest increase among the candidate countries and potential candidate. Moldova’s gross inland energy consumption also increased by close to half between 2012 and 2022 (+45.3 %). In Türkiye, the gross inland consumption increased by a quarter (+26.4 %) between 2012 and 2022. Increases above 10 % were observed in Kosovo (+19.9 % between 2012 and 2021 – more recent data available), Serbia (+19.4 %) and Albania (+13.5 %). The gross inland consumption recorded the lowest increase between 2012 and 2022 in North Macedonia, of just +2.3 %. By contrast, gross inland energy consumption decreased by 0.4 % in Montenegro, while it dropped by almost a quarter in Ukraine (-23.3 % between 2012 and 2020 – most recent data available). Despite having the shortest period for which data are available (2014 to 2019), Bosnia and Herzegovina had the third highest increase in gross inland energy consumption, with a rise of +32.1 %. Between 2012 and 2022, the EU's gross inland energy consumption decreased by 10.7 %, showing a steady decrease over this period.
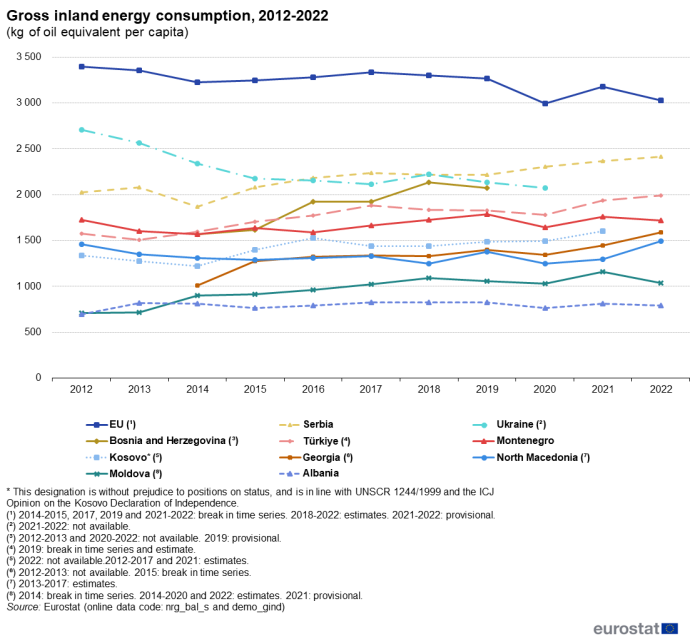
(kg of oil equivalent per capita)
Source: Eurostat (nrg_bal_s) and (demo_gind)
Renewables in gross final energy consumption
The share of renewable energy in gross final energy consumption is the ratio between the renewable energy delivered to final consumers and the gross final energy consumption, which is the total energy consumed by end users.
In 2022, Albania, Montenegro, Bosnia and Herzegovina (in 2021 – most recent data available) and Serbia had higher shares of renewables in gross final energy consumption than the EU. Moldova, Georgia, Kosovo and North Macedonia had lower shares than the EU. In 2012, all the candidate countries and the potential candidate for which data were available had higher shares than the EU (see Figures 5). No data is available for Türkiye and Ukraine.
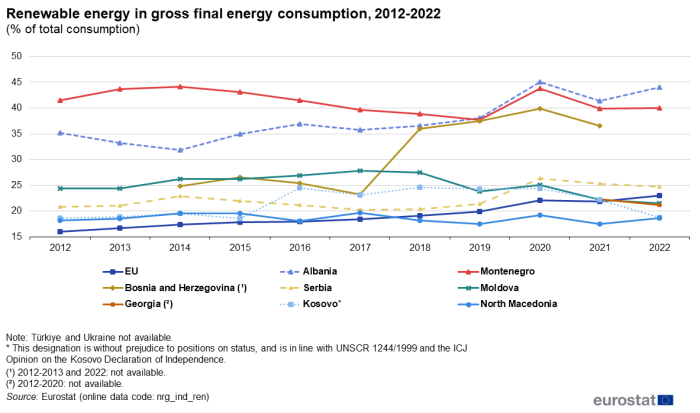
(% of total consumption)
Source: Eurostat (nrg_ind_ren)
In 2022, Albania had the highest share of renewables in gross final energy consumption among the candidate countries and potential candidate (44.1 %), an increase of 8.9 pp compared with 2012. Montenegro came second with a share of 39.9 %, a decrease of 1.6 pp from the level recorded in 2012, followed by Bosnia and Herzegovina with a share of 36.6 % (in 2021 – most recent data available), an increase of 11.7 pp compared with 2014 (oldest data available). For Serbia, the share of renewables in gross final energy consumption in 2022 was 24.7 %, which showed an increase of 3.9 pp compared with 2012. Moldova's share of renewables in gross final energy consumption in 2012 at 24.3 %, was above the EU's share, 16.0 %, but at 21.5 % in 2022 it fell below it (23.0 %). Kosovo and North Macedonia recorded the lowest shares in 2022: 18.8 % (up by 0.2 pp compared with 2012) and 18.7 % (up by 0.6 pp compared with 2012) respectively. The share of renewable energy in gross final energy consumption in Georgia was available only for the years 2021 and 2022, and showed a decrease of 1.2 pp, from 22.3 % to 21.2 %.
Energy productivity
Energy productivity measures the amount of economic output produced per unit of gross available energy (GAE). Gross available energy represents the quantity of energy products needed to satisfy all energy needs of entities in the geographical area under consideration.
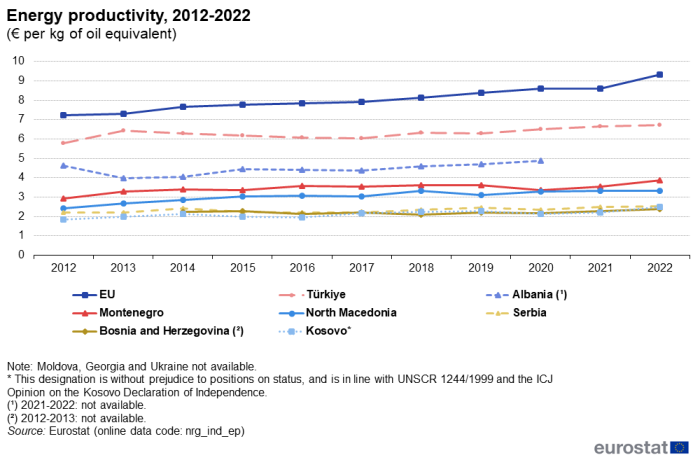
In 2022, Türkiye had an energy productivity of €6.7 per kilogramme of oil equivalent (kgoe), being the highest among the candidate countries and the potential candidate. It increased by €0.9 per kgoe compared with 2012. It was followed by Montenegro, with an energy production of €3.9 per kgoe in 2022, also an increase of €0.9 per kgoe compared with 2012, just like North Macedonia that had an energy productivity of €2.4 per kgoe in 2012 and €3.3 per kgoe in 2022. Serbia and Kosovo had an energy productivity of €2.5 per kgoe in 2022, increasing by €0.3 per kgoe and €0.6 per kgoe compared with 2012 respectively. Bosnia and Herzegovina’s energy productivity was the lowest in 2022, at €2.4 per kgoe, an increase of €0.1 per kgoe compared with 2014 (oldest data available). Data was only available up to 2020 in Albania, with an energy productivity of €4.9 in 2020, an increase by €0.3 per kgoe compared with 2012. In the EU, the energy productivity was €9.3 per kgoe in 2022, increasing by €2.1 per kgoe compared with 2012.
Source data for tables and graphs
Data sources
The candidate countries and potential candidate provide data on energy and waste directly to Eurostat's units responsible for energy and environment statistics, respectively; these data have been used in this article. The same process applies to Eurostat's regular collection of energy and environment data from EU Member States and EFTA countries. These statistics are also available free-of-charge on Eurostat's website. While basic principles and institutional frameworks for producing statistics are already in place, the candidate countries and potential candidate are expected to increase progressively the volume and quality of their data and to transmit these data to Eurostat in the context of the EU enlargement process. EU standards in the field of statistics require the existence of a statistical infrastructure based on principles such as professional independence, impartiality, relevance, confidentiality of individual data and easy access to official statistics; they cover methodology, classifications and standards for production.
Environment
Eurostat’s data on waste is collected on the basis of the Regulation on waste statistics (2150/2002/EC) and is published every two years in line with common methodological recommendations.
Information concerning the current statistical legislation on waste statistics can be found under 'Legislation' in Eurostat's dedicated section on Waste statistics, while further information regarding the statistical legislation on energy statistics can be found under 'Legislation' in Eurostat's dedicated section on Energy statistics.
Energy
In order to meet the increasing requirements of policymakers for energy monitoring, Eurostat has developed a coherent and harmonised system of energy statistics. As well as covering EU countries and EFTA countries, these data are also collected from the candidate countries and the potential candidate. Time series are generally available from 1990 onwards. The collection of energy data is based on Regulation (EC) No 1099/2008 of the European Parliament and of the Council of 22 October 2008 on energy statistics and its amendments. Data are available for a variety of fuel types, namely solid fuels, crude oil and petroleum products, natural and derived gases, nuclear heat, electricity, waste and renewable energy sources. Basic data on energy quantities are in fuel specific units, such as liquid fuels in thousand tonnes, and electricity in kilowatt-hours; these units are converted to common energy units (such as tonnes of oil equivalent (toe)) to allow the aggregation or comparison of data for different energy sources.
Eurostat has the responsibility to ensure that statistical production of the candidate countries and potential candidate complies with the EU acquis in the field of statistics. To do so, Eurostat supports the national statistical offices and other producers of official statistics through a range of initiatives, such as pilot surveys, training courses, traineeships, study visits, workshops and seminars, and participation in meetings within the European Statistical System (ESS). The ultimate goal is the provision of harmonised, high-quality data that conforms to European and international standards.
Context
The EU's long-term strategy for reducing greenhouse gas emissions was laid out in November 2018, with the aim of making Europe the world's first climate-neutral continent by 2050. In December 2019, the European Commission presented the European Green Deal, set out in Communication COM(2019) 640 final. The European Green Deal is a growth strategy that aims to transform the EU into a fair and prosperous society, with a modern, resource-efficient and competitive economy where there are no net emissions of greenhouse gases in 2050 and where economic growth is decoupled from resource use. The Green Deal is an integral part of this Commission’s strategy to implement the United Nation’s 2030 Agenda and the Sustainable Development Goals.
In June 2021, the European Climate Law, Regulation (EU) 2021/1119, was adopted. The European Climate Law makes the goal set out in the European Green Deal to become climate-neutral by 2050 a legal obligation for the EU and its Member States. It sets the framework for actions to reduce greenhouse gas emissions by at least 55 % levels by 2030, compared with 1990 levels, and reach climate neutrality in the EU by 2050. The Climate Law is complemented by the European Climate Pact and the 2030 Climate Target Plan, enabling the EU to move towards a climate-neutral economy and implement its commitments under the Paris Agreement.
In order to deliver the European Green Deal and reduce the EU's greenhouse gas emissions by 55 % by 2030, a legally binding milestone laid down in the European Climate Law, the European Commission proposed the 'Fit for 55' package in June 2021. The 'Fit for 55' package is the EU's key plan to turn the climate goals into EU law and comprises a set of proposals for revision of existing legislation and new initiatives in a wide range of areas. By October 2023, the final legislation of the ‘Fit for 55' package had been adopted.
Energy has been a key feature on the EU's policy agenda for a number of years, largely as a result of fluctuating energy prices; security of supply; and human induced effects of energy use on climate change, in particular, increased levels of greenhouse gas emissions. The use of renewable energy sources is seen as a key element of the EU's energy policy and should help to improve energy security; support the achievement of a carbon neutral society; and decouple energy costs from oil prices.
Alongside this, EU policy has also supported the development of gas pipeline and electricity transmission networks across the EU, as well as of common rules to increase competition between suppliers and promote consumer choice. Energy crises have underlined the EU's need to work with its neighbours on energy security, including diversification of energy sources, routes and suppliers.
Additional information on statistical cooperation with the candidate countries and the potential candidate is provided in the Statistics explained background article Enlargement policy and statistical cooperation.
Direct access to
Other articles
- Enlargement countries — statistical overview — online publication
- Statistical cooperation — online publication
- Energy statistics - an overview — online publication
- Energy
Publications
- Statistical books/pocketbooks
- Key figures on enlargement countries — 2019 edition
- Key figures on enlargement countries — 2017 edition
- Key figures on the enlargement countries — 2014 edition
- Factsheets
- Basic figures on the candidate countries and potential candidates — Factsheets — 2023 edition
- Basic figures on Western Balkans and Türkiye — Factsheets — 2022 edition
- Statistics for a green future — Western Balkans and Türkiye — Factsheets — 2022 edition
- Basic figures on enlargement countries — Factsheets — 2021 edition
- Leaflets
- Basic figures on enlargement countries — 2020 edition
- Basic figures on enlargement countries — 2019 edition
- Basic figures on enlargement countries — 2018 edition
- Energy and transport statistics for the enlargement countries — 2018 edition
- Basic figures on enlargement countries — 2016 edition
Dedicated section
Methodology
- Municipal waste by waste management operations (ESMS metadata file — env_wasmun)
- Energy statistics - quantities (nrg_quant) (ESMS metadata file — nrg_quant_esms)
- Regulation (EC) No 2150/2002 of 25 November 2002 on waste statistics
- Regulation (EC) No 1099/2008 of 22 October 2008 on energy statistics.
- Summaries of EU legislation: Common system for the production of energy statistics
- Roadmap for moving to a competitive low-carbon economy in 2050 (COM (2011) 112 final)
Summaries of EU legislation:
External links
- Climate and energy package
- A European Green Deal
- European Commission — Energy
- European Commission — Climate action
- European Commission — Environment
- Emissions trading system
- Energy and climate objectives for 2030
- Climate targets for 2040
- Climate long-term strategy for 2050
- European Commission — European Neighbourhood Policy and Enlargement Negotiations
Notes
- ↑ This designation is without prejudice to positions on status, and is in line with UNSCR 1244/1999 and the ICJ Opinion on the Kosovo Declaration of Independence.
