- Data from September 2012. Most recent data: Further Eurostat information, Main tables and Database.
This article presents some statistics from the most recent farm structure survey (FSS) that was conducted as an agricultural census in 2009/10. This was the first synchronised agricultural census across all EU-27 Member States, as well as Norway and Switzerland; a sample survey was also carried out in Croatia. This coordinated effort has strengthened the coherent and comparable nature of the structural data. Nevertheless, it should be noted that some methodological changes were introduced for the latest census, which limit comparability with other survey years; the minimum size threshold for agricultural holdings was raised in some of the EU Member States, while ensuring that 98 % of the farmland (known as the utilised agricultural area) and livestock of each country were covered, and common land was included.
of and 98 % of the livestock in each country.
Agricultural censuses are carried out every ten years since 1970 (basic surveys). Three intermediate Farm structure surveys (FSS) are conducted between two basic ones, i.e. with an interval of two or three years. They are conducted as sample surveys in most of the Member States.
Main statistical findings
Agricultural holdings
The Agricultural census 2010 surveyed close to 12 million farms in the EU-27. These farms covered around 170 million hectares (1.7 million km2) of UAA. This means that the UAA occupied slightly over 40 % of the EU-27 territory. The total number of livestock in EU-27 in 2010 was 134 million livestock units. The farm work in the agricultural holdings added up to 9.7 AWU in the EU-27 countries, which corresponds to 9.7 million people working full time.
The holdings from Romania (32 %) and Italy (14 %) made up for 46 % of the total number of the EU-27 holdings.
Of the total EU-27 holdings 49 % had less than 2 hectares. There were 325 thousand holdings (3 %) with a UAA of at least 100 hectares.
The distribution of the utilised agricultural area was not homogeneous within the UAA size classes. 49 % of the EU-27 smaller farms had less than 2 hectares and represented 2 % of the total UAA. 3 % of the largest farms (with at least 100 hectares) had 50 % of the share of the total EU-27 UAA.
The results of the FSS 2010 show that a quarter of the farms were specialists in field crops which includes cereals, industrial crops, and vegetables. 20 % of the EU-27 farms specialized in permanent crops and in third place, with 15 %, were the farms which concentrate their activity on grazing livestock.
Table 3: Utilised agriculture area (UAA) by size of the holding (UAA), 2010 (ha)
Source: Eurostat (ef_kvage)
Land use
With a total of 1.7 million km2, the utilised agriculture area of EU-27 was close to 0.34 hectares (3400 m2) per inhabitant in 2010.
60 % of the total EU-27 UAA was arable land. Arable land is area worked (ploughed or tilled) regularly, generally under a system of crop rotation. The FSS covers close to 40 different classes of arable land.
Ireland, Spain, Luxembourg, Austria, Portugal Slovenia and the United Kingdom had less than 50 % share of arable land in the total UAA. In all other Member States the percentage of arable land had the lion's share of the UAA.
Permanent grassland covered slightly over one third of the UAA. The percentage of permanent grassland was significant in Ireland, Austria, Slovenia, the United Kingdom and Switzerland, where farms are mostly specialised in grazing livestock.
The area of permanent crops represented 6 % of the UAA. Permanent crops had a higher share of the UAA in most of the Mediterranean countries. In Malta 10 % of the UAA was occupied by kitchen gardens.
Livestock
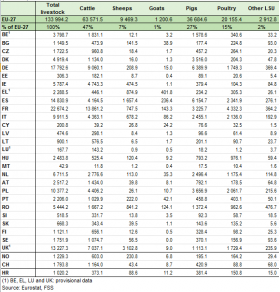
Almost half (48 %) of the livestock units surveyed in EU-27 holdings were cattle. Pigs came in second with 27.4 %, followed by poultry with 14 % share of the EU-27 livestock units.
In the FSS 2010, 47 % of the EU-27 cattle (in livestock units) were in France, Germany and the United Kingdom.
Denmark stands out as having the largest percentage of pigs (71 %) in total LSU.
Hungary holds the highest share of poultry which is close to 40 % of the country's livestock.
Economic size
The first results of the FSS 2010 show that the largest percentage of number of holdings was in the smallest economic size classes.
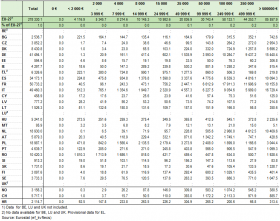
Table 8 shows that the total standard output (SO) of the 24 Member States is close to EUR 280 000 million. France Italy and Germany make up for more than half of this value.
In the results of the 24 countries available, it is clear that the largest share of the standard output (SO) is concentrated in the largest classes of SO. Excluding the three countries for which data is not yet available (Belgium, Luxembourg and the United Kingdom), 47 % of the EU-27 SO belonged to farms with a SO over EUR 250 000. These classes of farms were 1.7 % of the number of holdings amongst the 24 countries in this analysis and 25 % of the UAA.
5 % of the UAA belongs to farms with an SO of less than EUR 2 000 (Table 9).
The number of livestock units by standard output classes shows that in countries such as Hungary (7 %) and Croatia(6 %) the livestock was more representative in farms within the smallest SO classes. In the Czech Republic and Slovakia more than 75 % of the Livestock was on farms in the SO class over EUR 0.5 million (Table 10).
Table 5: Utilised agriculture area by type of crops, 2010 (1000 ha)
Source: Eurostat (ef_oluft)
Table 7: Number of holdings by standard output size classes, 2010 (1000 holdings)
Source: Eurostat (ef_kvftecs)Table 8: Standard output by standard output size classes, 2010 (Million EUR)
Source: Eurostat (ef_kvftecs)
Table 9: Utilised agricultural area (UAA) by standard output size classes, 2010 (1000 ha)
Source: Eurostat (ef_kvftecs)Table 10: Livestock by standard output, 2010 (1000 LSU)
Source: Eurostat (ef_kvftecs)
Labour force
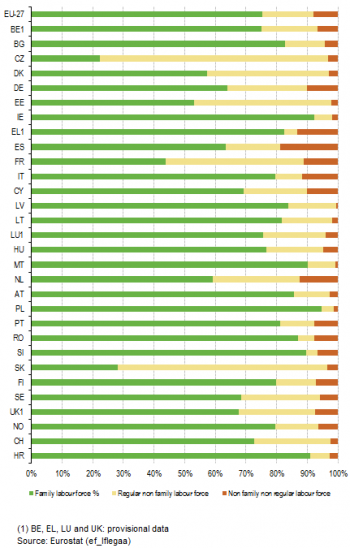
The Agricultural Census 2010 shows that around 25 million people were engaged in agricultural work in the EU-27. This includes holders, member of the holders' family and regular non family labour force. In the EU-27 aggregates, only 8 % of these people were regular non family workers.
The number of people is converted to annual work units (AWU) by taking into account the time spent on the agricultural activities. The total labour force directly employed by the EU-27 farms was 9.7 million AWU, that corresponds to 9.7 million people working full time. The share of family labour force, although dominant in most countries is less when measured in AWU. In EU-27 the share of family labour force in AWU was 75 %, regular non family labour force was 17 % and non regular non family 8 %.
Non family labour force had the highest percentage of the total labour force (in AWU) in The Czech Republic (75 %), Slovakia (72 %), France (56 %), Estonia (47 %) and Denmark (43 %). In 11 Member States the family labour force was 80 % or higher in the total AWU working in agriculture.
The distribution of the Farm labour force within the SO classes in the EU-27 aggregates was quite homogeneous in 2010. The highest percentage is in the farms with under 2000 euro of SO. Bulgaria (49 %) and Hungary (40 %) had the highest share of labour force in the smallest SO classes.
The Czech Republic (65 %) and Slovakia (56 %) are the farms with the biggest concentration of labour force in the farms with an SO over EUR 0.5 million.
Table 11: Farm labour force, 2010)
Source: Eurostat (ef_lflegaa)

Source: Eurostat (ef_mporganic)

Source: Eurostat (ef_mporganic)
Organic farming
The FSS 2010 surveyed approximately 160 000 organic farms in the EU-27, which is 1.3 % of the total number of farms. The organic area in EU-27 was 5.3 million hectares which in 3 % of the total UAA.
Austria (12 %) and Sweden (10 %) stand out with the highest percentage of organic area in the total UAA. Germany (850 000 ha) and Italy (760 000 ha) had the biggest areas of organic crop production in the EU-27, covering respectively 16 % and 15 % of the total organic area of EU-27.
Data sources and availability
The methodological notes help the reader to understand the specific concepts and assumptions used, and explain the limitations of the figures provided. For methodological information in greater depth, please check the legal basis and/or the national methodological reports provided by the Member States.
Major changes introduced by Regulation 1166/2008:
- a change in the thresholds from 2007 to 2010
- The Czech Republic, Germany and the United Kingdom have changed the threshold from 1 ha to 5 ha of UAA for including the holdings in the Census; Luxembourg has changes the threshold from 1 to 3 ha of UAA for including the holdings in the Census; Slovakia has changes the threshold from 0,5 to 1 ha of UAA for including the holdings in the Census.
- new countries including common land for the first time
- Bulgaria, France, Hungary, Ireland and Slovenia included common land for the first time in FSS 2010; common land area for Greece and the United Kingdom is not included.
- change from standard gross margin (SGM) to standard output (SO).
The basic statistical unit underlying the Farm structure survey (FSS) is the agricultural holding. A holding is defined as a techno-economic unit under single management engaged in agricultural production (including the maintenance of land in good agricultural and environmental condition).
The utilised agricultural area (UAA) is the total arable land, permanent grassland, land used for permanent crops and kitchen gardens. The UAA excludes unutilised agricultural land, woodland and land occupied by buildings, farmyards, tracks, ponds, etc.
For certain purposes, the various categories of livestock, e.g. piglets, breeding sows and other pigs, have to be aggregated. The coefficient used for this is known as the livestock unit (LSU). It is related to the feed requirements of each individual animal category. For example, 1 LSU corresponds to one dairy cow or 10 sheep.
The farm labour force includes all persons having completed their compulsory education (i.e. having reached school-leaving age) who carried out farm work on the holding during the 12 months up to the date of the survey. The figures include the holders, even when not working on the holding. Taking into account the considerable degree of part-time work in agriculture and opportunities for part-time work in other sectors of the economy, information on employment in agriculture is given in annual work units. An annual work unit (AWU) is equivalent to full-time employment. One AWU corresponds to the work performed by a person engaged in full-time agricultural work on the holding over a 12-month period. The annual working time of such a worker is 1 800 hours (225 working days of 8 hours per day), unless there are different specific national provisions governing contracts of employment. The FSS covers family (holder and member of the holder's family), non family labour force (regular and non regular) and also contractual work (workers not directly employed by the holding).
The economic dimension of the holdings is measured using standard output. For each activity on a farm (e.g. wheat, dairy cows or vineyard), a standard output (SO) is estimated. The SO is the average monetary value of the agricultural output at farm-gate price, in euro per hectare or per head of livestock and by region. The sum of all the outputs, for all activities of a given farm, is referred to as the economic size of that farm. From the FSS 2010 onwards the economic size is the SO of the farms is expressed in euro. At the time of publication only provisional data were available for Belgium, Greece, Luxembourg and the United Kingdom.
Further Eurostat information
Publications
Main tables
- Agriculture, see:
- Structure of agricultural holdings (t_ef)
Database
- Agriculture, see:
Structure of agricultural holdings (ef)
Dedicated section
Source data for tables and figures on this page (MS Excel)
Other information
- Regulation 1166/2008 of 19 November 2008 on farm structure surveys and the survey on agricultural production methods and repealing Council Regulation 571/88
- Regulation 1200/2009 of 30 November 2009 implementing Regulation 1166/2008 on farm structure surveys and the survey on agricultural production methods, as regards livestock unit coefficients and definitions of the characteristics
See also
- Agricultural census for results by country (2010)
- Agricultural census introduction for links to national websites providing first results of the Agricultural census 2010
- All articles on farm structure survey 2007
- Farm structure survey - thresholds (background article)


